| Elliott wave analysis of EUR/JPY for October 22, 2020 2020-10-22 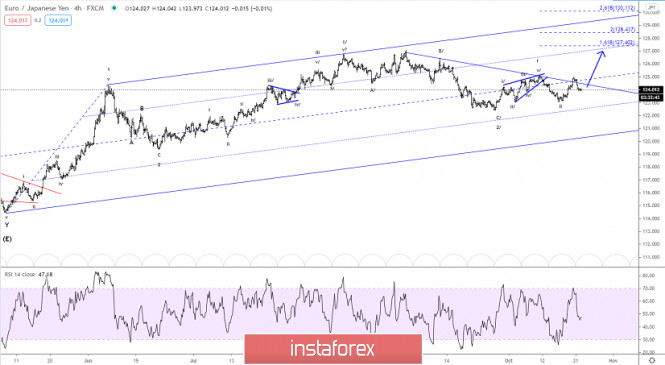
To our surprise, the correction from 125.00 has been larger than expected. EUR/JPY has re-tested the former support at 123.93. This support is holding up well and will likely prove to be the low of this correction. We need a break back above minor resistance at 124.18 and more importantly above resistance at 124.59 to confirm the next rally higher towards 128.44 and likely above. A solid support is seen in the 123.86 - 123.93 area. If support at 123.49 is broken, we will have to revise our bullish outlook. R3: 124.59 R2: 124.38 R1: 124.18 Pivot: 124.05 S1: 123.86 S2: 123.71 S3: 123.49 Trading recommendation: Our stop at 123.90 was hit for a nice little profit and we will re-buy EUR at 123.90 or upon a break above 124.18 and place our stop at 123.45. Elliott wave analysis of GBP/JPY for October 22, 2020 2020-10-22 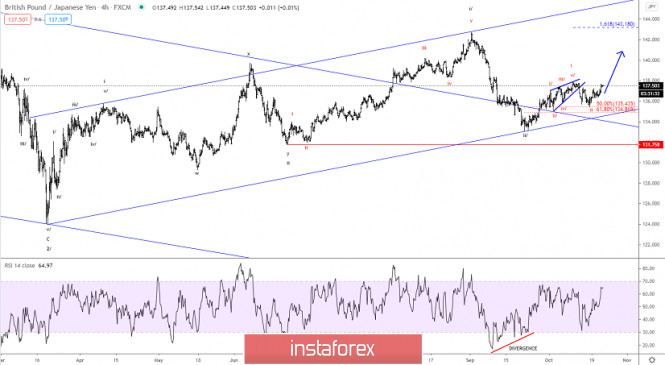
GBP/JPY moved above short-term key-resistance at 137.25. It calls for more upside pressure towards 137.88 on the way higher to 140.20 as the next target. The former resistance at 137.25 will now act as support. GBP/JPY continues to move higher. Support is seen at 137.25 and then at 137.02. R3: 139.17 R2: 138.40 R1: 137.68 Pivot: 137.46 S1: 137.25 S2: 137.02 S3: 136.81 Trading recommendation: We are long GBP from 135.45 and we will raise our stop to 136.25. Technical Analysis of GBP/USD for October 22, 2020 2020-10-22 Technical Market Outlook: The GBP/USD pair has hit the level of 1.3169 after the rally from the base level seen at 1.2925. All the technical resistance levels had been violated and now they will act as a support: 1.3121, 1,3081 and 1.3059. The momentum is strong and positive, but the market conditions are now overbought on the H4 time frame chart, so a pull-back towards the support is expected before another wave up will unfold. The next target for bulls is seen at the level of 1.3264. Weekly Pivot Points: WR3 - 1.3222 WR2 - 1.3147 WR1 - 1.3005 Weekly Pivot - 1.2924 WS1 - 1.2790 WS2 - 1.2718 WS3 - 1.2567 Trading Recommendations: On the GBP/USD pair the main, multi-year trend is down, which can be confirmed by the down candles on the monthly time frame chart. The key long-term technical resistance is still seen at the level of 1.3518. Only if one of these levels is clearly violated, the main trend might reverse (1.3518 is the reversal level) or accelerate towards the key long-term technical support is seen at the level of 1.1903 (1.2589 is the key technical support for this scenario). 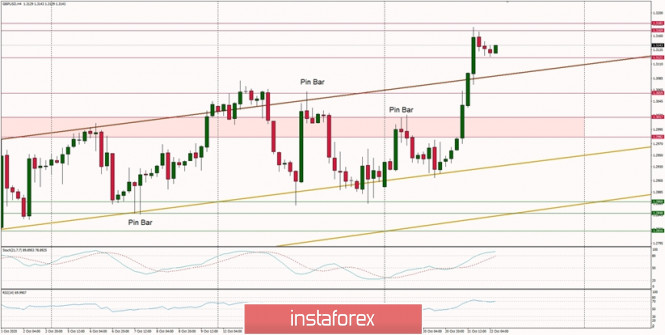
Technical Analysis of EUR/USD for October 22, 2020 2020-10-22 Technical Market Outlook: The EUR/USD made a new local high at the level of 1.1880 after the level of 1.1822 was violated again. The next target for bulls is seen at the level of 1.1908 - 1.1914, but please notice the overbought market conditions on the H4 time frame that might result in a temporary pull-back towards the nearest technical support seen at 1.1790 - 1.1822 zone. The momentum remains strong and positive, so it supports the short-term bullish outlook for this pair. Weekly Pivot Points: WR3 - 1.1924 WR2 - 1.1873 WR1 - 1.1783 Weekly Pivot - 1.1733 WS1 - 1.1641 WS2 - 1.1593 WS3 - 1.1509 Trading Recommendations: Since the middle of March 2020 the main trend is on EUR/USD pair has been up, which can be confirmed by almost 10 weekly up candles on the weekly time frame chart and 4 monthly up candles on the monthly time frame chart. Nevertheless, weekly chart is recently showing some weakness in form of a several Pin Bar candlestick patterns at the recent top seen at the level of 1.2004. This means any corrections should be used to buy the dips until the key technical support is broken. The key long-term technical support is seen at the level of 1.1445. The key long-term technical resistance is seen at the level of 1.2555. 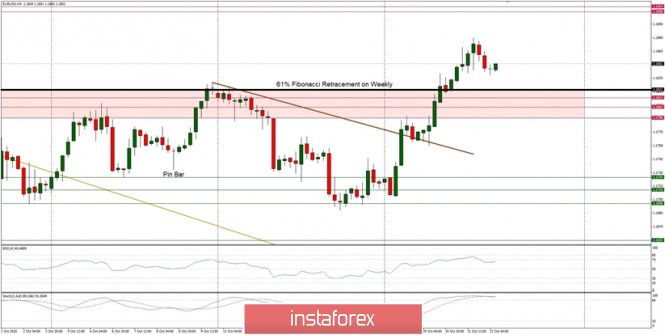
Analytics and trading signals for beginners. How to trade EUR/USD on October 22? Plan for opening and closing trades on Thursday 2020-10-22 Hourly chart of the EUR/USD pair 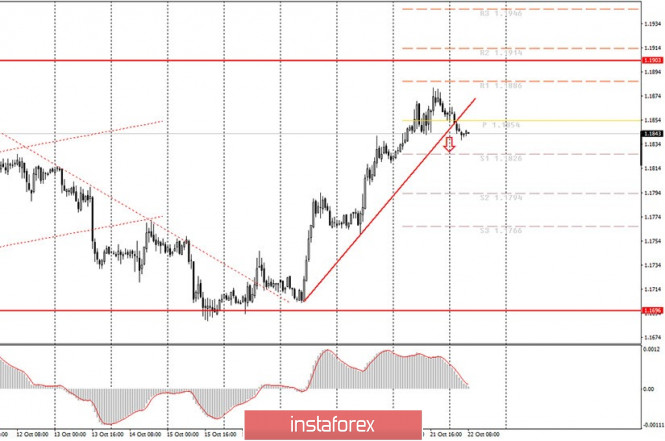 The EUR/USD pair started a downward correction last Wednesday night, which only made the technical picture even more confusing. Now several scenarios are possible at once. First, the correction, which is why the price settled below the upward trend line, can really only be a correction. In this case, you will have to rebuild the trend line, since it initially had a very strong slope and almost any pullback took the pair below it. Secondly, the trend could change to a downward one, since the euro/dollar pair approached the 1.1900 level once again, which for a long time acted as the upper border of the 1.17-1.19 horizontal channel. We mentioned last night that the likelihood of a downward reversal near the 1.1900 level is quite high. However, quotes did not reach this level, nevertheless, a reversal may occur on the way to it. Moreover, if the trend changes to a downward one and now we are waiting for it to move to 1.1700, then the pair may correct upward before continuing to move down, therefore, in the near future, the MACD indicator may turn up. In general, the situation is complex. The fundamental background for the EUR/USD pair remains unchanged. The euro has significantly grown in recent days, but, as we have already said, there is a high likelihood that its quotes will remain within 1.17-1.19. Traders continue to ignore all macroeconomic reports, and the fundamental background is quite contradictory, since there is essentially no new, important information and messages on key topics for the pair. For example, today the calendar of macroeconomic events does not contain anything interesting at all. There will only be a report on claims for unemployment benefits in America, which traders mostly brush off (except for force majeure cases). Therefore, they will either have to trade again exclusively on technical factors and signals, or else look for news on the European Union and the United States and try to understand whether they can have any influence on the course of trading. It would seem that an epidemic is raging in both the US and the EU, America is approaching the presidential elections. The last round of televised debates between Donald Trump and Joe Biden will take place in the United States, Democrats and Republicans still cannot agree on an aid package for the American economy. However, all these topics only create a general background, and the daily trades are not based on them. As we mentioned earlier, it will be difficult for the dollar to rise before the elections. Therefore, we do not expect the pair below the 1.1700 level. Possible scenarios for October 22: 1) Buy positions on the EUR/USD pair have ceased to be relevant at the moment, since the price has settled below the rising trend line. At the same time, the upward trend may still resume. However, we do not recommend novice traders to make complex trading decisions, but instead they should rely on clearer and simpler signals. Thus, it is best to resume bull trading after a new upward trend or downward trend refracts. 2) Novice traders are advised to return to selling the pair, since the price has settled below the trend line. For sell positions that are already open, we recommend keeping them with targets at 1.1826 and 1.1794 until the MACD turns up. For new short positions, you should wait for an upward correction and a new MACD sell signal. The goals are the same. On the chart: Support and Resistance Levels are the Levels that serve as targets when buying or selling the pair. You can place Take Profit near these levels. Red lines are the channels or trend lines that display the current trend and show in which direction it is better to trade now. Up/down arrows show where you should sell or buy after reaching or breaking through particular levels. The MACD indicator (14,22,3) consists of a histogram and a signal line. When they cross, this is a signal to enter the market. It is recommended to use this indicator in combination with trend lines (channels and trend lines). Important announcements and economic reports that you can always find in the news calendar can seriously influence the trajectory of a currency pair. Therefore, at the time of their release, we recommended trading as carefully as possible or exit the market in order to avoid a sharp price reversal. Beginners on Forex should remember that not every single trade has to be profitable. The development of a clear strategy and money management are the key to success in trading over a long period of time. EUR/USD: plan for the European session on October 22. COT reports. Bullish momentum is fading, but there is still a chance for the euro to rise further 2020-10-22 To open long positions on EUR/USD, you need: Buyers of the euro did not try to sustain the upward trend in the afternoon, nothing came of it. Let's take a look at the 5-minute chart and break down yesterday's trades. Bulls failed to go beyond 1.1868 during the first half of the day, which led to forming a false breakout and a signal to sell the euro. However, this did not lead to a large sale, as a result of which, the bulls took resistance at 1.1868 in the afternoon and formed a good entry point for long positions, however, a powerful upward moment did not occur, which resulted in extinguishing hopes for further growth. 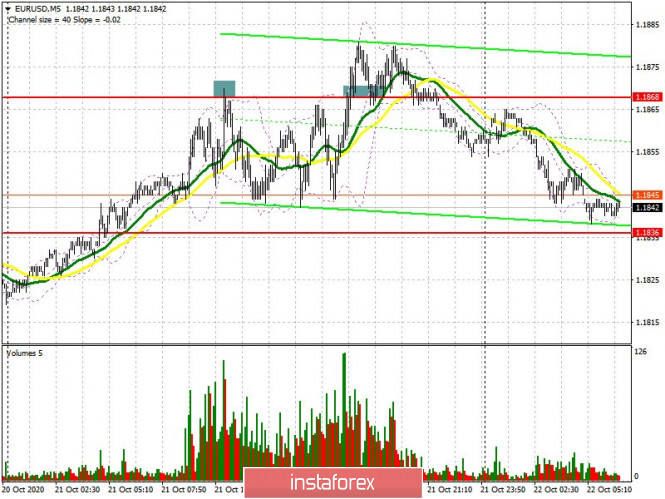 At the moment, the bulls need to think about how they can protect support at 1.1836. Forming a false breakout at this level in the first half of the day will be a signal to open long positions in euros during the weekly bullish trend. The primary goal is to return to resistance at 1.1875. Forming a breakout on this range and settling on it, similar to yesterday, will serve as a new signal for you to open long positions in order to test the highs of 1.1915 and 1.1964, where I recommend taking profits. In case bulls are not active at 1.1836 in the first half of the day, and since we do not have important fundamental reports today, we can expect a downward correction in EUR/USD, down to the area of a large support at 1.1802, where you can consider buy positions on the euro. I recommend opening long positions immediately on a rebound, but only from a low of 1.1765, counting on a correction of 15-20 points within the day. The Commitment of Traders (COT) report for October 13 showed a decrease in long positions and an increase in short ones, which led to an even greater decline in the delta. Despite this, buyers of risky assets believe that the bull market will continue, but they prefer to act with caution, as there is no good news for the eurozone yet. Thus, long non-commercial positions decreased from 231,369 to 228,295, while short non-commercial positions increased from 57,061 to 59,658. The total non-commercial net position decreased to 168,637, against 174,308 a week earlier. which indicates a wait-and-see attitude from new players, however, bullish sentiments for the euro remain rather high in the medium term. The more the euro will decline against the US dollar at the end of this year, the more attractive it will be for new investors. To open short positions on EUR/USD, you need: In order for sellers to be able to take control of the market and continue the downward correction, it is necessary to settle below support at 1.1836, testing it on the reverse side forms a good signal to sell the euro, in hopes to update of the low of 1.1802, where I recommend taking profit. The next target is support at 1.1765. If EUR/USD increases in the first half of the day, then it is best not to rush to sell, but to wait until a false breakout forms in the resistance area of 1.1875. You can open short positions immediately on a rebound from the high of 1.1915, counting on a correction of 15-20 points within the day. 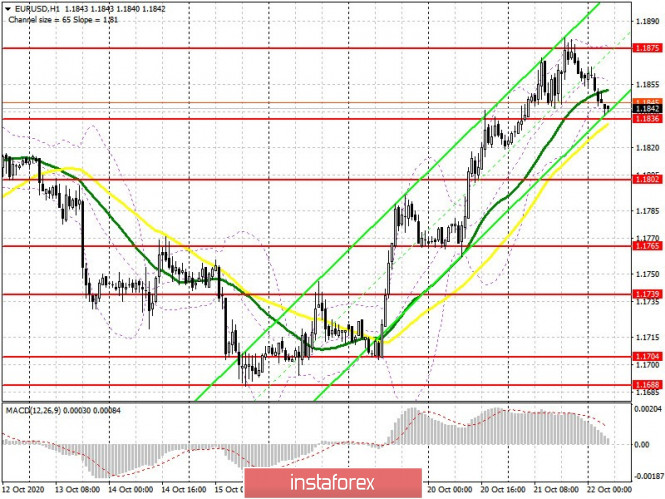 Indicator signals: Moving averages Trading is carried out in the area of 30 and 50 moving averages, which indicates uncertainty regarding the direction and that the bullish momentum is fading. Note: The period and prices of moving averages are considered by the author on the H1 hourly chart and differs from the general definition of classic daily moving averages on the D1 daily chart. Bollinger Bands A breakout of the upper border of the indicator in the 1.1875 area will lead to an increase in EUR/USD. A breakout of the lower border of the indicator in the 1.1836 area will increase pressure on the pair. Description of indicators - Moving average (moving average, determines the current trend by smoothing out volatility and noise). Period 50. It is marked in yellow on the chart.
- Moving average (moving average, determines the current trend by smoothing out volatility and noise). Period 30. It is marked in green on the chart.
- MACD indicator (Moving Average Convergence/Divergence — convergence/divergence of moving averages) Quick EMA period 12. Slow EMA period to 26. SMA period 9
- Bollinger Bands (Bollinger Bands). Period 20
- Non-commercial speculative traders, such as individual traders, hedge funds, and large institutions that use the futures market for speculative purposes and meet certain requirements.
- Long non-commercial positions represent the total long open position of non-commercial traders.
- Short non-commercial positions represent the total short open position of non-commercial traders.
- Total non-commercial net position is the difference between short and long positions of non-commercial traders.
Trading plan for the EUR/USD pair on October 22. Continued rise of COVID-19 cases and growth of the European currency. 2020-10-22 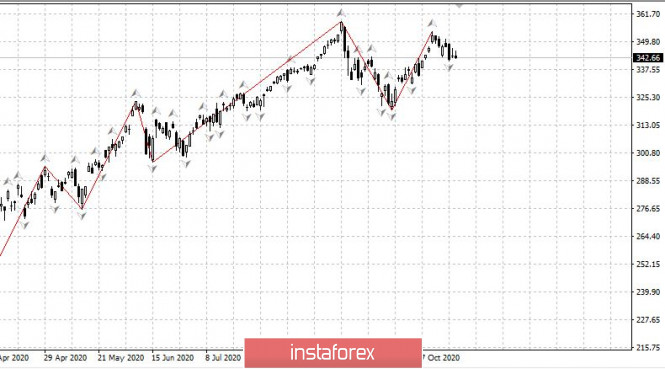
There is a lull in the US market, which suggests that growth has a low chance of occurring any time soon. Instead, look forward to price rebounds and then sell, as such will happen before and after the US presidential elections. 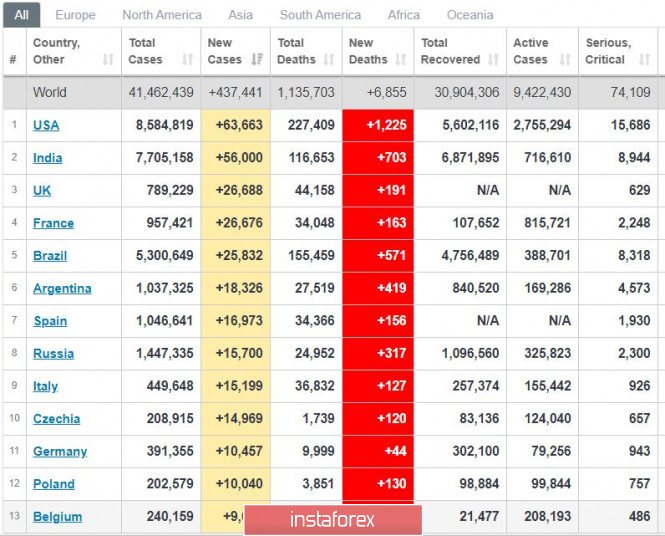
As of the moment, the total figure of COVID-19 cases around the world is 437 thousand. Europe continues to observe record high incidence rates, so now, the UK and France have more than 26 thousand new patients a day. Spain, Italy and the Czech Republic, meanwhile, have recorded more or less 16 thousand. 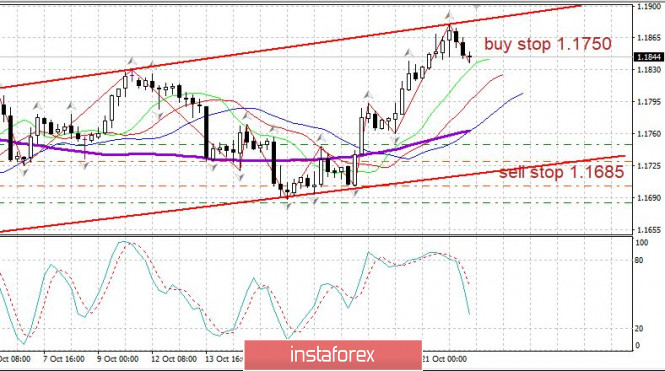
EUR / USD - growth continues in the European currency. Thus, long positions may be opened from 1.1840, while stop loss may be placed at 1.1790. GBP/USD: plan for the European session on October 22. COT reports. UK ready to make concessions on the Brexit trade deal. Pound climbs to new highs 2020-10-22 To open long positions on GBP/USD, you need: The news that the UK wants to resume negotiations and is ready to make concessions in the trade deal has supported the British pound and caused it to sharply grow yesterday afternoon. Let's take a look at the 5-minute chart and talk about where you can and should buy and sell the pound. In my review for the afternoon, I paid attention to resistance at 1.3080 and to buy above this level. The chart shows how the bulls are trying to break out and settle in this range, which forms a good entry point into long positions, and also brings around 70 points of profit. Selling on the rebound from 1.3154 (which I also recommended to do) was not good, but the bears also managed to wait for their correction. 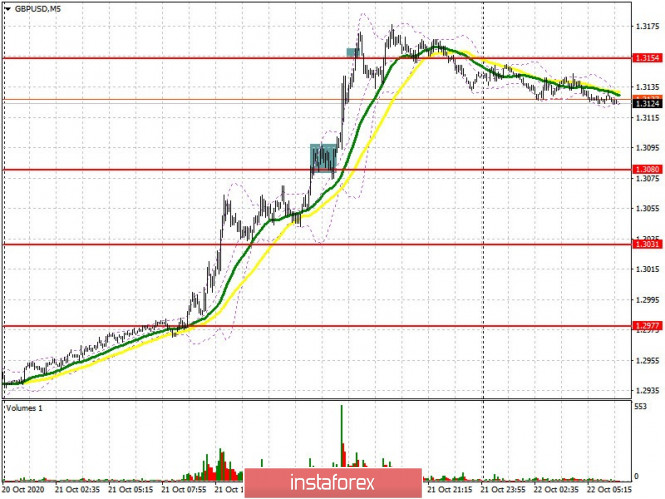 I have revised the nearest levels. The main task of the bulls during the first half of the day is to form a breakout and to settle above resistance of 1.3144, similar to yesterday's purchase, which I analyzed a little higher. This forms a good signal to open long positions as the pound continues to rise to 1.3192. The next target will be resistance at 1.3234, where I recommend taking profits. However, do not rush to buy the pound and add long positions from the high of 1.3192, since divergence is forming on the MACD indicator, this could limit the upward potential of the pair. The bull market will only be able to progress further if we receive more specific news about what kind of concessions the UK is ready to make. A more optimal scenario for opening long positions will be a downward correction from the GBP/USD pair to the support area of 1.3096, which is where moving averages will meet, playing on the side of buyers. However, you can only buy the pound if a false breakout appears, afterwards the pair could rapidly rise to weekly highs. If it is not there, and in case bulls are not active at 1.3096, then I recommend postponing buy positions until a larger low of 1.3044 has been updated, where you can open long positions immediately on a rebound, counting on a correction of 30-40 points within the day. The Commitment of Traders (COT) reports for October 13 showed that both long and short non-commercial positions have decreased. Long non-commercial positions declined from 40,698 to 36,195. At the same time, short non-commercial positions significantly dropped from 51,996 to 45,997. As a result, the negative value of the non-commercial net position slightly increased to -9 802 , against -11,298 a week earlier, which indicates that sellers of the British pound retain control and also shows their slight advantage in the current situation. To open short positions on GBP/USD, you need: Pound sellers were clearly taken aback by such news from the UK government, which led to their abrupt withdrawal from the market. At the moment, bears can only hope to form a false breakout in the resistance area of 1.3144, which will be the first signal to open short positions in the pound. A more important task is to break and settle below support at 1.3096, which will raise the pressure on the pair and lead to removing the buyers' stop orders, causing the pair to fall to a low of 1.3044, where I recommend taking profits. In case the pound grows further, according to the newly formed trend and the breakdown of resistance at 1.3144, one can count on divergence, which is now being formed on the MACD indicator. However, it is better not to rush to sell, but to wait until weekly highs have been updated and to test the 1.3192 level, where you can open short positions immediately on a rebound, counting on a correction of 30-40 points within the day. If the pound does not rapidly fall from this level, then it is best to postpone short positions until a high of 1.3234 has been updated. 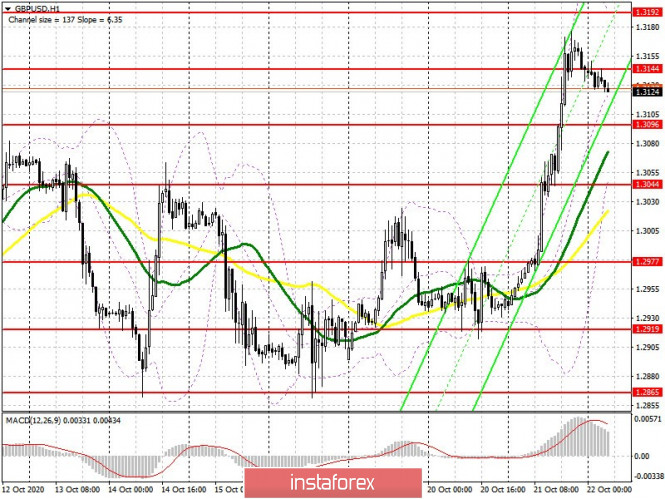 Indicator signals: Moving averages Trading is carried out above 30 and 50 moving averages, which indicates a resumption of the bull market. Note: The period and prices of moving averages are considered by the author on the H1 hourly chart and differs from the general definition of classic daily moving averages on the D1 daily chart. Bollinger Bands The pound's growth may be limited by the upper level of the indicator in the 1.3190 area. In case the pair falls, support will be provided by the lower border of the indicator at 1.3070. Description of indicators - Moving average (moving average, determines the current trend by smoothing out volatility and noise). Period 50. It is marked in yellow on the chart.
- Moving average (moving average, determines the current trend by smoothing out volatility and noise). Period 30. It is marked in green on the chart.
- MACD indicator (Moving Average Convergence/Divergence — convergence/divergence of moving averages) Quick EMA period 12. Slow EMA period to 26. SMA period 9
- Bollinger Bands (Bollinger Bands). Period 20
- Non-commercial speculative traders, such as individual traders, hedge funds, and large institutions that use the futures market for speculative purposes and meet certain requirements.
- Long non-commercial positions represent the total long open position of non-commercial traders.
- Short non-commercial positions represent the total short open position of non-commercial traders.
- Total non-commercial net position is the difference between short and long positions of non-commercial traders.
Indicator analysis. Daily review on EUR/USD for October 22, 2020 2020-10-22 Trend analysis (Fig. 1). Today, the market from the level 1.1862 (closing of yesterday's daily candle) may begin moving down with the goal of 1.1819, which is a pullback level of 23.6% (blue dotted line). When testing this level, further work down with the goal of 1.1780, which is a pullback level of 38.2% (blue dotted line). 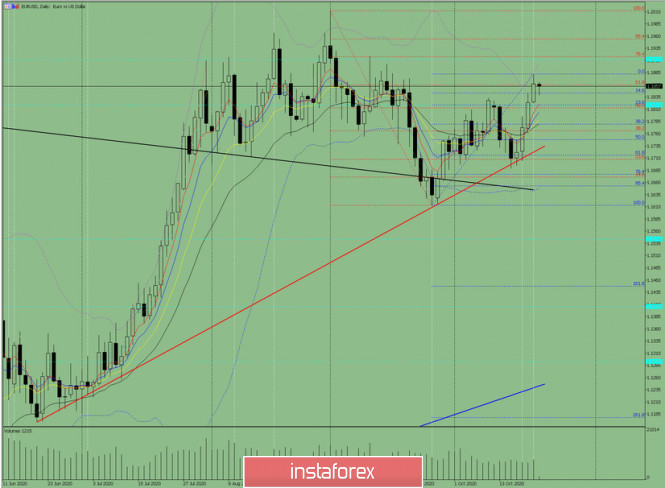
Figure 1 (Daily chart). Complex analysis: - Indicator analysis - down
- Fibonacci levels - down
- Volumes - down
- Technical analysis - down
- Trend analysis - down
- Bollinger Bands - down
- Weekly chart - down
General conclusion: Today, the market may start moving down from the level of 1.1862 (closing of yesterday's daily candle) with the target of 1.1819, which is a pullback level of 23.6% (blue dotted line). When testing this level, further work downward with the goal of 1.1780, which is a pullback level of 38.2% (blue dotted line). Alternative scenario: from the level of 1.1862 (closing of yesterday's daily candle), the price may continue to move down with the target of 1.18144, which is a pullback level of 14.6% (blue dotted line). When testing this level, further work up with the goal of 1.1882 - the upper fractal (blue dotted line). Brief trading recommendations for EUR/USD on 10/22/20 2020-10-22 
The EUR/USD pair managed to hold the previously set upward movement yesterday. As a result, the quote reached the forecasted area of 1.1870/1.1900, where there was a slowdown followed by a pullback. The previously known price area of 1.1870/1.1900, which reflects the time period of September 10-18, played the role in the interaction of trading forces in the market. During this period, there is a systematic decline in trading volumes, which leads to a stop and a pullback. In this case, the natural basis worked and we saw a pullback. At the same time, the sell positions were supported by the so-called overbought background of the European currency, where there was an increased desire on the sellers' part to close the buy position due to the rapid growth in the period of October 19-21. Regarding the current location of the quote, you can see that market participants continue to be in the pullback stage from the local high of 1.1880, where they have already managed to decline by more than 40 points. Based on the quote's location, we can consider trading forecasts from several possible market scenarios. First scenario: Completing the pullback followed by updating the local high The previously passed local high (1.1830) on September 9, where a slowdown and a reversal occurs, is used as a pivot point in the current pullback. If the current local high of 1.1880 will be updated, it is very possible that it will lead us to 1.1910. Second scenario: The pullback being replaced by stagnation The market continues to be in the pullback stage, where fluctuation boundaries gradually appear and everything comes down to a sideways movement, which market participants regarded as a cumulative process. 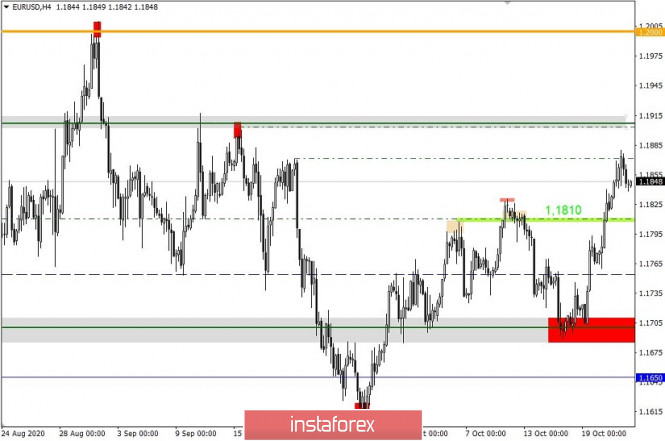
Indicator Analysis. Daily Review for GBP/USD 10/22/20 2020-10-22 Trend analysis (Fig. 1). Today, the market may roll back down from the level of 1.3148 (closing of yesterday's daily candle) with the target of 1.3104 - the retracement level of 14.6% (red dotted line). Upon reaching this level, the continuation of work downward with the target of 1.3058 - the retracement level of 23.6% (red dotted line). 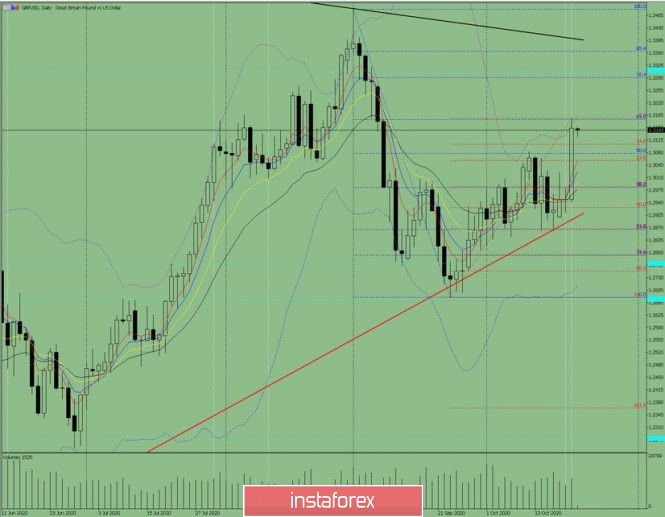 Figure: 1 (daily chart). Comprehensive Analysis: - Indicator Analysis - down
- Fibonacci Levels - down
- Volumes - down
- Candlestick Analysis - down
- Trend Analysis - up
- Bollinger Lines - down
- Weekly Chart - down
General conclusion: Today the price will try to move down with the target of 1.3104 - the retracement level of 14.6% (red dotted line). Upon reaching this level, the continuation of work downward with the target of 1.3058 - the retracement level of 23.6% (red dotted line). Alternative scenario: the market will try to move down from the level of 1.3148 (closing of yesterday's daily candle) with the target at 1.3104 - the retracement level of 14.6% (red dotted line) and go up from this level with the target at 1.3177 upper fractal (red dotted line). Trading plan for EUR/USD and GBP/USD on 10/22/2020 2020-10-22 Great Britain appeared to be some type of a hard-to-get girl, so the European Union had to make unimaginable lengths just to get her to agree to a date. Here, imagine that Brussels was forced to guarantee London its economic sovereignty. It was only after this that the UK confirmed its agreement to resume negotiations. In general, it looked as if this ill-fated trade agreement was needed not by London, but by Brussels. But despite the absurdity of what is happening, the pound increased very well together with the euro, which is possibly under the impression that the EU pretends to be ready to make some concessions. This is as if earlier, Brussels completely refused to recognize the UK as an independent state, and then suddenly took it back and recognized it. In general, it is likely that the issue may move forward. But if both parties do not make a statement, then there will clearly be no progress. Now, we should wait for a new round of negotiations which is expected next week. 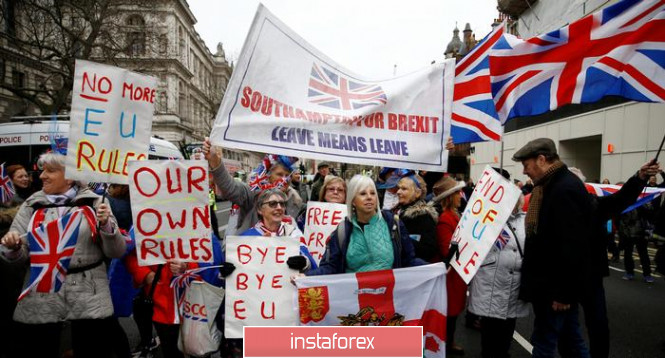
It is noteworthy that as the market closely monitors what is happening between the EU and the UK, it did not notice at all the inflation of the country. But the difference is not much, as the growth rate of consumer price rose from 0.2% to 0.5%. Nevertheless, we should expect the pound to grow, although we are still uncertain what would happen to the euro. Inflation (UK): 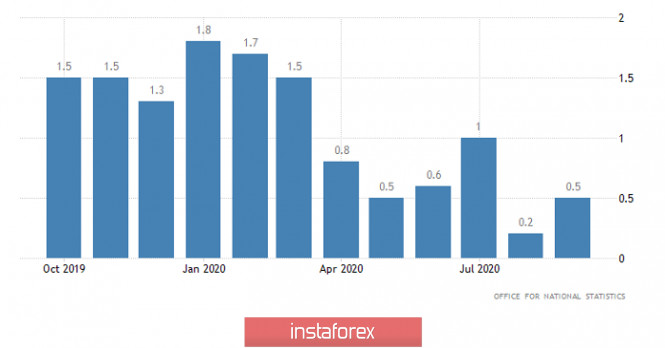
In any case, it is very clear that as this week started, both the pound and euro have sharply risen, which means they are noticeably overbought. At the same time, we don't expect serious information on this issue until the negotiations resume. Thus, this is a great time for local correction. But what will be the reason? This may be due to data on applications for unemployment benefits in the US. In fact, the number of initial applications should increase from 898 thousand to 915 thousand, while repeated applications are much more important. The number of which may decline from 10,018 thousand to 9,750 thousand. In total, the number of applications should decrease by 251 thousand. However, the most important thing is that the number of re-applications for the first time since the pandemic began should decline below 10,000 thousand. Repetitive Unemployment Insurance Claims (United States): 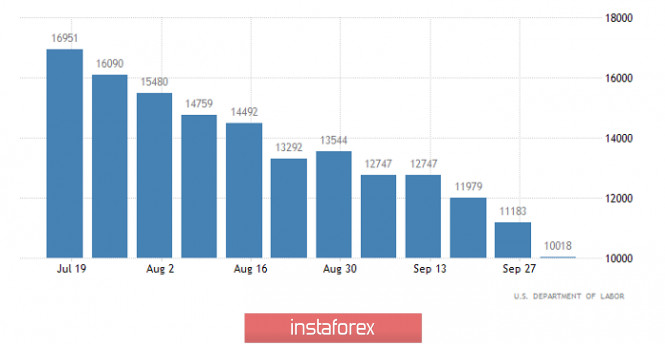
The GBP/USD pair showed high activity. As a result, the quote rushed to the level of 1.3175, where there was a slight stagnation. We can assume that if the price does not clearly consolidate above 1.3180 in the H4 TF, the market will experience a technical correction in the direction of 1.3080. 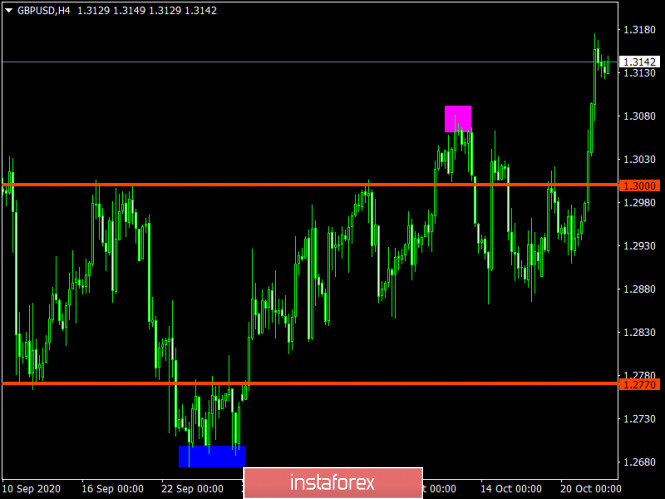
The EUR/USD pair showed an upward interest, which led to an update of the local high and focus within the values of 1.1835/1.1880. We can assume a temporary fluctuation in the values of 1.1835/1.1880, where, depending on the price consolidating points, the next movement in the market will be clear. 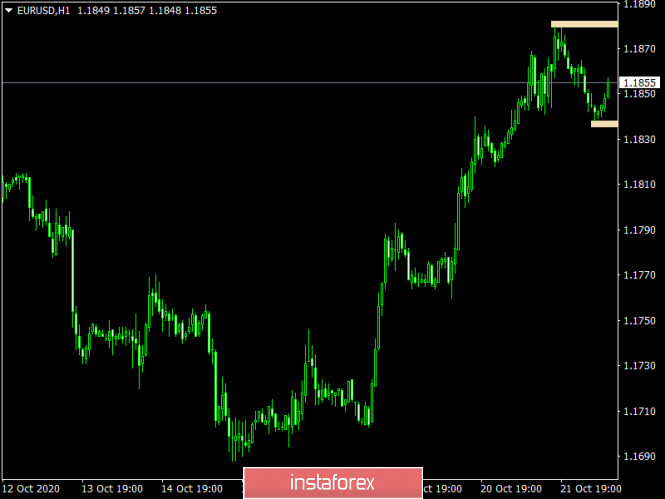
GBP/USD: The pound rose sharply amid news that the UK is ready to make concessions with the EU regarding a post-Brexit trade agreement. Meanwhile, the Canadian dollar has lost its bullish momentum. 2020-10-22 The British pound jumped sharply against the US dollar yesterday, after news came out that the UK is ready to resume negotiations with the EU regarding a post-Brexit trade agreement. Expectations that the parties could compromise at the very last moment have increased significantly, which has led to a sharp rise of demand for the British pound. Of course, many also expect the European Union to be ready to make concessions as well, but until such is done or intentions of it are expressed, the speculative growth of the pound will be limited. 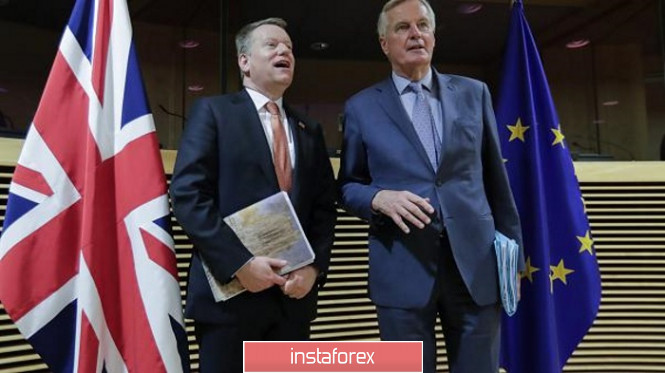 The main problems that both parties need to resolve are the dispute over Ireland's borders and the issue on fishing. The UK wants to preserve sovereignty over a number of fishing zones, while the EU, on the other hand, wants to retain their rights to fish in these areas. Chief negotiator for the UK, David Frost, said yesterday that he is ready to re-start negotiations with Michel Barnier, the chief negotiator for the EU. He hinted that the UK is ready to make some concessions, however, it has limits. Frost said that the principles for intensifying their dialogues have already been agreed, while noting that the UK wants to see the EU's desire to reach an agreement. The negotiations will resume next week in London. Against this background, the pound practically reached the 32nd figure, emerging a rather strong upward potential. Everything depends now on the reaction of the EU and on their willingness to conclude a trade agreement. But since it is also not completely clear what concessions the UK is ready to make, over-optimism is very dangerous. In the event that the UK does not offer anything particularly new, reaching a consensus in the negotiations may slow down again, which will negatively affect the British pound. So, in that regard, further growth in the GBP / USD pair will be initiated by the breakdown of the resistance level of 1.3150, because if the bulls manage to push the pair even higher, price will most likely reach above 1.3200. However, the quote will turn down if the pair drops below 1.3100, as such will lead to a strong downward move towards 1.3040 and 1.2970. USD / CAD The Canadian dollar lost its bullish momentum yesterday, after the publication of weak economic statistics. A report yesterday indicated that Canada's CPI declined in September this year, which is not a good sign for its economy. In addition, although the annual inflation rate accelerated in September, it is more due to weak price pressures last year, than due to a serious increase in the indicator this year. 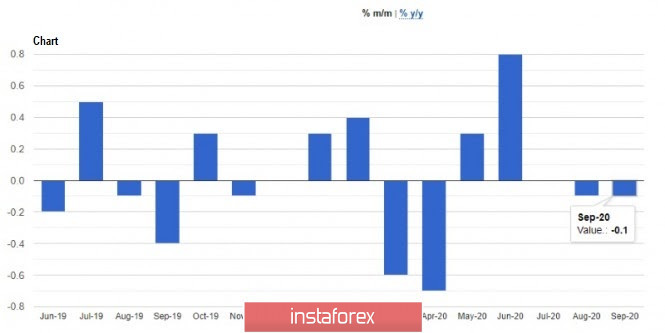 Canada's CPI rose 0.5% if compared to the same period last year, but decreased by 0.1% if compared to the earlier month. Economists had expected the index to grow by 0.5%. Such a scenario suggests that the Bank of Canada will most likely keep its interest rates unchanged for a long time, in order to sustain the country's economy. Meanwhile, a good growth was observed in Canada's retail sales. However, given the fact that the data are published with a significant delay, the rise in the index did not have a serious impact on the market. Nonetheless, the report said that retail sales rose 0.4% from the previous month, amounting to C $ 53.19 million. The data for July was also revised to + 1.0%, while the previously reported growth was only 0.6%. 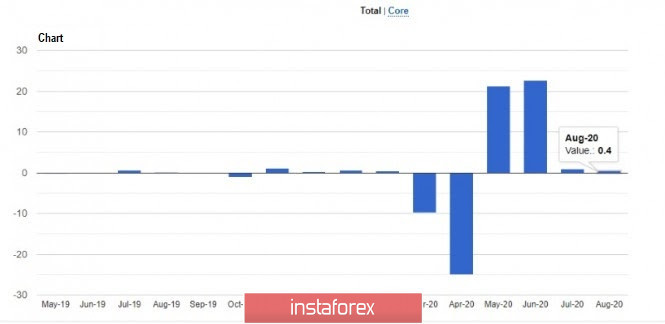 As for the USD/CAD pair, the downward move is limited by the support level of 1.3100, which the bulls have defended several times. Only its breakout will lead to a further decline towards the lows 1.3050 and 1.2990. Meanwhile, a consolidation above the level of 1.3200 will lead to a price increase towards the highs 1.3260 and 1.3340. New horizons of gold: the road to $10,000 per ounce 2020-10-22  Short-term and long-term forecasts for gold have always been optimistic. The market's confidence in the precious yellow metal exceeds that of the greenback. In the run-up to the US presidential election, the attitude of investors to gold is becoming more and more trepid. Regardless of the election's outcome, analysts say that there is a possibility for the "solar" metal to rise in price in the near future. Recall that both US presidential candidates, Donald Trump and Joe Biden, plan to introduce new fiscal stimulus measures. Should either of them win, the Fed will turn on the printing press again, "flooding" the national economy with unsecured dollars. In consequence, the greenback will be greatly devalued and gold will significantly rise in price. Last night, October 21, the yellow metal added 1%, reaching a weekly peak of $1,930 per ounce. Later, the precious metal was trading near the $1,925 mark, and the catalyst for this growth was the optimism of investors about the possible adoption of the next package of financial assistance in the United States. Due to this, the US currency was put under pressure. The "sunny" metal took advantage of the situation and rose on the crest of a wave of investor interest. Today, October 22, gold fell by almost half. Now, the yellow metal is trading near $1,918 per ounce, but it is still trying to return to yesterday's records. 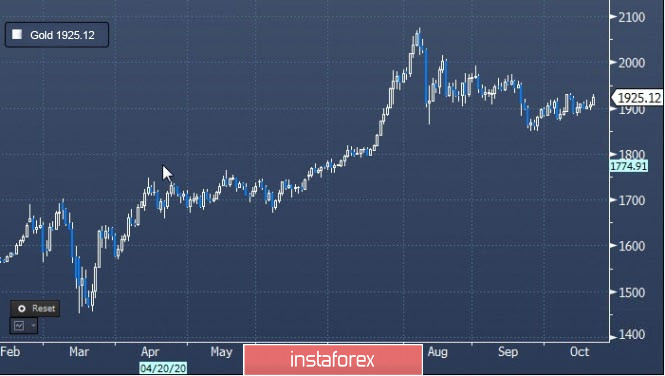 Many traders treat gold as an inflation hedging tool. Historically, the yellow metal is considered a means of protection against inflationary fluctuations, currency depreciation, and insurance in case of a prolonged period of uncertainty in the market. According to experts, the main precious metal rose in price by more than 26% against the background of unprecedented global stimulus measures this year. At the same time, experts admit that in 2021, the price of gold is unlikely to exceed $2000 per ounce, although they do not exclude the successful conquest of new peaks by the precious metal. The most important factor contributing to the growth of the "solar" metal may be the global pension funds. They practically do not own gold, but they can become the trump card in the sleeve that will raise Gold to a dizzying height. Some of them did not receive funding before the COVID-19 pandemic. If pension funds start investing at least 1% of their capital in gold, its price will soar to $10,000 per ounce in a short time, says the President of BMG Group Nick Barysheff. The expert believes that the reason for this is a limited amount of investment to the precious metal, large purchases of which can provoke an unprecedented price turn and consolidate the upward trend. The seasonal factor can provide invaluable assistance to gold. Surprisingly, on the side of the precious metals market – namely autumn, the price will increase. Based on long-term observations, this is a powerful seasonal driver of the rise of "gold" quotes. Investors can look forward to an impressive profit caused by the fall growth of the yellow metal. An additional impetus for the price of gold will be the upcoming US presidential elections. Technical analysis of EUR/USD for October 21, 2020 2020-10-22 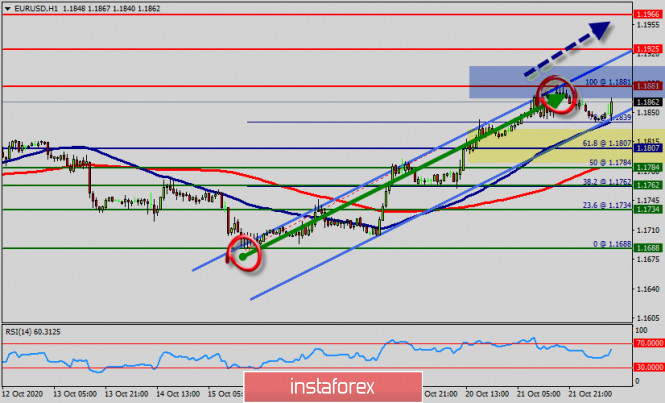 Overview : The EUR/USD pair climbed from 1.1807 to 1.1881 and closed at the price of 1.1884. Today we note that the market is still trading below the level of 1.1881. Please, note that the resistance stands at the levels of 1.1881 and 1.1925 in the daily time frame. In the longer term, the strong resistance at 1.1996, continues to represent a major hurdle. Therefore, right now the first ascending impulse is forming the first one; the market is being corrected from the area of 1.1807. Hence, the EUR/USD pair faced resistance at the level of 1.1925, while minor resistance is seen at 1.1881. Support is found at the levels of 1.1807 and 1.1784. Pivot point has already set at the level of 1.1807. Equally important, the EUR/USD pair is still moving around the key level at 1.1807, which represents a daily pivot in the H1 time frame at the moment. Yesterday, the EUR/USD pair continued to move upwards from the level of 1.1807. The pair will rise to the top around 1.1881 from the level of 1.1807 (coincides with the ratio of 61.8% Fibonacci retracement). In consequence, the EUR/USD pair broke resistance, which turned into strong support at the level of 1.1807. The level of 1.1807 is expected to act as the major support today. We expect the EUR/USD pair to keep to trade in the bullish trend towards the target levels of 1.1925 and 1.1966. On the downtrend : On the other hand, if a breakout happens at the support level of 1.1807 , then this scenario may be invalidated. If the pair fails to pass through the level of 1.1807, the market will indicate a bearish opportunity below the level of 1.1807. So, the market will decline further to 1.1784 and 1.1762 to return to the daily support. Moreover, a breakout of that target will move the pair further downwards to 1.1688 in order to form the double bottom. Conclusion The depicted resistance level of 1.1807 acted as an important key level offering a valid buy entry. So, buy above the 1.1807 level with the targets of 1.1881, 1.1925, and 1.1966 today. Conversely, stop loss should be placed below the high reached near the first support (1.1762). Trading idea for gold 2020-10-22  Gold went through a bullish momentum yesterday, mainly due to the depreciation of the US dollar amid news that the US may get another stimulus package worth $ 2 trillion. Now, gold has a chance to increase up to 1932, and this can be done by opening long positions in the market. 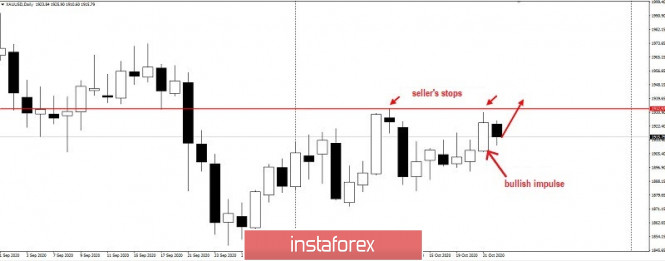 In fact, the quotes have already formed an ABC pattern on the daily chart, in which "A" is the bullish impulse recorded yesterday. So, from the current prices, long positions may be set up to 1932. However, it would be inadvisable if the quote moves down 1905. The risk/reward ratio of such a transaction is 1.5 to 1. Good luck! Technical recommendations for EUR/USD and GBP/USD on October 22 2020-10-22 EUR / USD 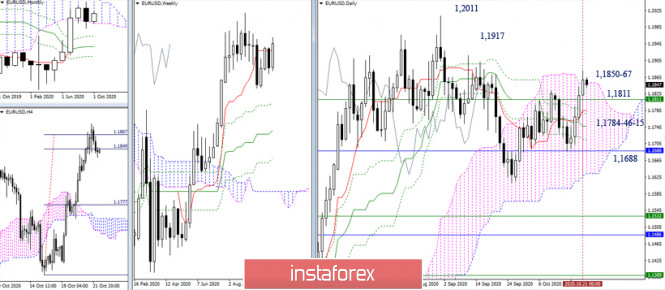 The bulls tested the upper limits of the current upward pivot points 1.1850-67 (target for the breakdown of the H4 cloud + daily cloud), which indicated a slowdown. A reliable consolidation in the bullish zone relative to the daily cloud will allow us to consider the bulls' further strengthening. In this case, the goal will be to update the weekly upward trend (1.2011), then attention will be directed to the continuation of the rise to the upper limit of the monthly cloud (1.2167). The closest support is still the weekly short-term trend passed the day before (1.1811), then the support of the daily Ichimoku cross may have a value 1.1784-46-15. 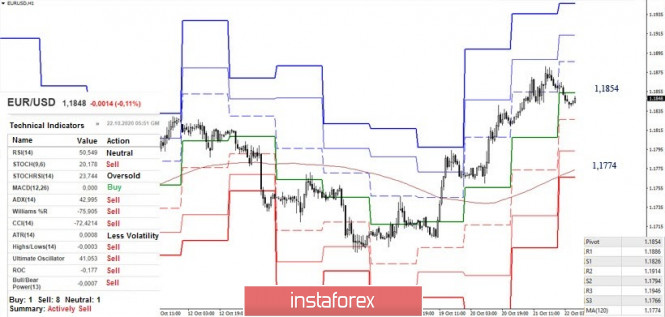 The smaller time frames currently prefer the development of a downward correction. The bears captured the central pivot level (1.1854) and secured the support of the analyzed technical indicators. Today, the scale of a possible corrective movement is significant. The final important pivot point is now at 1.1774 (weekly long-term trend), with the nearest support levels at 1.1826 (S1) and 1.1794 (S2). To cancel such bearish plans, the upward trend (1.1881 maximum extreme) should be updated. The resistances of the classic pivot levels are located today at 1.1886 - 1.1914 - 1.1946. GBP / USD 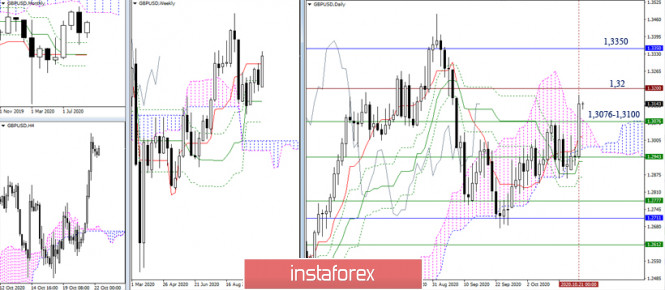 The bullies managed to leave the zone of uncertainty and attraction (1.2943-60-70), which held back the development of the situation for a long time. Now, the nearest upward targets are 1.32 (historical benchmark) and 1.3350 (lower limit of the monthly cloud). The levels 1.3076 - 1.3100 (weekly Tenkan + daily cloud), passed the day before form support. It is important for the bulls to hold above these levels. 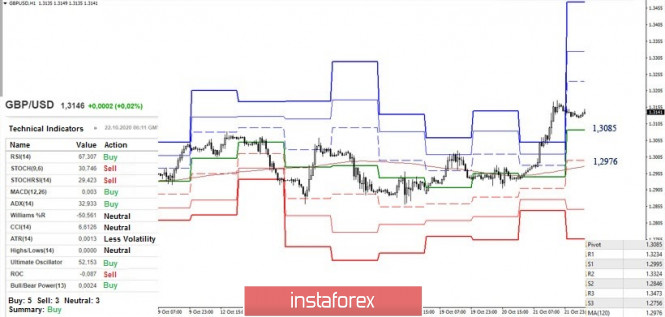 The scale of yesterday's movement pushed the limits of today's classic pivot levels. As a result, the resistance of the classic pivot levels will meet the bulls by 1.3234 - 1.3324 - 1.3473, given that the growth continues (1.3176 high). Meanwhile, with the development of a downward correction, the key support levels responsible for maintaining the balance of power are currently located at 1.3085 (central pivot level) and 1.2976 (weekly long-term trend). Ichimoku Kinko Hyo (9.26.52), Pivot Points (classical), Moving Average (120) Technical analysis of AUD/USD for October 21, 2020 2020-10-22 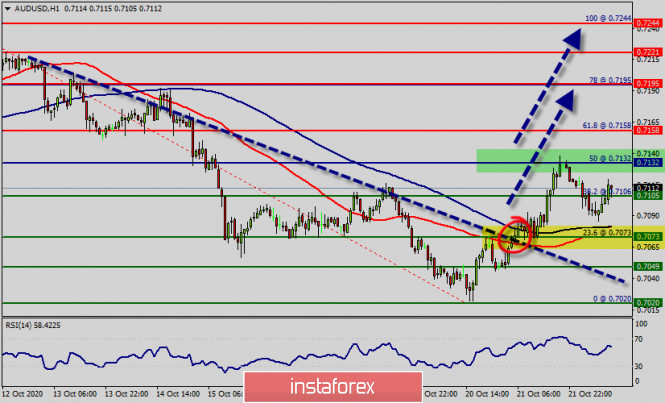 Overview : The AUD/USD pair broke resistance, which turned into strong support at 0.7073. Right now, the pair is trading above this level (0.7073). It is likely to trade in a higher range as long as it remains above the support (0.7073), which is expected to act as a major support today. Therefore, there is a possibility that the AUD/USD pair will move upwards and the structure does not look corrective. The trend is still below the 100 EMA for that the bullish outlook remains the same as long as the 100 EMA is headed to the upside. We expect to see a strong reaction off this level to push price up towards 0.7132 before 0.7073 support (Fibonacci retracement, horizontal swing high support). RSI (14) sees major ascending resistance line acting as support to push price up from the zone of 0.7073. From this point of view, the first resistance level is seen at 0.7132 followed by 0.7195, while daily support 1 is seen at 0.7073 (23.6% Fibonacci retracement). According to the previous events, the AUD/USD pair is still moving between the levels of 0.7100 and 0.7195; so we expect a range of 95 pips at least in coming hours. Consequently, buy above the level of 0.7100 with the first target at 0.7158 so as to test the daily resistance 1 and further to 0.7195. Besides, the level of 0.7195 is a good place to take profit because it will form a double top. On the contrary, in case a reversal takes place and the AUD/USD pair breaks through the support level of 0.7023, a further decline to 0.7020 can occur, which would indicate a bearish market. Overall, we still prefer the bullish scenario, which suggests that the pair will stay below the zone of 0.7023 today. Forecast : According to the previous events the price is expected to remain between 0.7073 and 0.7195 levels. Buy-deals are recommended above 0.7073 with the first target seen at 0.7132. The movement is likely to resume to the point 0.7158 and further to the point 0.7195. However, if a breakout happens at 0.7049, this scenario may be invalidated. Brief trading recommendations for GBP/USD on 10/22/20 2020-10-22 
Very high activity was recorded in the GBP / USD pair yesterday, which resulted in a strong upward movement, past the local high of October 12 (1.3080). The quote moved up by more than 239 pips, which is a rare occurrence in the market. What was the reason for such an impressive price change? The main factor was the news regarding Brexit, when the UK and the EU officially agreed to resume negotiations over a trade agreement. (Recall that last week, UK Prime Minister Boris Johnson suspended negotiations, which signaled a "hard Brexit" - Britain's exit from the EU without a trade deal). This resumption of negotiations increased the chance of seeing a positive outcome, which raised speculative activity, on which long positions were opened in the market. Meanwhile, from the point of view of technical analysis, the breakdown of the local high (1.3080) became a leverage for buying the pound, which triggered many orders and, as a result, a strong upward movement. With regards to the current location of the quote, a slight pullback has occurred from 1.3175, however, it looks more like a stagnation than a recovery in dollar positions. The clear overbought signal of the British pound could also lead in a decrease in long positions, which would result in a technical correction towards the level of 1.3080. Nonetheless, attention should be given on all news about Brexit, as any update related to the topic could provoke speculative leaps in the market, depending on the rhetoric and the outcome of the negotiations. Positive news will lead to an increase in the British pound, while negative news, that is, the lack of common ground in negotiations, will lead to a decline in the pound's value. So, based on the factors presented above, here are possible scenarios that could occur in the GBP / USD pair: First scenario: price correction A decrease in long positions will lead in a technical correction towards the price level 1.3080. Second scenario: Speculative activity amid news on Brexit will lead to the breakdown of local high 1.3175, which will result in a further upward move towards 1.3250. 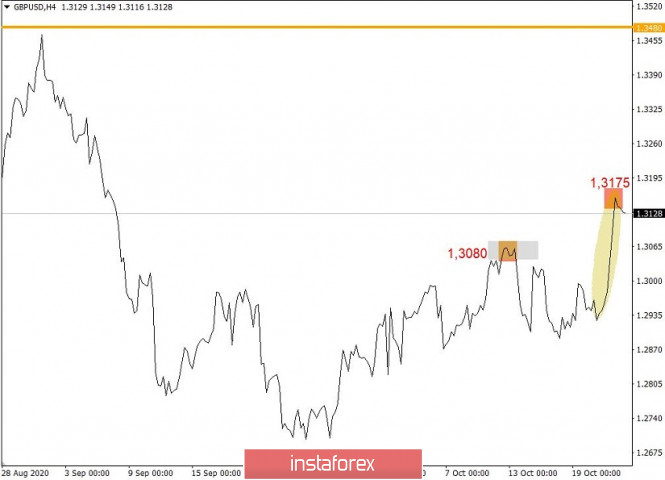
Author's today's articles: Torben Melsted  Born in November 1962. Graduated from CBS, got Diploma in Finance. Began trading on Forex in 1986 and since that time held various positions such as advising clients, hedging client flows on FX and commodity markets. Also worked for major corporations as Financial Risk Manager. Uses Elliott wave analysis in combination with classic technical analysis, and has been using a Calmar Ratio of 5.0 for over 3 years. Has his own blog, where he uses Elliott wave and technical analysis on all financial markets. Born in November 1962. Graduated from CBS, got Diploma in Finance. Began trading on Forex in 1986 and since that time held various positions such as advising clients, hedging client flows on FX and commodity markets. Also worked for major corporations as Financial Risk Manager. Uses Elliott wave analysis in combination with classic technical analysis, and has been using a Calmar Ratio of 5.0 for over 3 years. Has his own blog, where he uses Elliott wave and technical analysis on all financial markets. Sebastian Seliga  Sebastian Seliga was born on 13th Oсtober 1978 in Poland. He graduated in 2005 with MA in Social Psychology. He has worked for leading financial companies in Poland where he actively traded on NYSE, AMEX and NASDAQ exchanges. Sebastian started Forex trading in 2009 and mastered Elliott Wave Principle approach to the markets by developing and implementing his own trading strategies of Forex analysis. Since 2012, he has been writing analitical reviews based on EWP for blogs and for Forex websites and forums. He has developed several on-line projects devoted to Forex trading and investments. He is interested in slow cooking, stand-up comedy, guitar playing, reading and swimming. "Every battle is won before it is ever fought", Sun Tzu Sebastian Seliga was born on 13th Oсtober 1978 in Poland. He graduated in 2005 with MA in Social Psychology. He has worked for leading financial companies in Poland where he actively traded on NYSE, AMEX and NASDAQ exchanges. Sebastian started Forex trading in 2009 and mastered Elliott Wave Principle approach to the markets by developing and implementing his own trading strategies of Forex analysis. Since 2012, he has been writing analitical reviews based on EWP for blogs and for Forex websites and forums. He has developed several on-line projects devoted to Forex trading and investments. He is interested in slow cooking, stand-up comedy, guitar playing, reading and swimming. "Every battle is won before it is ever fought", Sun Tzu Stanislav Polyanskiy  Graduated from Odessa State Economic University. On Forex since 2006. Writes analytical reviews about international financial markets for more than 3 years. Worked as a currency analyst in different finance companies for a long time including the biggest companies of Russia and Ukraine. Graduated from Odessa State Economic University. On Forex since 2006. Writes analytical reviews about international financial markets for more than 3 years. Worked as a currency analyst in different finance companies for a long time including the biggest companies of Russia and Ukraine. Maxim Magdalinin  In 2005 graduated from the Academy of the Ministry of Internal Affairs of the Republic of Belarus, law faculty. Worked as a lawyer for three years in one of the biggest country's company. Besides the trading, he develops trading systems, writes articles and analytical reviews. Works at stock and commodity markets explorations. On Forex since 2006. In 2005 graduated from the Academy of the Ministry of Internal Affairs of the Republic of Belarus, law faculty. Worked as a lawyer for three years in one of the biggest country's company. Besides the trading, he develops trading systems, writes articles and analytical reviews. Works at stock and commodity markets explorations. On Forex since 2006. Mihail Makarov  - - Sergey Belyaev  Born December 1, 1955. In 1993 graduated from Air Force Engineering Academy. In September 1999 started to study Forex markets. Since 2002 has been reading lectures on the technical analysis . Is fond of research work. Created a personal trading system based on the indicator analysis. Authored the book on technical analysis "Calculation of the next candlestick". At present the next book is being prepared for publishing "Indicator Analysis of Forex Market. Trading System Encyclopedia". Has created eleven courses on indicator analysis. Uses classical indicators. Works as a public lecturer. Held numerous seminars and workshops presented at international exhibitions of financial markets industry. Is known as one of the best specialists in the Russian Federation researching indicator analysis. Born December 1, 1955. In 1993 graduated from Air Force Engineering Academy. In September 1999 started to study Forex markets. Since 2002 has been reading lectures on the technical analysis . Is fond of research work. Created a personal trading system based on the indicator analysis. Authored the book on technical analysis "Calculation of the next candlestick". At present the next book is being prepared for publishing "Indicator Analysis of Forex Market. Trading System Encyclopedia". Has created eleven courses on indicator analysis. Uses classical indicators. Works as a public lecturer. Held numerous seminars and workshops presented at international exhibitions of financial markets industry. Is known as one of the best specialists in the Russian Federation researching indicator analysis. Vladislav Tukhmenev  Vladislav graduated from Moscow State University of Technologiy and Management. He entered the forex market in early 2008. Vladislav is a professional trader, analyst, and manager. He applies a whole gamut of analysis – technical, graphical, mathematical, fundamental, and candlestick analysis. Moreover, he forecasts the market movements using his own methods based on the chaos theory. Vladimir took part in development of trading systems devoted to fractal analysis. In his free time, Vladimir blogs about exchange markets. Hobbies: active leisure, sporting shooting, cars, design, and marketing. "I do not dream only of becoming the best in my field. I also dream about those who I will take with me along the way up." Vladislav graduated from Moscow State University of Technologiy and Management. He entered the forex market in early 2008. Vladislav is a professional trader, analyst, and manager. He applies a whole gamut of analysis – technical, graphical, mathematical, fundamental, and candlestick analysis. Moreover, he forecasts the market movements using his own methods based on the chaos theory. Vladimir took part in development of trading systems devoted to fractal analysis. In his free time, Vladimir blogs about exchange markets. Hobbies: active leisure, sporting shooting, cars, design, and marketing. "I do not dream only of becoming the best in my field. I also dream about those who I will take with me along the way up." Alexandr Davidov  No data No data Pavel Vlasov  No data No data l Kolesnikova  text text Mourad El Keddani  Was born in Oujda, Morocco. Currently lives in Belgium. In 2003 obtained B.S. in Experimental Sciences. In 2007 obtained a graduate diploma at Institut Marocain Specialise en Informatique Applique (IMSIA), specialty – Software Engineering Analyst. In 2007–2009 worked as teacher of computer services and trainer in a professional school specializing in computer technologies and accounting. In 2005 started Forex trading. Authored articles and analytical reviews on Forex market on Forex websites and forums. Since 2008 performs Forex market research, and develops and implements his own trading strategies of Forex analysis (especially in Forex Research & Analysis, Currency Forecast, and Recommendations and Analysis) that lies in: Numerical analysis: Probabilities, equations and techniques of applying Fibonacci levels. Classical analysis: Breakout strategy and trend indicators. Uses obtained skills to manage traders' accounts since 2009. In April 2009 was certified Financial Technician by the International Federation of Technical Analysts. Winner of several social work awards: Education Literacy and Non-Formal Education (in Literacy and Adult Education in The National Initiative for Human Development). Was born in Oujda, Morocco. Currently lives in Belgium. In 2003 obtained B.S. in Experimental Sciences. In 2007 obtained a graduate diploma at Institut Marocain Specialise en Informatique Applique (IMSIA), specialty – Software Engineering Analyst. In 2007–2009 worked as teacher of computer services and trainer in a professional school specializing in computer technologies and accounting. In 2005 started Forex trading. Authored articles and analytical reviews on Forex market on Forex websites and forums. Since 2008 performs Forex market research, and develops and implements his own trading strategies of Forex analysis (especially in Forex Research & Analysis, Currency Forecast, and Recommendations and Analysis) that lies in: Numerical analysis: Probabilities, equations and techniques of applying Fibonacci levels. Classical analysis: Breakout strategy and trend indicators. Uses obtained skills to manage traders' accounts since 2009. In April 2009 was certified Financial Technician by the International Federation of Technical Analysts. Winner of several social work awards: Education Literacy and Non-Formal Education (in Literacy and Adult Education in The National Initiative for Human Development).
Languages: Arabic, English, French and Dutch.
Interests: Algorithm, Graphics, Social work, Psychology and Philosophy. Andrey Shevchenko  Andrey Shevchenko Andrey Shevchenko Zhizhko Nadezhda  Graduated from Irkutsk State University. Having acquainted with Forex market in 2008, followed the courses in the International Academy of Stock Exchange Trading. The agenda was so exiting that she moved to St. Petersburg in order to get professional education. Obtained a diploma of the retraining course on the discipline Exchange market and stock market issues, defended the graduation paper with distinction on the subject "Modern technical indicators as the basis of the trading system". At the moment obtains a master degree in International Banking Institute on specialty Financial markets and investments. Apart from trading is occupied with development of trading systems and formalization of the working strategies using Ichimoku indicator. At the moment is working on the book dedicated to the peculiarities of Ichimoku indicator and its operating methods. Interests: yoga, literature, travelling and photograph. "You can only get smarter by playing a smarter opponent" Basics of Chess play, 1883 "Successful people change by themselves, the others are changed by life" Jim Rohn Graduated from Irkutsk State University. Having acquainted with Forex market in 2008, followed the courses in the International Academy of Stock Exchange Trading. The agenda was so exiting that she moved to St. Petersburg in order to get professional education. Obtained a diploma of the retraining course on the discipline Exchange market and stock market issues, defended the graduation paper with distinction on the subject "Modern technical indicators as the basis of the trading system". At the moment obtains a master degree in International Banking Institute on specialty Financial markets and investments. Apart from trading is occupied with development of trading systems and formalization of the working strategies using Ichimoku indicator. At the moment is working on the book dedicated to the peculiarities of Ichimoku indicator and its operating methods. Interests: yoga, literature, travelling and photograph. "You can only get smarter by playing a smarter opponent" Basics of Chess play, 1883 "Successful people change by themselves, the others are changed by life" Jim Rohn
Subscription's options management Theme's:
Fundamental analysis, Fractal analysis, Wave analysis, Technical analysis, Stock Markets
Author's :
A Zotova, Aleksey Almazov, Alexander Dneprovskiy, Alexandr Davidov, Alexandros Yfantis, Andrey Shevchenko, Arief Makmur, Dean Leo, Evgeny Klimov, Fedor Pavlov, Grigory Sokolov, I Belozerov, Igor Kovalyov, Irina Manzenko, Ivan Aleksandrov, l Kolesnikova, Maxim Magdalinin, Mihail Makarov, Mohamed Samy, Mourad El Keddani, Oleg Khmelevskiy, Oscar Ton, Pavel Vlasov, Petar Jacimovic, R Agafonov, S Doronina, Sebastian Seliga, Sergey Belyaev, Sergey Mityukov, Stanislav Polyanskiy, T Strelkova, Torben Melsted, V Isakov, Viktor Vasilevsky, Vladislav Tukhmenev, Vyacheslav Ognev, Yuriy Zaycev, Zhizhko Nadezhda
Edit data of subscription settings
Unsubscribe from the mailing list Sincerely,
Analysts Service | If you have any questions, you can make a phone call using one of the
InstaForex Toll free numbers right now:
|  |  InstaForex Group is an international brand providing online trading services to the clients all over the world. InstaForex Group members include regulated companies in Europe, Russia and British Virgin Islands. This letter may contain personal information for access to your InstaForex trading account, so for the purpose of safety it is recommended to delete this data from the history. If you have received this letter by mistake, please contact InstaForex Customer Relations Department. |


 Born in November 1962. Graduated from CBS, got Diploma in Finance. Began trading on Forex in 1986 and since that time held various positions such as advising clients, hedging client flows on FX and commodity markets. Also worked for major corporations as Financial Risk Manager. Uses Elliott wave analysis in combination with classic technical analysis, and has been using a Calmar Ratio of 5.0 for over 3 years. Has his own blog, where he uses Elliott wave and technical analysis on all financial markets.
  Sebastian Seliga was born on 13th Oсtober 1978 in Poland. He graduated in 2005 with MA in Social Psychology. He has worked for leading financial companies in Poland where he actively traded on NYSE, AMEX and NASDAQ exchanges. Sebastian started Forex trading in 2009 and mastered Elliott Wave Principle approach to the markets by developing and implementing his own trading strategies of Forex analysis. Since 2012, he has been writing analitical reviews based on EWP for blogs and for Forex websites and forums. He has developed several on-line projects devoted to Forex trading and investments. He is interested in slow cooking, stand-up comedy, guitar playing, reading and swimming. "Every battle is won before it is ever fought", Sun Tzu
  Graduated from Odessa State Economic University. On Forex since 2006. Writes analytical reviews about international financial markets for more than 3 years. Worked as a currency analyst in different finance companies for a long time including the biggest companies of Russia and Ukraine.
  In 2005 graduated from the Academy of the Ministry of Internal Affairs of the Republic of Belarus, law faculty. Worked as a lawyer for three years in one of the biggest country's company. Besides the trading, he develops trading systems, writes articles and analytical reviews. Works at stock and commodity markets explorations. On Forex since 2006.
  -
-  Born December 1, 1955. In 1993 graduated from Air Force Engineering Academy. In September 1999 started to study Forex markets. Since 2002 has been reading lectures on the technical analysis . Is fond of research work. Created a personal trading system based on the indicator analysis. Authored the book on technical analysis "Calculation of the next candlestick". At present the next book is being prepared for publishing "Indicator Analysis of Forex Market. Trading System Encyclopedia". Has created eleven courses on indicator analysis. Uses classical indicators. Works as a public lecturer. Held numerous seminars and workshops presented at international exhibitions of financial markets industry. Is known as one of the best specialists in the Russian Federation researching indicator analysis.
  Vladislav graduated from Moscow State University of Technologiy and Management. He entered the forex market in early 2008. Vladislav is a professional trader, analyst, and manager. He applies a whole gamut of analysis – technical, graphical, mathematical, fundamental, and candlestick analysis. Moreover, he forecasts the market movements using his own methods based on the chaos theory. Vladimir took part in development of trading systems devoted to fractal analysis. In his free time, Vladimir blogs about exchange markets. Hobbies: active leisure, sporting shooting, cars, design, and marketing. "I do not dream only of becoming the best in my field. I also dream about those who I will take with me along the way up."
  No data
  No data
  text
text  Was born in Oujda, Morocco. Currently lives in Belgium. In 2003 obtained B.S. in Experimental Sciences. In 2007 obtained a graduate diploma at Institut Marocain Specialise en Informatique Applique (IMSIA), specialty – Software Engineering Analyst. In 2007–2009 worked as teacher of computer services and trainer in a professional school specializing in computer technologies and accounting. In 2005 started Forex trading. Authored articles and analytical reviews on Forex market on Forex websites and forums. Since 2008 performs Forex market research, and develops and implements his own trading strategies of Forex analysis (especially in Forex Research & Analysis, Currency Forecast, and Recommendations and Analysis) that lies in: Numerical analysis: Probabilities, equations and techniques of applying Fibonacci levels. Classical analysis: Breakout strategy and trend indicators. Uses obtained skills to manage traders' accounts since 2009. In April 2009 was certified Financial Technician by the International Federation of Technical Analysts. Winner of several social work awards: Education Literacy and Non-Formal Education (in Literacy and Adult Education in The National Initiative for Human Development).
 Andrey Shevchenko
  Graduated from Irkutsk State University. Having acquainted with Forex market in 2008, followed the courses in the International Academy of Stock Exchange Trading. The agenda was so exiting that she moved to St. Petersburg in order to get professional education. Obtained a diploma of the retraining course on the discipline Exchange market and stock market issues, defended the graduation paper with distinction on the subject "Modern technical indicators as the basis of the trading system". At the moment obtains a master degree in International Banking Institute on specialty Financial markets and investments. Apart from trading is occupied with development of trading systems and formalization of the working strategies using Ichimoku indicator. At the moment is working on the book dedicated to the peculiarities of Ichimoku indicator and its operating methods. Interests: yoga, literature, travelling and photograph. "You can only get smarter by playing a smarter opponent" Basics of Chess play, 1883 "Successful people change by themselves, the others are changed by life" Jim Rohn
No comments:
Post a Comment