| EUR/USD: plan for the European session on October 20. COT reports. Bulls need a breakout of 1.1793 to maintain growth potential 2020-10-20 To open long positions on EUR/USD, you need: Buyers of the euro coped with resistance at 1.1770 without any problems in the afternoon, however, they failed to wait for a convenient entry point even from this level. Let's take a look at the 5-minute chart. You can clearly see how the bulls are attacking 1.1770 and continue to push the euro up to the resistance area of 1.1797, from which I recommended selling EUR/USD immediately on a rebound. But we did not even reach five points to this level, so whoever did not enter the market in short positions and missed this entry point did the right thing, since there was no signal to sell. 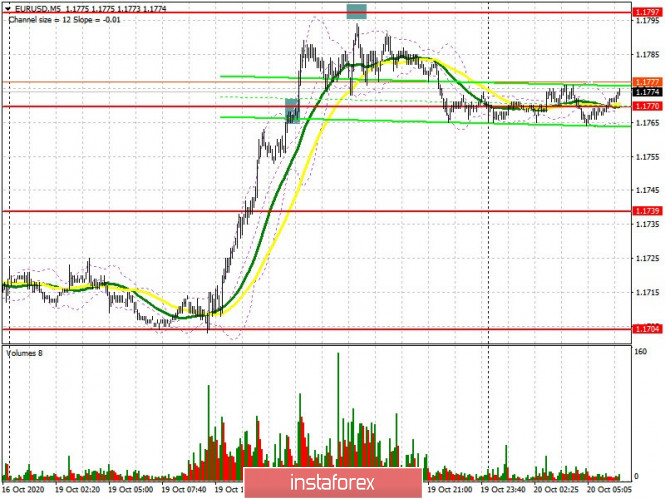 Today a lot will depend on how buyers appear in the resistance area at 1.1793. If the bulls immediately test this range and try to gain an even higher foothold there, then wait until this level has been updated from top to bottom before buying the euro, since the probability of forming a false breakout there is quite high. This is all due to the divergence that is currently forming on the MACD indicator. If bears do not exceed the 1.1793 level, then you can buy and wait until the euro recovers and reaches a high of 1.1824, as well as for the renewal of the larger resistance at 1.1868, where I recommend taking profit. An equally important task for the bulls, in the absence of fundamental statistics, will be to protect support at 1.1765, slightly below which there are now moving averages playing on the side of the euro buyers. Forming a false breakout there and rebounding from the averages will be a signal to buy EUR/USD. If there is no rapid upward movement from this range, then it is best to postpone buy positions until the intermediate support at 1.1739 has been tested, or open long positions immediately on a rebound from the low of 1.1704, counting on a correction of 15-20 points within the day. The Commitment of Traders (COT) report for October 13 showed a decrease in long positions and an increase in short ones, which led to an even greater decline in the delta. Despite this, buyers of risky assets believe that the bull market will continue, but they prefer to act with caution, as there is no good news for the eurozone yet. Thus, long non-commercial positions decreased from 231,369 to 228,295, while short non-commercial positions increased from 57,061 to 59,658. The total non-commercial net position decreased to 168,637, against 174,308 a week earlier. which indicates a wait-and-see attitude from new players, however, bullish sentiments for the euro remain rather high in the medium term. The more the euro will decline against the US dollar at the end of this year, the more attractive it will be for new investors. To open short positions on EUR/USD, you need: Sellers need to defend resistance at 1.1793, since a lot depends on it. Forming a false breakout at this level in the first half of the day, which may occur after updating Monday's high, together with the confirmation of the divergence, which is now visible on the MACD indicator, will be an excellent signal to open short positions in euro with the goal of breaking and settling below the support of 1.1765 , slightly below which the moving averages pass. However, it will be possible to talk about gradually returning control to the bears after settling below 1.1765, which forms a good signal to sell the euro to the 1.1739 area, but the next target will be the low of 1.1704, where I recommend taking profit. In case EUR/USD grows further along the trend and a breakout is formed on resistance at 1.1793, I recommend not to rush to sell, but to wait until a new high at 1.1824 has been updated, or open short positions immediately on a rebound from the resistance of 1.1868, counting on a correction of 15-20 points within the day. 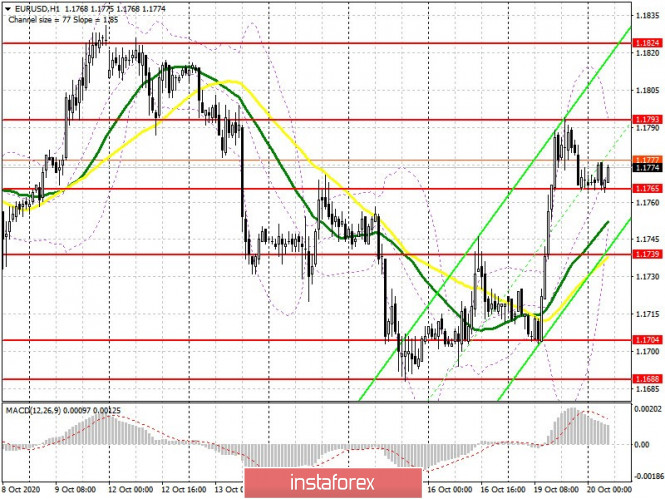 Indicator signals: Moving averages Trading is carried out above 30 and 50 moving averages, which indicates the continued bullish sentiment in the market. Note: The period and prices of moving averages are considered by the author on the H1 chart and differs from the general definition of the classic daily moving averages on the D1 daily chart. Bollinger Bands A breakout of the lower border of the indicator around 1.17550 will increase pressure on the euro and lead to a larger downward movement of the pair. A breakout of the upper border of the indicator in the 1.1790 area will lead to an increase in EUR/USD. Description of indicators - Moving average (moving average, determines the current trend by smoothing out volatility and noise). Period 50. It is marked in yellow on the chart.
- Moving average (moving average, determines the current trend by smoothing out volatility and noise). Period 30. It is marked in green on the chart.
- MACD indicator (Moving Average Convergence/Divergence — convergence/divergence of moving averages) Quick EMA period 12. Slow EMA period to 26. SMA period 9
- Bollinger Bands (Bollinger Bands). Period 20
- Non-commercial speculative traders, such as individual traders, hedge funds, and large institutions that use the futures market for speculative purposes and meet certain requirements.
- Long non-commercial positions represent the total long open position of non-commercial traders.
- Short non-commercial positions represent the total short open position of non-commercial traders.
- Total non-commercial net position is the difference between short and long positions of non-commercial traders.
Brief trading recommendations for EUR/USD on 10/20/20 2020-10-20 
Yesterday, the EUR/USD pair failed to break through the pivot point – the support level of 1.1700 (1.1685/1.1700), and this resulted in a reversal movement, which led to the quote's pullback to the area of 1.1765/1.1793. In this case, several technical factors acted as a support to strengthen the European currency. I suggest that you consider them. 1. A technical price rebound from the important price level 1.1700, where the quote was held for a long time without updating the low - 1.1685. This is the so-called natural basis associated with the repetition of important price levels in terms of price rebound. 2. The relationship of trading instruments, in this case the GBP/USD and EUR/USD pairs, where the pound set an upward pace in view of Brexit information, and it was picked up by the European currency, drawing almost the same inertia. Regarding the quote's current location, you can see that there was a slowdown in the form of a pullback followed by a range of 1.1765/1.1793, after a sharp growth of 1.1705 -> 1.1795. Trading forecasts can be made from several possible market scenarios based on the location of the quote and the range. First scenario: Working on the breakdown of the specified boundaries This is considered to be the best trading strategy, where work is carried out on a breakdown of a particular boundary of the variable stagnation 1.1765/1.1793. The prospect has quite good return, since it will lead to new inertial changes in the market. - Buy deals is made above the level of 1.1795, in the direction of 1.1815-1.1825. - Sell delas is made below the level of 1.1765, in the direction of 1.1745-1.1700. Second scenario: Prolonging stagnation In this case, the boundaries of fluctuations 1.1765/1.1793 turned out to be stronger than expected. This leads to a delay in the amplitude process, but we will still return to the first scenario in the end. 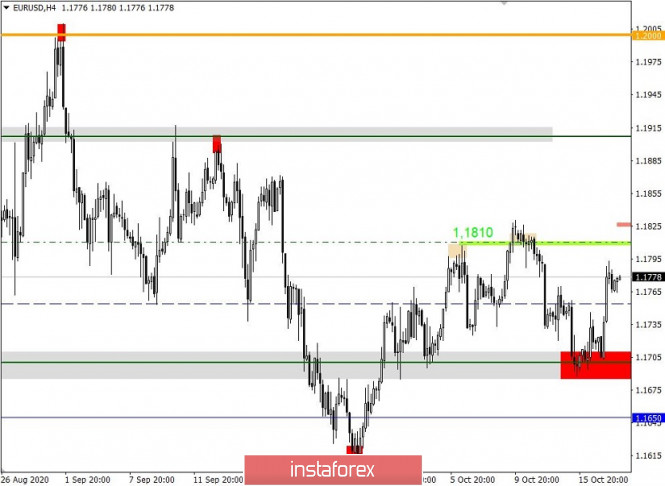
Indicator analysis. Daily review on GBP/USD for October 20, 2020 2020-10-20 Trend analysis (Fig. 1). On Tuesday, the market will attempt to continue moving up from the level of 1.2948 (the closing of yesterday's daily candle) with the goal of 1.2983 - a pullback level of 38.2% (blue dotted line). If this level is reached, keep on working up with the goal of 1.3078 - a pullback level of 50.0% (blue dotted line). 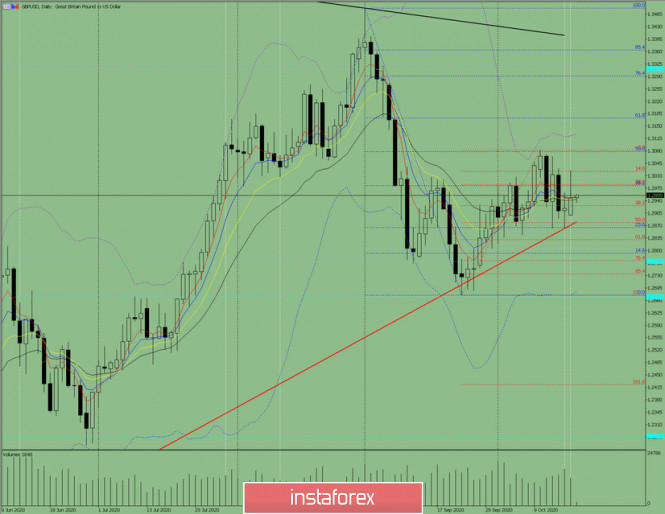
Figure 1 (Daily chart). Complex Analysis: - Indicator analysis - up
- Fibonacci levels - up
- Volumes - up
- Candle analysis - up
- Trend analysis - up
- Bollinger bands - up
- Weekly chart - up
General conclusion: Today, the price from the level of 1.2948 (the closing of yesterday's daily candle) will try to continue moving up with the goal of 1.2983 - a pullback level of 38.2% (blue dotted line). If this level is reached, keep on working up with the goal of 1.3078 to roll back the level of 50.0% (blue dotted line). Unlikely scenario: an upward movement with a target of 1.2983 - a pullback level of 38.2% (blue dotted line). If this level is reached, work down with the target 1.2881 - support line (red bold line). EUR/USD: Will the US national debt put a lot of pressure on the USD? 2020-10-20 
The US dollar is confused by the imbalance issue, being a victim of the upcoming elections and national debt. The lack of balance in the EUR/USD pair hinders its further growth, which makes the market very worried. Today, there was a formation of an unfavorable external background for the US currency, which can trigger a lot of problems. Experts consider Fed's increasing purchases of securities to be one of them. This so-called "paper takeover" has tripled which puts a lot of pressure on the dollar. The regulator acquired mortgage and treasury securities for $ 29.97 billion last week, which is more than the amount recorded a week earlier – $ 11.16 billion. Experts also emphasized that the yield of US government bonds remains very low. The confusing up and down movement of the USD creates the question of another stimulus in the US, which is currently undecided. The market is tensely waiting for the appropriate decision from the monetary authorities, and during this waiting period, the US currency is experiencing the strongest volatility. Thus far, traders and investors are counting on an agreement between the US Democratic and Republican parties to provide additional assistance to citizens and businesses. This issue has become a hindrance between leading politicians. Many Republicans who previously supported current US President D. Trump disagrees with him, while other policymakers are questioning the need for another major stimulus package. Although there are a lot of contradictions on key issues, the market is optimistic. Specialists believe that the US currency can still grow moderately and this is confirmed by the current trend. Today, the EUR/USD pair is trading around the level of 1.7777, which could bring luck to this pair. The rising US national debt is also another factor that puts pressure to the US dollar according to the experts. The money supply has no space for the US dollar to grow, creating a surplus in the international market. However, some analysts disagree. According to Lawrence Summers, the former US Treasury Secretary, monetary authorities can borrow the amount of money they need without much damage to the economy. At the same time, zero rates and the time-tested status of a global defensive asset is on the dollar's side. L. Summers is sure that this will not allow the dollar to collapse even in the event of an excess of money supply. Experts believe that the US dollar will cope with the burden of the national debt. The unsteady volume of loans will not be able to push down the dollar, but its sustainability has a limit. Therefore, experts do not suggest testing the USD for strength in the future, as the financial consequences of such manipulations are unpredictable. Technical Analysis of GBP/USD for October 20, 2020 2020-10-20 Technical Market Outlook: The GBP/USD bounced towards the level of 1.3017 but was capped at this level and reversed back down towards the upper channel line after the market had been rejected from the supply zone located between the levels of 1.3059 - 1.3081. This zone will be the key short-term zone for both bulls and bears and only a clear and sustained breakout will show the traders the next direction for Pound. In a case of a bullish scenario, the next target would be 1.3121 and the next target for bears is seen at the level of 1.2868 and 1.2848. Weekly Pivot Points: WR3 - 1.3222 WR2 - 1.3147 WR1 - 1.3005 Weekly Pivot - 1.2924 WS1 - 1.2790 WS2 - 1.2718 WS3 - 1.2567 Trading Recommendations: On the GBP/USD pair the main, multi-year trend is down, which can be confirmed by the down candles on the monthly time frame chart. The key long-term technical resistance is still seen at the level of 1.3518. Only if one of these levels is clearly violated, the main trend might reverse (1.3518 is the reversal level) or accelerate towards the key long-term technical support is seen at the level of 1.1903 (1.2589 is the key technical support for this scenario). 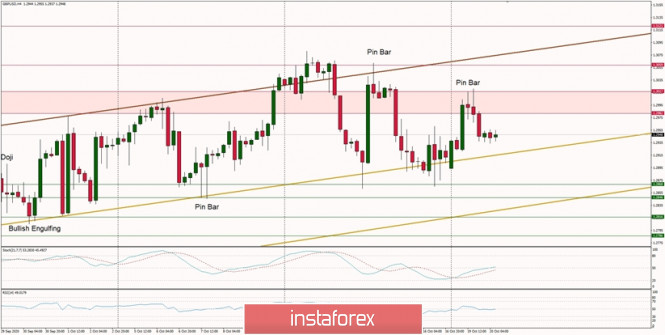
Technical Analysis of EUR/USD for October 20, 2020 2020-10-20 Technical Market Outlook: The EUR/USD made a local lower low at the level of 1.1688, just below the technical support seen at the level of 1.1696 and then bounced higher in order to break through the local trend line resistance. The local high was made at the level of 1.1792, which is a part of the old Supply Zone. The next target for bulls is seen at the level of 1.1822, which is the 61% Fibonacci retracement level from the weekly time frame. The price had been testing this level many times before, but is still unable to leave it alone. The nearest intraday support is seen at the level of 1.1764. Weekly Pivot Points: WR3 - 1.1924 WR2 - 1.1873 WR1 - 1.1783 Weekly Pivot - 1.1733 WS1 - 1.1641 WS2 - 1.1593 WS3 - 1.1509 Trading Recommendations: Since the middle of March 2020 the main trend is on EUR/USD pair has been up, which can be confirmed by almost 10 weekly up candles on the weekly time frame chart and 4 monthly up candles on the monthly time frame chart. Nevertheless, weekly chart is recently showing some weakness in form of a several Pin Bar candlestick patterns at the recent top seen at the level of 1.2004. This means any corrections should be used to buy the dips until the key technical support is broken. The key long-term technical support is seen at the level of 1.1445. The key long-term technical resistance is seen at the level of 1.2555. 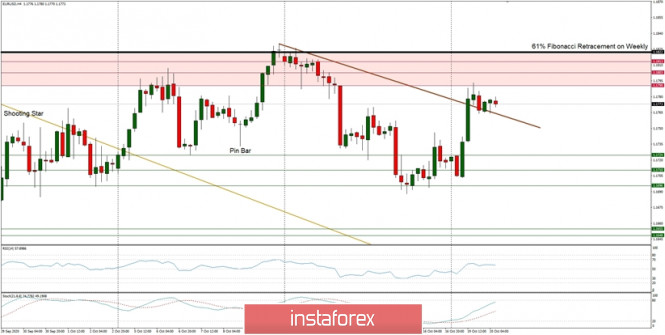
Trading plan for the EUR/USD pair on October 20. Second pandemic wave in Europe and correction in the US market. 2020-10-20 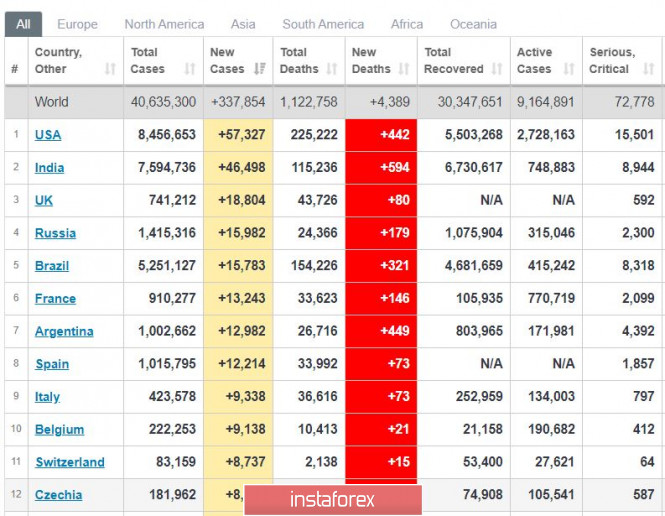
Europe went back to being the center of the pandemic again. Although the US and India still have the highest incidence rates, many European countries are already following this step. One of which is the UK, which already records more than 18 thousand new cases a day. Then, Spain follows with 12 thousand daily incidence, Italy with 9 thousand, and then Switzerland at more than 8 thousand. In France, a curfew has been imposed to control and lessen the spread of the virus. 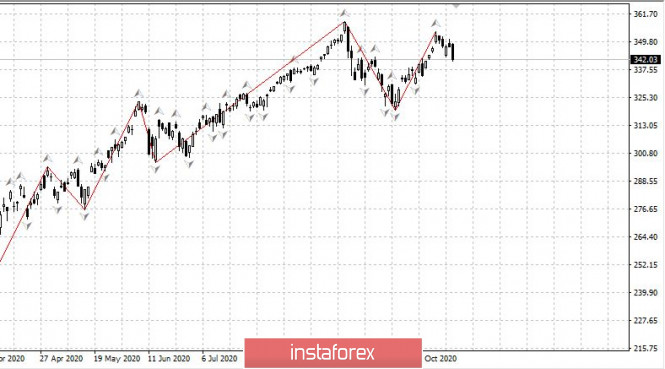
S&P 500 index, daily chart. A strong collapse has been observed, which can be accounted to the upcoming US presidential election, where Democrat Joe Biden will most likely win. Because of that, the market is currently facing an unclear prospect with business taxes, to which Trump promised big protests if he loses. Sell when stocks rebound upwards. 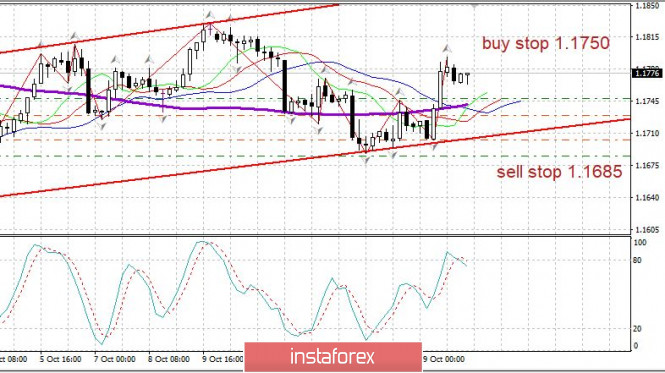
EUR/USD - the euro is currently facing a correction, but it could turn into a new wave of growth towards the level of 1.1860 Keep setting up long positions from the level of 1.1707 and 1.1748, then take profit at the level of 1.1700. Longs may also be opened from the level of 1.1745 Trading plan for EUR/USD and GBP/USD for 10/20/2020 2020-10-20 Something went wrong yesterday when everything should be quiet and calm. This caused the pound and euro to grow quite actively. At the same time, the pound became the first to grow, so the reason for the violation of the established order lies in the UK, which was exactly the case. And the answer lies in just one single person – Boris Johnson. It should be recalled that at the end of the EU summit, British Prime Minister complained about the total unwillingness of Brussels to change its approach to negotiating a trade agreement and called for preparing for an unregulated Brexit, that is, without the trade agreement itself. So, yesterday, Mr. Johnson made a statement once again that crosses out all the previous ones. He announced that in order to reach a compromise on a trade agreement, London is ready to make a number of fundamental changes to the law on the protection of the UK internal market. The very law that caused London and Brussels to have a serious fight and almost disrupted the entire course of negotiations. So far, there is no specifics as to what kind of changes can be made to this most unfortunate law. Nevertheless, London's willingness to concede on this issue has led to the average optimism of the pound and euro. After all, the idea that an unregulated Brexit carries huge losses for the Euro zone has been actively discussed recently, but without serious justification and evidence. However, the pound began to decline and lost about half of all its gains just a few hours later, while the euro remained at its own. The answer lies in the United Kingdom. There was a report from the media that a strange document was signed for a possible action plan of the UK government in the event that Scotland tries to hold a second referendum on independence. This means that after Brexit, London does not rule out such a possibility. And although officials have not yet commented on this rather strange document compiled by a certain consulting company, the rest remained which made investors clearly worried. It was also enough to make the pound slightly decline. 
Yesterday's events left more questions than answers. So, investors will wait for answers to these very questions. For the news background, much will come from Britain, as US macroeconomic statistics are unlikely to make an impact on anything. Here, we are talking about construction, whose volume construction could rise by 2.8%. The number of building permits issued should also rise by 1.8%, which indicates a further growth potential in the volume of construction. However, all this does not have any significant influence on the pair. Building Permits Issued (United States): 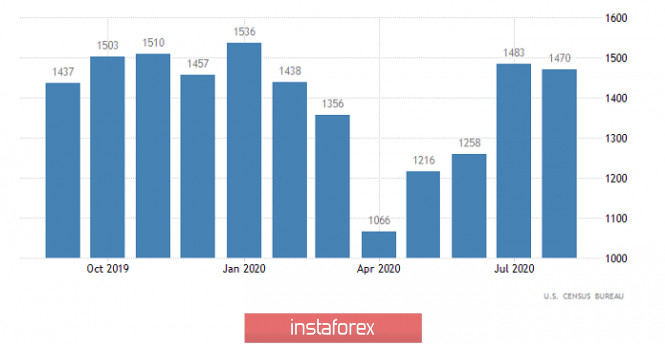
The GBP/USD pair showed high activity. As a result, the quote returned to the level of 1.3000, where there was a natural reduction in trading volumes, which resulted in a recovery move in the direction of the coordinate 1.2935. Now, there is a characteristic consolidation of 1.2935/1.2955, which is highly likely to end with another speculative activity surge, where breaking the established limits is considered to be the best trading method. 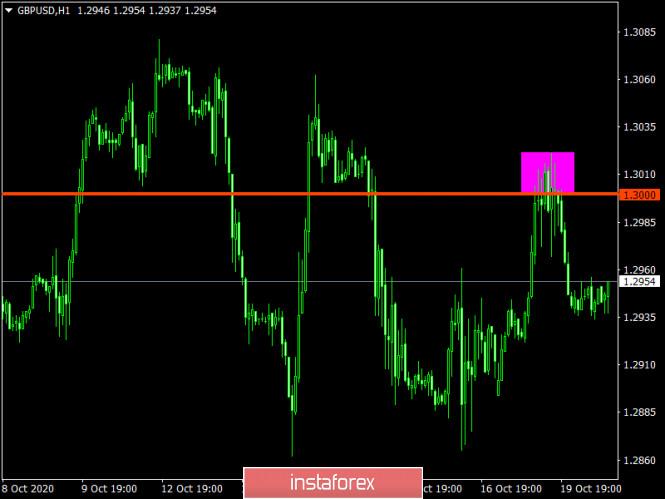
Following the pound, the EUR/USD pair showed an upward interest during yesterday's European session, where the quote returned within the range of 1.1765/1.1795 in the structure of the inertial movement. We can assume that the quote will temporarily concentrate on the values of 1.1765/1.1795, which will lead to a sideways move, from which the breakdown method can also be used. 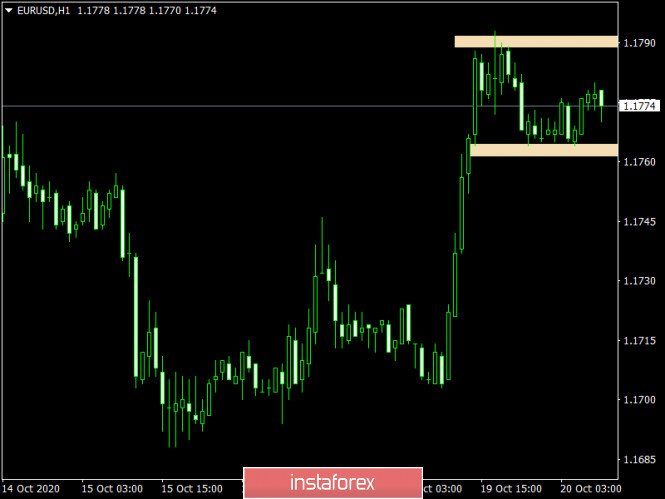
Market's mood is determined by the continuation of new stimulus package negotiations. Overview of the NZD/USD and AUD/USD 2020-10-20 US stocks closed in the "red zone" yesterday just before the negotiations between Nancy Pelosi and Steven Mnuchin resumed, whose goal is to overcome differences between Republicans and Democrats about financial support. However, investors believe that it will not be possible to agree on a stimulus package before the US elections on November 3, since there is no positive news regarding the negotiations. As a result, most of the stock indices of the Asia-Pacific countries are also sold out. This is followed by the opening of Europe, which is expected in the "red zone" too. Moreover, rising tensions will increase the pressure on commodity currencies, so the dollar has every chance to start strengthening after yesterday's weakening again. The market optimism which was received last Friday after the US retail sales report in September are already used up. NZD/USD Recent macroeconomic data provide a slightly more positive view of both the prospects for the recovery of the New Zealand economy and the fate of the NZD. The housing market is recovering significantly faster than expected, indicating stronger consumer demand. At the same time, forecasts for GDP, labor market, and inflation are revised upward. The service sector activity index exceeded the 50p level in September, while the manufacturing sector climbed from 50.7p to 54p. As a result, the quarterly NZIER survey shows the growth of business confidence in the 3rd quarter. 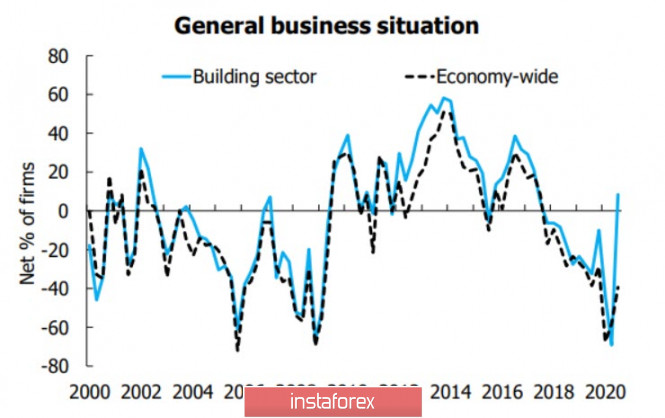
The turning point in firms' moods about business expansion, headcount and investment is noteworthy. For example, this turning point has not yet occurred in the US, despite the partial economic recovery after failing in the second quarter. These positive changes add confidence, but they are not yet enough to change the overall trend. The pace of economic recovery is forecast to slow down from January, and as promised earlier, the RBNZ will cut its key rate by 0.5% at its April meeting. The only thing that has clearly changed is the assessment of risks – they are now considered balanced, and failure in the economy is unlikely. Over the reporting week, net long position in NZD slightly increased, but the trend remains neutral. A decline in the estimated fair price in August-September led to a halt in the growth of NZD/USD, but the kiwi went into a sideways range on the spot. Today, there are chances to grow again. 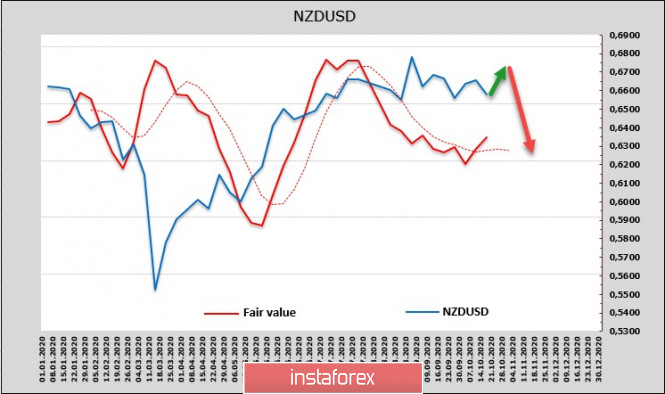
The formation of a local bottom at the lower limit of the range of 0.6480/6510 and a return to the upper limit of the channel 0.6760/80 is the most likely scenario, as there are not enough bases to get out of the range. Despite temporary positivity, investors expect that the RBNZ will significantly weaken the NZD with the planned measures to reduce the rate and expand QE, so the growth is highly likely to be used for profit-taking and entering long-term short positions. AUD/USD The net long position was reduced by 494 million to 276 million over the reporting week, that is, virtually to zero. There is no trend in futures, considering the dynamics of the stock and debt market in Australia. Moreover, there is a prolonged downward trend. 
Last Friday, RBA's head, Mr. Lowe hinted that the Central Bank will most likely consider the issue of further expanding stimulus measures on November 3. In particular, he allowed to lower the current rate of 0.25% to 0.10%, as well as the possibility of direct quantitative easing within 5-10 years. Technically, the Australian dollar looks weak this morning, which is mainly due to the prospect of easing the RBA policy. After it rebounded from the border of the 0.7245 channel, it has every chance to decline the support level of 0.7005 and towards the lower border of the 0.6850/70 channel. Technical analysis of GBP/USD for October 20, 2020 2020-10-20 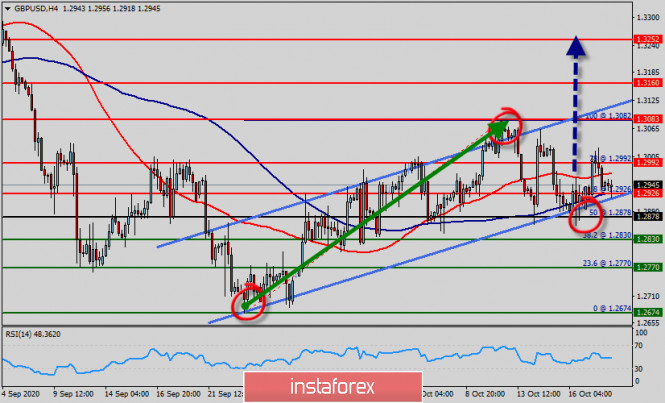 Overview : The GBP/USD pair can still form an ascending impulse, it continues to rise upwards. The major support is seen at 1.2878 which coincides with the ratio of 50% Fibonacci. According to the main scenario, it may start forming correctional structures. Today, we foresee the price to move towards the level of 1.2992 and then reach a new maximum again around the price of 1.3082. Please, note that the strong resistance stands at the level of 1.3082. If the price breaks the level of 1.3082, we expect potential testing of 1.3160. The current ascending structure implies that the market may reach the level of 1.3160. In this area, the trend is challenging a major resistance level. RSI (14) is seeing major support above 30 where we expect further upside movement from ths area of 1.2878. The market is still indicating a strong bullish trend from the level of 1.2878. The ascending impulse is strong enough to buy above the support of 1.2878. Therefore, the price is expected to reach a high once again. It is rather gainful to buy at 1.2900 with the targets at 1.2992 and 1.3082. So, it is recommended to place take profit at the price of 1.3160 as the first target today. On the contrary, stop loss should be placed at the price of 1.2830 (below the daily support). The bullish outlook remains the same as long as the RSI indicator is pointing to the upside on the four-hour chart. Forecast : According to the previous events the price is expected to remain between 1.2878 and 1.3083 levels. Buy-deals are recommended above 1.2878 with the first target seen at 1.2992. The movement is likely to resume to the point 1.3082 and further to the point 1.3160. The decending movement is likely to begin from the level 1.2878 with 1.2830 and 1.2674 seen as targets. Technical analysis of USD/JPY for October 20, 2020 2020-10-20 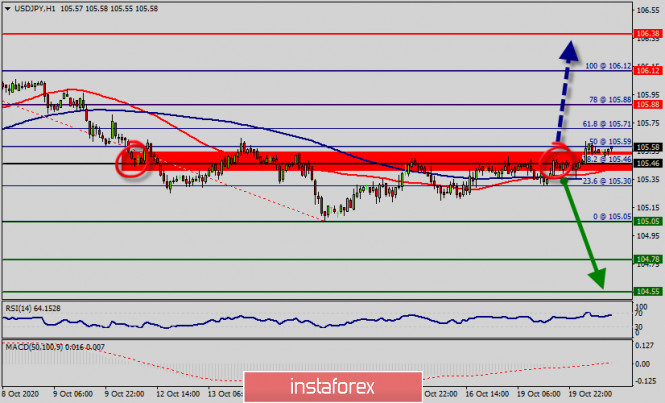 Overview : Between 105.30 and 105.71 USD/JPY reached 105.59, which was the highest price for the pair on record since yesterday. The USD/JPY pair continues moving in a bearish trend from the resistance level of 105.46. The USD/JPY pair has broken support at the level of 105.46, which acts as resistance now. So, the pair has already formed minor support at 105.46. Currently, the price is in a bearish channel. This is confirmed by the RSI indicator signaling that we are still in a bearish trending market. Therefore, there is a possibility that the USD/JPY pair will move downside and the structure of a fall does not look corrective. The trend is still below the 100 EMA for that the bearish outlook remains the same as long as the 100 EMA is headed to the downside. Moreover, the moving average (100) starts signaling a downward trend; therefore, the market is indicating a bearish opportunity below 105.46. Amid the previous events, the price is still moving between the levels of 105.88 and 104.55. If the USD/JPY pair fails to break through the resistance level of 105.46, the market will decline further to 105.05 as as the first target. The bias remains bearish in the nearest term testing 105.30 and 105.05. Immediate resistance is seen around 105.46 levels, which coincides with the weekly pivot. Thus it will be good to sell at 105.46 with the first target of 105.05. It will also call for a downtrend in order to continue towards 104.78. The strong weekly support is seen at 104.55. Also, the double bottom is seen at the level of 105.05. If the trend is buoyant, then the currency pair strength will be defined as following: USD is in an uptrend and JPY is in a downtrend. However, if a breakout happens at the resistance level of 105.88, then this scenario may be invalidated. On the other hand, if the pair closes above the minor resistance (105.46), the price will fall into the bullish market in order to go further towards the strong resistance at 105.88. Overall, we still prefer the bearish scenario which suggests that the pair will stay below the zone of 105.46/105.88 to day. EUR/USD: The Federal Reserve is pleased with the current pace of economic recovery in the US. The euro has a low chance of increasing sharply in the short term. 2020-10-20 The unprecedented optimism of euro bulls, which could be observed in the market yesterday, is unlikely to continue amid the deteriorating situation with the coronavirus. The disappointing news about the vaccine being developed in the United States has already put pressure on stock markets, and it is rather soon that investors will finally realize that the European Central Bank would not be able to avoid lowering the interest rates, which will add pressure on the European currency.  Many leading agencies have pointed out that any decrease in interest rates will knock the euro out, since as of the moment, the only thing that is keeping the currency afloat is the absence of changes in interest rates and the extension of the ECB's bond purchase program ... Aside from that, the central bank is concerned about having a too-expensive euro, thus, it may consider adopting new measures in the future. Christine Lagarde said that easing the monetary policy will not put significant pressure on the currency, and since economic recovery continues to slow down in Europe, the ECB may resort to such an action. Despite that, traders are not keen yet on selling-off the euro, but this is because it is still unclear what measures the bank will take in the future. As for economic statistics, the reports published yesterday did not affect the market much, but this is because they are not of particular importance. Nonetheless, it is still sanguine to hear a good report on the US housing market, which, according to the National Association of Home Builders (NAHB), has pulled up to 85 points in October. The more buyers there are in the housing market, the better it will affect the economic picture as a whole. It was the record low interest rates that continue to support strong demand, aside from the fact that there are no problems with credit and access to liquidity in the United States. 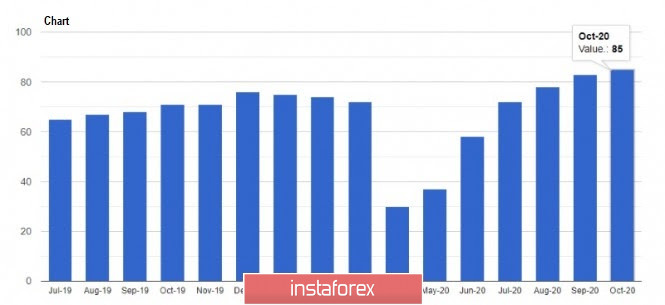 Yesterday, some Fed representatives also delivered optimistic statements about the US economy, which were in line with the remarks of Fed Chairman Jerome Powell. For example, Rafael Bostic said that he is satisfied with the current monetary policy, as the economy is recovering quite well and it will take a long time before the Fed starts thinking about raising rates or curtailing support. Bostic believes that once the emergency support programs are completed, the Fed's new policy will play a key role in reducing inequality and closing the social divide created by the coronavirus pandemic among the population. His fellow Fed spokesman, Richard Clarida, is also confident that additional support from monetary and fiscal policy will be needed in the future, as the current recession was the deepest in post-war US history. Clarida noted that economic data, which has come in since May this year, has been unexpectedly strong, and the continued economic growth amid the growing number of coronavirus infections once again proves the strength of the economy. However, until now, the US government still has not resolved the issue on funding, as both Republicans and Democrats do not want to make concessions on the topic. As of the moment, the US dollar is rising, but this is because traders are still hoping that the government will decide on an additional fiscal stimulus soon. If its adoption is postponed to a later date, say after the US elections, then the dollar could collapse in the market. Nonetheless, should the Democrats win the November elections, a larger stimulus package is likely to be developed. With regards to the EUR/USD pair, a large upward move will occur if the quote breaks out of the 18th figure, however, it will not be that easy considering the current situation. But still, if the bulls manage to make it happen, the pair will easily return to last week's high, which is 1.1830, and then maybe reach the price levels 1.1870 and 1.1920. Meanwhile, pressure on the euro could return if the quote moves below 1.1740, and such will result in the demolition of many buy stop orders, which will quickly push the pair to last week's low, which is 1.1685.
Author's today's articles: Maxim Magdalinin  In 2005 graduated from the Academy of the Ministry of Internal Affairs of the Republic of Belarus, law faculty. Worked as a lawyer for three years in one of the biggest country's company. Besides the trading, he develops trading systems, writes articles and analytical reviews. Works at stock and commodity markets explorations. On Forex since 2006. In 2005 graduated from the Academy of the Ministry of Internal Affairs of the Republic of Belarus, law faculty. Worked as a lawyer for three years in one of the biggest country's company. Besides the trading, he develops trading systems, writes articles and analytical reviews. Works at stock and commodity markets explorations. On Forex since 2006. Vladislav Tukhmenev  Vladislav graduated from Moscow State University of Technologiy and Management. He entered the forex market in early 2008. Vladislav is a professional trader, analyst, and manager. He applies a whole gamut of analysis – technical, graphical, mathematical, fundamental, and candlestick analysis. Moreover, he forecasts the market movements using his own methods based on the chaos theory. Vladimir took part in development of trading systems devoted to fractal analysis. In his free time, Vladimir blogs about exchange markets. Hobbies: active leisure, sporting shooting, cars, design, and marketing. "I do not dream only of becoming the best in my field. I also dream about those who I will take with me along the way up." Vladislav graduated from Moscow State University of Technologiy and Management. He entered the forex market in early 2008. Vladislav is a professional trader, analyst, and manager. He applies a whole gamut of analysis – technical, graphical, mathematical, fundamental, and candlestick analysis. Moreover, he forecasts the market movements using his own methods based on the chaos theory. Vladimir took part in development of trading systems devoted to fractal analysis. In his free time, Vladimir blogs about exchange markets. Hobbies: active leisure, sporting shooting, cars, design, and marketing. "I do not dream only of becoming the best in my field. I also dream about those who I will take with me along the way up." Sergey Belyaev  Born December 1, 1955. In 1993 graduated from Air Force Engineering Academy. In September 1999 started to study Forex markets. Since 2002 has been reading lectures on the technical analysis . Is fond of research work. Created a personal trading system based on the indicator analysis. Authored the book on technical analysis "Calculation of the next candlestick". At present the next book is being prepared for publishing "Indicator Analysis of Forex Market. Trading System Encyclopedia". Has created eleven courses on indicator analysis. Uses classical indicators. Works as a public lecturer. Held numerous seminars and workshops presented at international exhibitions of financial markets industry. Is known as one of the best specialists in the Russian Federation researching indicator analysis. Born December 1, 1955. In 1993 graduated from Air Force Engineering Academy. In September 1999 started to study Forex markets. Since 2002 has been reading lectures on the technical analysis . Is fond of research work. Created a personal trading system based on the indicator analysis. Authored the book on technical analysis "Calculation of the next candlestick". At present the next book is being prepared for publishing "Indicator Analysis of Forex Market. Trading System Encyclopedia". Has created eleven courses on indicator analysis. Uses classical indicators. Works as a public lecturer. Held numerous seminars and workshops presented at international exhibitions of financial markets industry. Is known as one of the best specialists in the Russian Federation researching indicator analysis. l Kolesnikova  text text Sebastian Seliga  Sebastian Seliga was born on 13th Oсtober 1978 in Poland. He graduated in 2005 with MA in Social Psychology. He has worked for leading financial companies in Poland where he actively traded on NYSE, AMEX and NASDAQ exchanges. Sebastian started Forex trading in 2009 and mastered Elliott Wave Principle approach to the markets by developing and implementing his own trading strategies of Forex analysis. Since 2012, he has been writing analitical reviews based on EWP for blogs and for Forex websites and forums. He has developed several on-line projects devoted to Forex trading and investments. He is interested in slow cooking, stand-up comedy, guitar playing, reading and swimming. "Every battle is won before it is ever fought", Sun Tzu Sebastian Seliga was born on 13th Oсtober 1978 in Poland. He graduated in 2005 with MA in Social Psychology. He has worked for leading financial companies in Poland where he actively traded on NYSE, AMEX and NASDAQ exchanges. Sebastian started Forex trading in 2009 and mastered Elliott Wave Principle approach to the markets by developing and implementing his own trading strategies of Forex analysis. Since 2012, he has been writing analitical reviews based on EWP for blogs and for Forex websites and forums. He has developed several on-line projects devoted to Forex trading and investments. He is interested in slow cooking, stand-up comedy, guitar playing, reading and swimming. "Every battle is won before it is ever fought", Sun Tzu Mihail Makarov  - - Alexandr Davidov  No data No data Evgeny Klimov  Родился 3 сентября 1962 г. В 1988 г. окончил экономический факультет Ростовского государственного университета. Работал преимущественно в банковской отрасли, послужной список включает в себя руководящие должности. Сферой интересов Евгения являются мировая экономика и политика. В своих материалах умело анализирует статистические данные и отчеты Центральных банков ведущих стран (ЕЦБ, Банк Англии, Банк Канады и пр.), Федерального Резерва и Казначейства США, получая в итоге верный прогноз движения курсов соответствующих валют. Родился 3 сентября 1962 г. В 1988 г. окончил экономический факультет Ростовского государственного университета. Работал преимущественно в банковской отрасли, послужной список включает в себя руководящие должности. Сферой интересов Евгения являются мировая экономика и политика. В своих материалах умело анализирует статистические данные и отчеты Центральных банков ведущих стран (ЕЦБ, Банк Англии, Банк Канады и пр.), Федерального Резерва и Казначейства США, получая в итоге верный прогноз движения курсов соответствующих валют. Mourad El Keddani  Was born in Oujda, Morocco. Currently lives in Belgium. In 2003 obtained B.S. in Experimental Sciences. In 2007 obtained a graduate diploma at Institut Marocain Specialise en Informatique Applique (IMSIA), specialty – Software Engineering Analyst. In 2007–2009 worked as teacher of computer services and trainer in a professional school specializing in computer technologies and accounting. In 2005 started Forex trading. Authored articles and analytical reviews on Forex market on Forex websites and forums. Since 2008 performs Forex market research, and develops and implements his own trading strategies of Forex analysis (especially in Forex Research & Analysis, Currency Forecast, and Recommendations and Analysis) that lies in: Numerical analysis: Probabilities, equations and techniques of applying Fibonacci levels. Classical analysis: Breakout strategy and trend indicators. Uses obtained skills to manage traders' accounts since 2009. In April 2009 was certified Financial Technician by the International Federation of Technical Analysts. Winner of several social work awards: Education Literacy and Non-Formal Education (in Literacy and Adult Education in The National Initiative for Human Development). Was born in Oujda, Morocco. Currently lives in Belgium. In 2003 obtained B.S. in Experimental Sciences. In 2007 obtained a graduate diploma at Institut Marocain Specialise en Informatique Applique (IMSIA), specialty – Software Engineering Analyst. In 2007–2009 worked as teacher of computer services and trainer in a professional school specializing in computer technologies and accounting. In 2005 started Forex trading. Authored articles and analytical reviews on Forex market on Forex websites and forums. Since 2008 performs Forex market research, and develops and implements his own trading strategies of Forex analysis (especially in Forex Research & Analysis, Currency Forecast, and Recommendations and Analysis) that lies in: Numerical analysis: Probabilities, equations and techniques of applying Fibonacci levels. Classical analysis: Breakout strategy and trend indicators. Uses obtained skills to manage traders' accounts since 2009. In April 2009 was certified Financial Technician by the International Federation of Technical Analysts. Winner of several social work awards: Education Literacy and Non-Formal Education (in Literacy and Adult Education in The National Initiative for Human Development).
Languages: Arabic, English, French and Dutch.
Interests: Algorithm, Graphics, Social work, Psychology and Philosophy. Pavel Vlasov  No data No data
Subscription's options management Theme's:
Fundamental analysis, Fractal analysis, Wave analysis, Technical analysis, Stock Markets
Author's :
A Zotova, Aleksey Almazov, Alexander Dneprovskiy, Alexandr Davidov, Alexandros Yfantis, Andrey Shevchenko, Arief Makmur, Dean Leo, Evgeny Klimov, Fedor Pavlov, Grigory Sokolov, I Belozerov, Igor Kovalyov, Irina Manzenko, Ivan Aleksandrov, l Kolesnikova, Maxim Magdalinin, Mihail Makarov, Mohamed Samy, Mourad El Keddani, Oleg Khmelevskiy, Oscar Ton, Pavel Vlasov, Petar Jacimovic, R Agafonov, S Doronina, Sebastian Seliga, Sergey Belyaev, Sergey Mityukov, Stanislav Polyanskiy, T Strelkova, Torben Melsted, V Isakov, Viktor Vasilevsky, Vladislav Tukhmenev, Vyacheslav Ognev, Yuriy Zaycev, Zhizhko Nadezhda
Edit data of subscription settings
Unsubscribe from the mailing list Sincerely,
Analysts Service | If you have any questions, you can make a phone call using one of the
InstaForex Toll free numbers right now:
|  | InstaForex Group is an international brand providing online trading services to the clients all over the world. InstaForex Group members include regulated companies in Europe, Russia and British Virgin Islands. This letter may contain personal information for access to your InstaForex trading account, so for the purpose of safety it is recommended to delete this data from the history. If you have received this letter by mistake, please contact InstaForex Customer Relations Department. |


No comments:
Post a Comment