Tuesday, August 9, 2022

Keep the Odds in Your Favor

Shield

AN OXFORD CLUB PUBLICATION

Wealthy Retirement

View in browser

SPONSORED

Biden to Replace US Dollar?

Thanks to President Biden's Executive Order 14067, a former advisor to the CIA and Pentagon predicts the 3rd Great Dollar Quake has begun.

The first was Roosevelt confiscating private gold in 1934.

The second was Nixon abandoning the gold standard in 1971.

Now, Biden's plan could pave the way for "retiring" the US dollar. Your dollars could soon be confiscated - or made worthless.

Click here to see how to save your investment and retirement accounts.

How to Make Order Out of Market Chaos

Marc Lichtenfeld, Chief Income Strategist, The Oxford Club

Marc Lichtenfeld

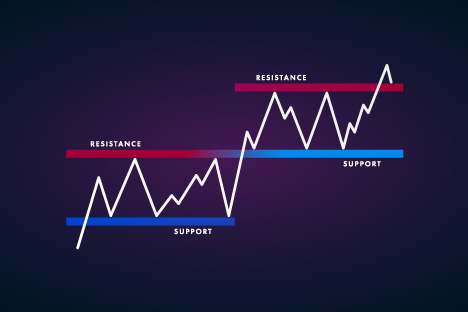
When I was a kid, I was a bit sloppy. My mom was always on me to clean up my room.

In college, I was no better. Living with three other guys didn't exactly turn me into a neat freak. Our house probably should have been condemned.

But as I've gotten older, I've come to crave order in my life. So much so that I was shocked when I heard myself pleading with my daughter to please clean up after herself to keep the house looking nice.

Nowhere is that desire for order in my life more apparent than in my trading. Maybe it started at the beginning of my career as an assistant on a trading desk, back when I couldn't make any sense of the numbers dancing across my screen, clueless as to how traders decided when to buy and sell.

I needed some way to create order out of all of those numbers and symbols.

Now when I trade, I use technical analysis.

Technical analysis - the use of stock charts to analyze the markets and individual stocks to inform buy and sell decisions - is great for creating a trading plan.

As I always say, technical analysis is not a crystal ball. But it does help you increase the chances of being right and, just as importantly, minimize your losses when you're wrong.

Everyone's trading style is different, and there are lots of technical analysis tools that fit any individual's preferred method.

As a long-term investor, I'm a value investor. I like to buy beaten-up stocks (with dividends) and watch them bounce back over time.

So it's no surprise that, as a trader, I do the same thing - just with a much shorter time horizon.

With the goal of entering a trade at a discount, I may buy a stock that's predominantly moving up a trend line and yet has momentarily returned to support - the price level at which a stock's downtrend reverses.

For example, if I were interested in buying Tesla (Nasdaq: TSLA), I would wait until the stock returned to the trend line (the orange line), which is acting as support.

Tesla Has Been Rebounding Off Support
 

If the stock never returns to the trend line, I will miss the trade, which I'm fine with.

But if the stock's price returns to the support line, I will pull the trigger for two reasons...

The first reason is if the stock proceeds to drop below the support line, that signals to me that I'm wrong and enables me to quickly exit the trade with minimized losses. The second reason is if I'm right, the stock will bounce from support - likely to new highs - and I will have bought the stock much cheaper than it will be going for in the future.

There are other tools that help me fine-tune the timing of my trades. Some of my favorites are stochastic momentum indicators. I've been using them for more than 20 years, ever since I spent a day with the inventor of the stochastic oscillator, George Lane, who walked me through how stochastics work.

SPONSORED

Going Up?

Elevator Doors
 

This elevator's climbing to the top floor of one of Baltimore's most prestigious hotels.

There, a leading crypto analyst is blowing the lid off what could be the most lucrative phenomenon in crypto market history.

>>> CLICK HERE FOR THE BIG REVEAL...

Stochastic indicators often show a range of 20 to 80. When their readings top 80, a stock is overbought. When they dip under 20, a stock is oversold.

I use stochastics to wait for an oversold reading that's turning higher, like the one shown in the bottom panel of this chart of Microsoft (Nasdaq: MSFT).

Microsoft's Stochastics and Stock Both Rise
 

You can see that Microsoft had been in a downtrend but also that every time the stock's stochastics readings in the bottom panel fell below 20, the stochastic line responded by turning higher, after which the stock rose.

Now, I don't buy every stock whose stochastics have fallen below 20 and are turning around, but I do combine attractive stochastic readings with other analysis, like support, resistance and other indicators.

Another indicator that I love - particularly for very short-term moves - comes from a legendary investor. This indicator, the 9-count, is roughly 40 years old and signals when a stock's move is exhausted so you can play it the other way.

For example, if a stock has been falling hard, when its count reaches 9, that's a buy signal. Conversely, when a stock has been rallying and hits 9, that's the time to consider heading for the exits.

I've found this indicator especially useful in this year's bear market. When stocks are tanking, it's hard to know what to buy. The 9-count helps me identify and make quick trades on stocks that should bounce upward in the short term. In and out in a few days, just like that.

I even use the 9-count to play the downside in bear market rallies.

I've created a video to show you the special way I use this indicator and why it's so helpful. It's also one of the easiest technical tools to understand that I've ever come across.

If you're trading this market, do yourself a favor and learn about it. It could make a tremendous difference in your portfolio, particularly if the market stays tough this year.

Click here for more information.

I wouldn't be a successful trader - or even have a career in the markets - if I hadn't come across technical analysis nearly 25 years ago. It has helped me better understand the movement of markets and stocks, and, most importantly, it has helped me develop a plan for each trade so that I'm not flying blind, crossing my fingers and hoping for a good outcome.

I strongly encourage you to explore technical analysis to see how it can help your trading results.

Good investing,

Marc

Leave a Comment

SPONSORED

One Pick a Week!?! Get at Least One Winning Recommendation per DAY...

Lots of people promise a trade recommendation a week...

Maybe even 12 winners or so... in a year...

Yet charge you thousands.

Here's How to Get 300 Winning Recommendations This Year... GUARANTEED (Click Here Now)

No comments:

Post a Comment

Why are billionaires loading up on oil?

JP Morgan analysts have pegged the future price of oil at $380.............................................................................