| Technical Analysis of EUR/USD for October 23, 2020 2020-10-23 Technical Market Outlook: The EUR/USD pair has been moving lower in a corrective cycle after the local high was made at the level of 1.1880. The bears have managed to push the price towards the 50% Fibonacci retracement level, but that might not be the end of the correction. There is one more Fibonacci level seen at 1.1761 which might be hit as well, because the market is coming off the overbought conditions and it is not even close to the bottom just yet. The nearest technical support is seen at the level of 1.1790. Weekly Pivot Points: WR3 - 1.1924 WR2 - 1.1873 WR1 - 1.1783 Weekly Pivot - 1.1733 WS1 - 1.1641 WS2 - 1.1593 WS3 - 1.1509 Trading Recommendations: Since the middle of March 2020 the main trend is on EUR/USD pair has been up, which can be confirmed by almost 10 weekly up candles on the weekly time frame chart and 4 monthly up candles on the monthly time frame chart. Nevertheless, weekly chart is recently showing some weakness in form of a several Pin Bar candlestick patterns at the recent top seen at the level of 1.2004. This means any corrections should be used to buy the dips until the key technical support is broken. The key long-term technical support is seen at the level of 1.1445. The key long-term technical resistance is seen at the level of 1.2555. 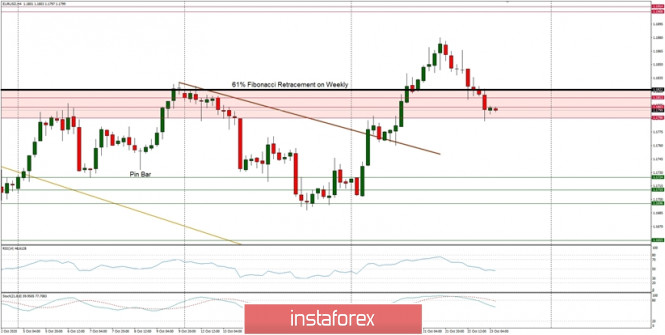
Technical Analysis of GBP/USD for October 23, 2020 2020-10-23 Technical Market Outlook: The GBP/USD pair keeps going lower as the corrective cycle from the local high at 1.3180 continues. The price has broken below the 38% Fibonacci retracement seen at 1.3074 and is heading towards the level of 50% located at 1.3041. The market is coming off the overbought levels, so the price might get below 1.3000 zome again. The key technical support is still seen at the level of 1.2982 - 1.3017. Moreover, it is worth to keep an eye on the upper channel line again for any indication of broken support. Weekly Pivot Points: WR3 - 1.3222 WR2 - 1.3147 WR1 - 1.3005 Weekly Pivot - 1.2924 WS1 - 1.2790 WS2 - 1.2718 WS3 - 1.2567 Trading Recommendations: On the GBP/USD pair the main, multi-year trend is down, which can be confirmed by the down candles on the monthly time frame chart. The key long-term technical resistance is still seen at the level of 1.3518. Only if one of these levels is clearly violated, the main trend might reverse (1.3518 is the reversal level) or accelerate towards the key long-term technical support is seen at the level of 1.1903 (1.2589 is the key technical support for this scenario). 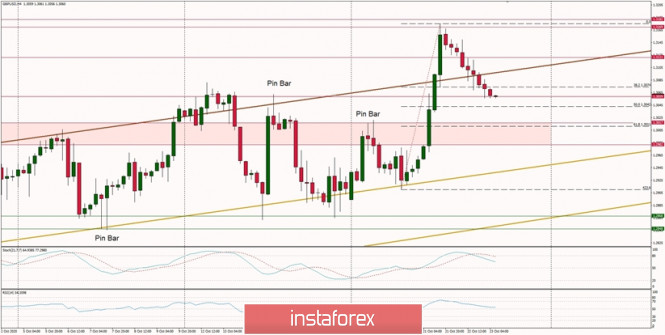
USD/JPY. Risk-off sentiment barometer: the yen may update the weekly low again 2020-10-23 Japan published the key data on the growth of inflation in the country, as well as PMI indices, during the Asian session today. However, the yen ignored these releases, once again demonstrating its "attachment" only to the events of the external fundamental background. Considering the general vulnerability of the US currency, the Japanese has again become the main protective tool in the foreign exchange market. Therefore, it is necessary to assess the future prospects of the USD/JPY pair through the prism of the current demand for safe haven currencies. Let's start with the Japanese macroeconomic reports. The key statistics play an important role in determining the prospects for monetary policy. The next meeting of the Bank of Japan will be held next week — the results of the October meeting will be announced on the 29th. 
Overall, Japanese inflation presented a weak result. The general consumer price index continued its downward movement, falling this time to zero. This is by far the weakest result in the last four years — the situation was worse only in the fall of 2016, when this indicator fell below zero. The consumer price index excluding prices for fresh food continued to be in the negative area, where it remains for the second month in a row. Another component — the consumer price index excluding food and energy prices — "tried" to leave the negative area. However, it could only rise to zero. To put it simply, the growth rate of inflation in Japan leaves much to be desired. In spite of the fact that the above indicators were at the forecast level, they reflected negative economic processes. Last week, the head of the Japanese regulator Haruhiko Kuroda admitted that the coronavirus pandemic has significantly suppressed consumer demand. Thus, the country's inflation rate is likely to be negative; at least until the end of this year. Today's release confirmed the Central Bank Governor's concerns that inflation remains a "weak link" in the Japanese economy. Kuroda also added that the Bank of Japan has not exhausted all the tools and is able to counter the consequences of the pandemic. He once again repeated his phrase that "if necessary, he will not hesitate to take additional mitigation measures." Considering the inflation dynamics, the Japanese controller can actually move from words to deeds in the next week. According to Reuters, the Central Bank will at least revise down its forecasts for the economy and inflation at the October meeting, which will be presented in the quarterly report of the Central Bank. Despite such dovish prospects, the USD/JPY pair "is living its own life." In response to the frankly weak inflation reports, the yen not only refused to fall in price, but even strengthened, retreating from the borders of the 105th figure. In general, nothing is surprising here: the Japanese currency, as a rule, ignores "internal" fundamental factors. Only in the case of any drastic political changes in the country (for example, as the recent resignation of Prime Minister Abe) or in the case of unexpected decisions by the Bank of Japan, the yen shows a more or less clear reaction. In other cases, the USD/JPY pair is focused on events of the external fundamental background. Therefore, today's release only increased the likelihood of easing the monetary policy of the Japanese regulator, but it did not affect the general sentiment of traders. Considering this disposition, it can be assumed that the southern trend of USD/JPY may soon strengthen — primarily due to the growth of risk-off sentiment. The TV debate between Donald Trump and Joe Biden ended a few hours ago. The market reaction is cautious and somewhat restrained, since it is difficult to objectively determine the clear favorite of the verbal duel. In the case of the September debate, the reaction of traders will follow a little later — when the first results of the TV audience surveys become known. It will become clear in which direction the pendulum swung — either Biden will strengthen his position and increase the gap from the head of the White House, or the intrigue of the presidential election will continue if the advantage is in the direction of Trump. The second option will strengthen risk-off sentiment in the market, since in the absence of a clear winner in the election, the current President will start fighting for every vote, calling into question the "postal vote." But this option is not excluded in the case of a failed loss, given his statements during the election race. He repeatedly voiced the idea that the election may be rigged in favor of Biden, and that the final word on the results of the vote will be said not by the election Commission, but by the US Supreme court. 
In any case, the dollar will have to go through a rough period of political uncertainty. The results of today's debate may increase concerns about this, provoking a surge in risk-off sentiment in the market, and therefore, increasing demand for the yen. It is also worth noting that the next deadline for negotiations on the fate of a new package of assistance to the US economy will expire today. Yesterday, the speaker of the House of representatives, Democrat Nancy Palosi, said that "negotiations are going well enough," assuring journalists that the long-suffering bill can be agreed and put to a vote before the presidential election. And should the negotiators disappoint investors again today, the southern trend of USD/JPY will get a significant boost. Therefore, short positions on the pair are still relevant, including from a technical point of view. The dollar/yen pair on the daily chart is located between the middle and lower lines of the Bollinger Bands indicator, as well as under all the lines of the Ichimoku indicator. This configuration allows the USD/JPY bears to at least update this week's low (which is marked at 104.35, heading towards the key support level of 104.00). Trading plan for the EUR/USD pair on October 23. New record high on COVID-19 incidence; Growth in the US dollar. 2020-10-23 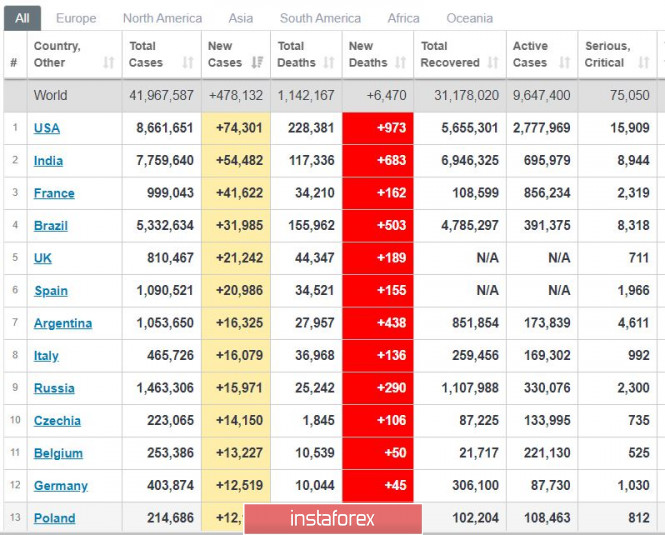
Latest data indicates that the world saw a new record high on COVID-19 incidence, having listed almost 500 thousand new cases worldwide. The most alarming situation is Europe's, as France recorded a massive figure of 41 thousand new infections a day. Britain and Spain then follows, with 21 thousand new cases a day. A vaccine for the disease is expected to come out this November. 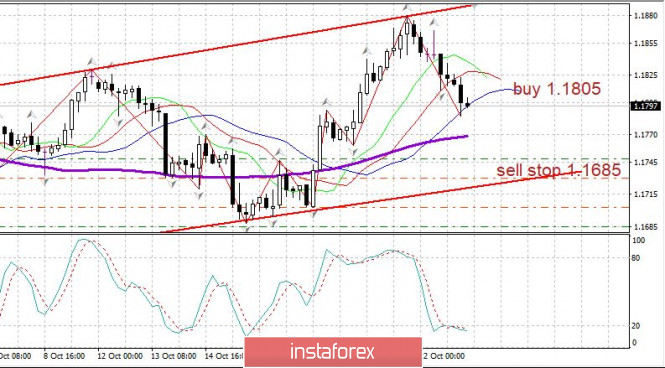
EUR/USD - The euro declined slightly after demand for the dollar increased amid strong reports on the US labor market. Set up long positions from 1.1710-1.1750 to 1.1700 1.700 is a support level for the euro, however, it's still unclear whether it will be strong enough to withstand pressure from the bears. Good luck! GBP/USD: plan for the European session on October 23. COT reports. Pound buyers not in a rush to return to the market, will protect support at 1.3035 2020-10-23 To open long positions on GBP/USD, you need: A rather excellent signal for selling the pound appeared yesterday morning. If you look at the 5-minute chart, you will see a false breakout at 1.3143, which led to producing a good entry point to short positions, afterwards the pair returned to support at 1.3096. There was a rather serious struggle for this level in the afternoon. Settling at 1.3096 caused the pound to slightly increase, but then the bears took the market under their control. Several tests of the 1.3096 level became a clear signal to open new short positions in order to sustain the downward correction. I marked all entry points on the chart. 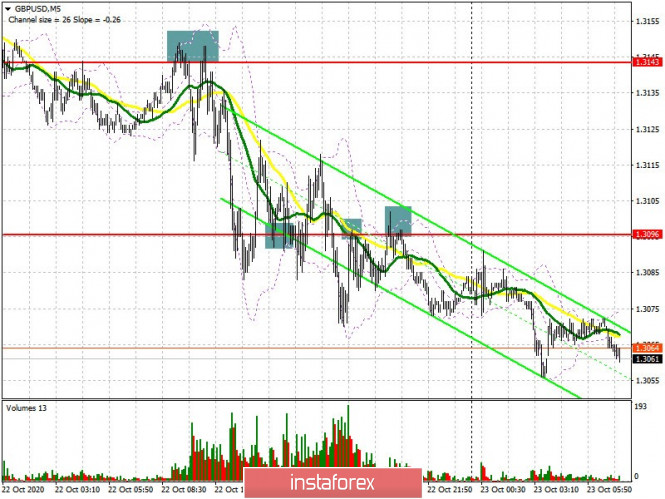 The bulls have the main task of forming a breakout and settling above the resistance of 1.3096 in the first half of the day, which they missed yesterday. Testing this level from top to bottom forms a good signal to open long positions in order for the British pound to rise to the high of 1.3143. The next target will be resistance at 1.3192, which is where I recommend taking profit, since it is unlikely for the price to go beyond the 32nd figure today. The bull market can only progress further if we receive specific news about what kind of concessions the UK is willing to make in the talks. A more optimal scenario for opening long positions would be a downward correction of the GBP/USD pair to the support area of 1.3035. You can buy the pound there on a rebound counting on a correction of 15-20 points. If there is no activity at this level, it is best to abandon buy positions until the 1.2977 low has been updated, testing it would jeopardize the pound's upward trend that was observed since the beginning of this week. The Commitment of Traders (COT) reports for October 13 showed that both long and short non-commercial positions have decreased. Long non-commercial positions declined from 40,698 to 36,195. At the same time, short non-commercial positions significantly dropped from 51,996 to 45,997. As a result, the negative value of the non-commercial net position slightly increased to -9 802 , against -11,298 a week earlier, which indicates that sellers of the British pound retain control and also shows their slight advantage in the current situation. To open short positions on GBP/USD, you need: Pound sellers are recovering from yesterday's rally. At the moment, they are aiming for support at 1.3035, settling below it forms a good signal to open short positions in order to sustain the current downward trend, while also anticipating for the pound to return to a low of 1.2977, which is where I recommend taking profits. In case the pound rises after the release of reports on activity in the manufacturing sector and services in the UK, I advise you not to rush to sell, but wait until a false breakout forms in the resistance area of 1.3096 and then you can sell the pound there. In case bears are not active at this level, you can safely open short positions on a rebound from resistance 1.3143, counting on a correction of 30-40 points within the day. 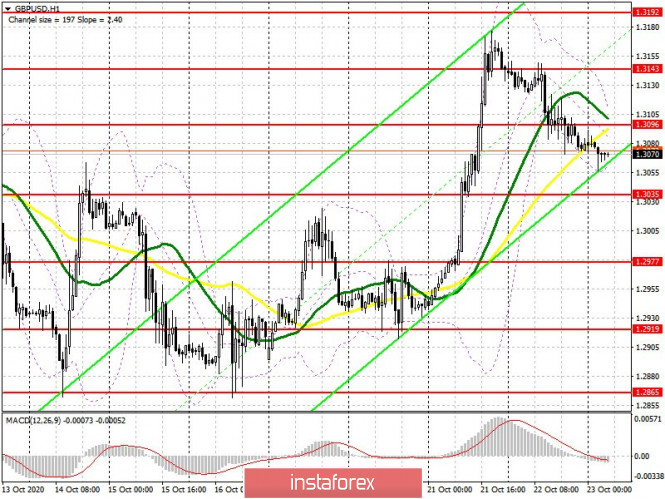 Indicator signals: Moving averages Trading is carried out below 30 and 50 moving averages, which indicates that the pressure on the pair remains. Note: The period and prices of moving averages are considered by the author on the H1 hourly chart and differs from the general definition of the classic daily moving averages on the D1 daily chart. Bollinger Bands In case the pound rises, the upper border of the indicator at 1.3110 will act as a resistance. Description of indicators - Moving average (moving average, determines the current trend by smoothing out volatility and noise). Period 50. It is marked in yellow on the chart.
- Moving average (moving average, determines the current trend by smoothing out volatility and noise). Period 30. It is marked in green on the chart.
- MACD indicator (Moving Average Convergence/Divergence — convergence/divergence of moving averages) Quick EMA period 12. Slow EMA period to 26. SMA period 9
- Bollinger Bands (Bollinger Bands). Period 20
- Non-commercial speculative traders, such as individual traders, hedge funds, and large institutions that use the futures market for speculative purposes and meet certain requirements.
- Long non-commercial positions represent the total long open position of non-commercial traders.
- Short non-commercial positions represent the total short open position of non-commercial traders.
- Total non-commercial net position is the difference between short and long positions of non-commercial traders.
Analytics and trading signals for beginners. How to trade EUR/USD on October 23? Plan for opening and closing trades on Friday 2020-10-23 Hourly chart of the EUR/USD pair 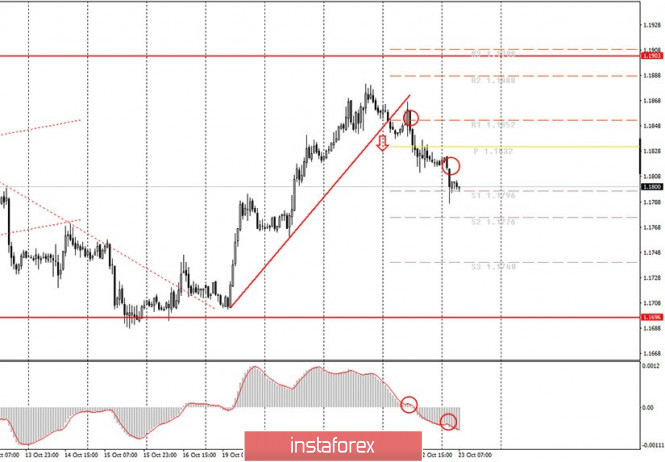 The EUR/USD pair continued to move down last Thursday night after the quotes settled below the upward trend line. Over the past day, novice traders received two sell signals at their disposal, and our fears that the upward movement would resume and the trend line would have to be rebuilt did not come true. The pair, as we warned, fell to the 1.1900 level, which was the upper line of the horizontal channel for a long time and also seems to be a strong resistance. Thus, the quotes of the pair remain in the same horizontal channel of 1.17-1.19. At first they fought off its lower border, now they turned around near the upper one. This means that flat remains in the long term. Let's go back to signals. The first signal could and should have been reached, since the MACD indicator moved near the zero level, as it should be. Traders could get around 30 points of profit on this signal. The second sell signal was weaker, since it was not preceded by a correction round, and the MACD indicator failed to discharge normally. Moreover, the euro fell and it happened on this night, that is, at a time when most of the market participants are still sleeping. Thus, the second signal did not need to be processed. Now, since the trend has changed to a downward one, you need to wait for a new sell signal from MACD and, accordingly, a correction round. The fundamental background for the EUR/USD pair was completely empty yesterday. The only macroeconomic report - claims for unemployment benefits - turned out to be in favor of the US dollar, as it showed a rather noticeable decrease in their total number. This means that the unemployment rate continues to decline in America. However, this report did not affect the course of trading in any way, and no other statistics were published that day. Also, there were no important speeches from the European Union and the United States. But that night, the last round of televised debates between Donald Trump and Joseph Biden took place and as a result, the quotes fell by 30 points. However, the fall did not last long, which means that there was nothing extraordinary in the debate. The European Union and Germany will release business activity indices in the manufacturing and services sectors on Friday, October 23. According to experts, all indicators may deteriorate in October, which is not surprising, given the scale of the second wave of the coronavirus epidemic in the EU. If forecasts come true, then the US dollar may rise by several dozen points. Similar indexes of business activity will be published today in America. We are still leaning towards the correctional scenario for Friday. Although, in general, we expect the quotes to fall to the lower border of the horizontal channel at 1.1700. Possible scenarios for October 23: 1) Buy positions on the EUR/USD pair have ceased to be relevant at the moment, since the price has settled below the rising trend line. Thus, novice traders are advised to resume bull trading after forming a new upward trend or the refraction of a downward trend, which is not expected during the day. 2) Novice traders are advised to continue trading down, but now it is necessary that the pair slightly correct and the MACD indicator is discharged. After doing so we can finally recommend waiting for a new sell signal from MACD and then you can open short positions while aiming for 1.1776 and 1.1740. The price correction may take some time. On the chart: Support and Resistance Levels are the Levels that serve as targets when buying or selling the pair. You can place Take Profit near these levels. Red lines are the channels or trend lines that display the current trend and show in which direction it is better to trade now. Up/down arrows show where you should sell or buy after reaching or breaking through particular levels. The MACD indicator (14,22,3) consists of a histogram and a signal line. When they cross, this is a signal to enter the market. It is recommended to use this indicator in combination with trend lines (channels and trend lines). Important announcements and economic reports that you can always find in the news calendar can seriously influence the trajectory of a currency pair. Therefore, at the time of their release, we recommended trading as carefully as possible or exit the market in order to avoid a sharp price reversal. Beginners on Forex should remember that not every single trade has to be profitable. The development of a clear strategy and money management are the key to success in trading over a long period of time. Brief trading recommendations for GBP/USD on 10/23/20 2020-10-23 
The GBP/USD pair became overbought after an active growth last October 21, which resulted in a technical correction and led to the consolidation of buy deals. Overbought happens in the market after a strong upward movement, which has led to a significant change in quotes. Taking a closer look at the dynamics on October 21, you will see that the value of the pound strengthened by 239 points, which is considered very fast and a lot. This led to an overbought status and a corrective movement. Regarding the quote's current location, you can see that market participants have already managed to pull back the pound's rate below 1.3080, which indicates the prevailing downward interest in the market. Here, trading forecasts can be drawn from a number of possible market development scenarios. First scenario: Continuation of the correction The quote is holding below 1.3080, which was followed by the formation of a corrective move in the direction of the main support level of 1.3000. Second scenario: Market goes into a side fluctuation mode The correction is already completed, but the upward move does not return in the market, which leads to a variable turn in the sideways move. So, the values of 1.3000//1.3080 can serve as the fluctuation limits. 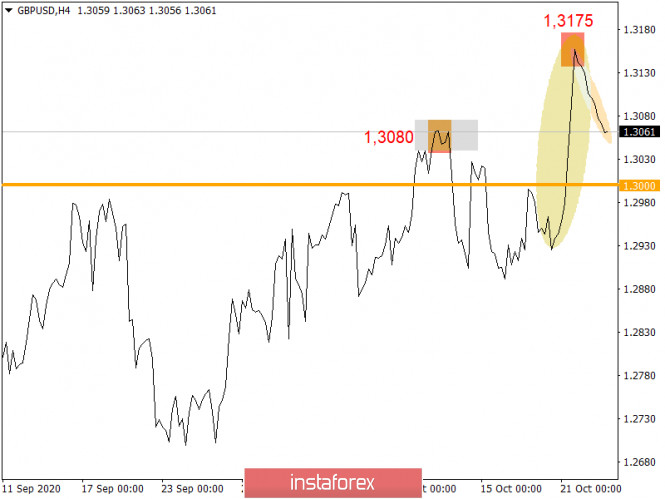
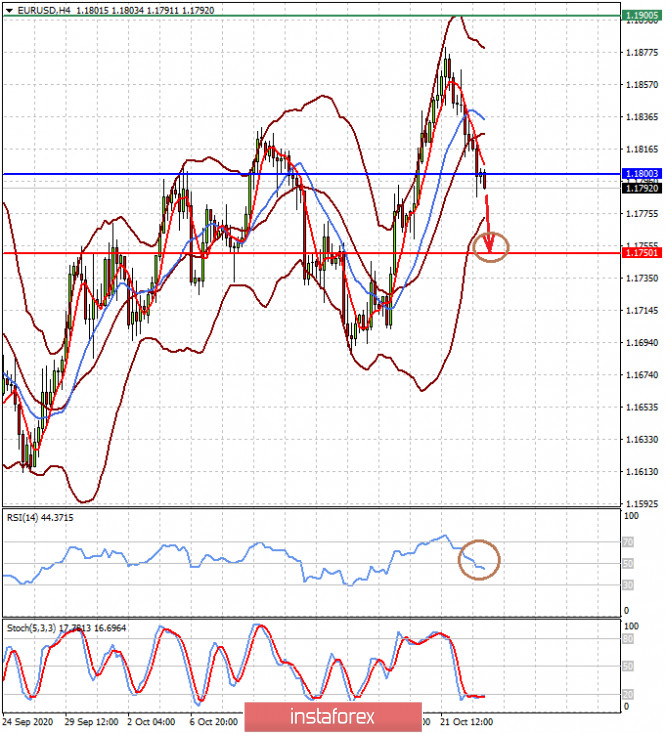
Indicator Analysis. Daily review for EUR/USD 10/23/20 2020-10-23 Trend Analysis (Fig. 1). Today, the market may continue to move downward from the level of 1.1820 (closing of yesterday's daily candle) with the target at 1.1780 - the retracement level of 38.2% (blue dotted line). In case of testing this level, there will be a work going down to the level of 1.1748 - the 50% retracement level (blue dashed line).  Figure: 1 (daily chart). Comprehensive Analysis: - Indicator Analysis - down
- Fibonacci Levels - down
- Volumes - down
- Candlestick Analysis - down
- Trend Analysis - up
- Bollinger Lines - down
- Weekly Chart - up
General conclusion: Today, the price from the level of 1.1820 (closing of yesterday's daily candle) may continue to move downward with the target of 1.1780 - the retracement level of 38.2% (blue dashed line). In case of testing this level, there will be a work going down to the level of 1.1748 - the 50% retracement level (blue dashed line). Then top work is possible. Alternative scenario: from the level of 1.1820 (closing of yesterday's daily candle) may continue to move down with the target at 1.1780 - a retracement level of 38.2% (blue dashed line). In case of testing this level, there will be a work going up to the level of 1.1860 - the retracement level of 61.8% (red dashed line). Why does gold's only prospect is its price decline? 2020-10-23 It was assumed last September that gold's price is unlikely to reach $ 2,000 per ounce in the near future. Why is this not happening in the wake of the fundamental weakness of the US dollar, which is overhung by a mass of various programs to stimulate the US economy, extremely low interest rates and the expectation of additional comprehensive support measures that markets await either before the presidential election on November 3, or after them? On another note, what is the main reason for the lack of widespread interest in the gold as a hedging tool for financial risks? We believe that it is due to its equilibrium price in dollars, or rather, the ratio to the dollar exchange rate, considering the incentive measures that would probably still be in place. Nevertheless, gold is worth exactly as much, as the dollar is weak. So why don't they buy it? Is it because there are a lot of problems in the global economy and uncertainty about the prospects for its development in view of COVID-19? Perhaps, gold does not generate interest income like bonds or company stocks (dividends). There is no sense to buy it now, as the world economy in general and the economies of developed countries are already at extremely low levels. Moreover, they have nowhere to decline, since there is already a collapse with military conflicts and other related problems. Investors, on the contrary, believe that global economic recovery will be accompanied by the strongest demand for shares of companies in the context of massive stimulus measures in the world due to the flooding of the financial system with extremely "cheap" dollars, euros, yens, pound, etc., which were pumped by the world Central Banks – the Fed, the ECB and the like. Markets expect the start of mass production of vaccines for COVID-19, reasonably believing that they will allow the global economy to start actively growing. However, it is really difficult to predict when it will be produced in the West. If the vaccines will be successful, it will expand its purchase around the world, which will initiate the stabilization of COVID-19 and the start of the growth of the world economy. To sum it up, we believe that gold has no prospects to rise, not only to the $ 2,000 per ounce mark, but higher. Moreover, a further price decline can be expected approximately to the levels that preceded the outbreak of the COVID-19 pandemic this year. Forecast of the day: Spot gold is trading in a sideways range. We consider it possible to sell it at any small growth with a likely local target of 1887.50 The EUR/USD pair is under pressure due to a number of negative factors – COVID-19 situation in Europe, Brexit issue, and the high uncertainty of who will win the US presidential election. Thus, we believe that the pair will continue to decline to 1.1750, while remaining below the level of 1.1800. 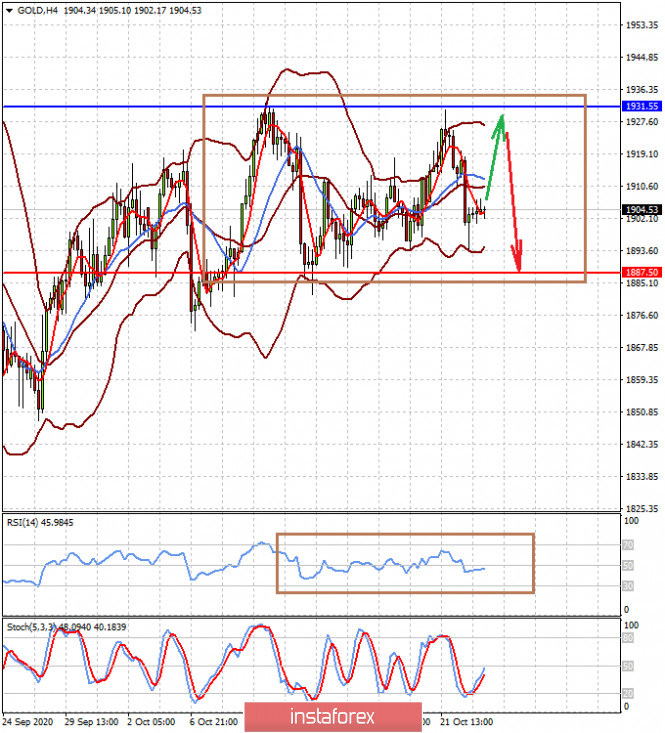
EUR/USD and GBP/USD: US presidential candidates faced-off in a final debate. Meanwhile, demand for the euro and the pound is declining. 2020-10-23 Presidential candidates in the United States faced off another debate yesterday, which turned out calmer and very different from the ones that occurred earlier. The more confident position of Donald Trump returned the demand for the US dollar, and raised it up slightly against other currencies such as the euro and the pound.  At the debate, Donald Trump and Joe Biden offered completely different views on the fight against the coronavirus pandemic, which, of course, was not in favor of the current US president. Trump continued to downplay the severity of the crisis, all while increasing emphasis on a vaccine that is not clear yet when it will be invented. He also gave rosy assessments on the trajectory of the pandemic, even though cases in the US are again rising. As for Biden, he acknowledged the grim losses from the coronavirus pandemic and warned the people that they must prepare for a more difficult period because another pandemic wave could strike again. Another hot topic during the debate was family business and financial issues, on which Trump again made unfounded statements against Biden's son. Biden defended his family with all his might and categorically denied the accusations, all while trying to bring the conversation back to politics. Both candidates were also asked to talk directly about racism in America, to which Biden said bluntly that institutional racism exists, so tackling racial inequality will be a priority on his administration and his presidential agenda. Trump, meanwhile, continued to bend his line, claiming that he has done more for African Americans than any president since Abraham Lincoln. Needless to say, Joe Biden is undeniably gaining more and more upper hand against Donald Trump as the election day nears, which limits the upward potential of the US dollar against a number of risky assets. 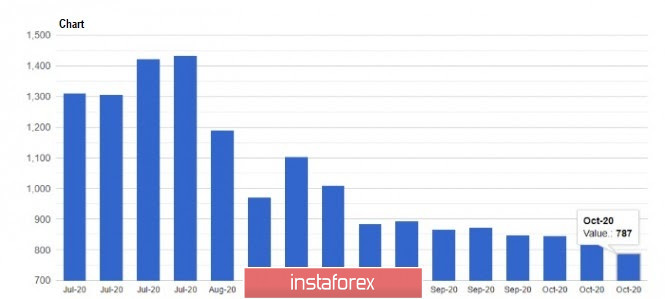 With regards to economic statistics, one of the data that provided significant support to the US dollar is the report on the US labor market, which, according to the record of the US Department of Labor, improved in terms of jobless claims in the country. The latest data said that initial applications fell by 55,000 and to 787,000 for the week of October 11 to 17. The report on leading indicators, which was published by the Conference Board, also had a positive impact on the US dollar, especially since the index increased by 0.7% and to 107.2 points in September, while economists had expected it to rise by only 0.6 %. 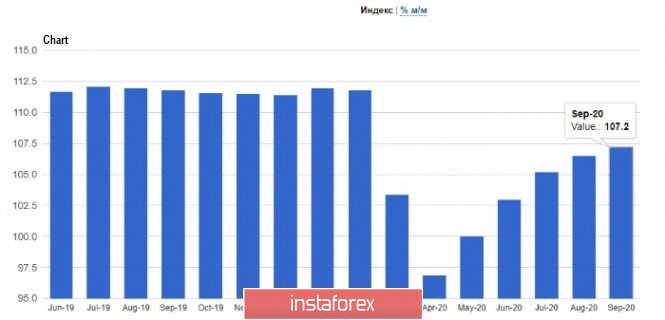 The situation in the US housing market has also improved amid the availability of credit and almost zero interest rates. Thus, in the latest report of the National Association of Realtors, home sales jumped to a record high in September, increasing by 9.4% compared to the previous month. It currently amounts to 6.54 million homes per year. Meanwhile, if compared to the same period last year, sales increased by 20.9%. 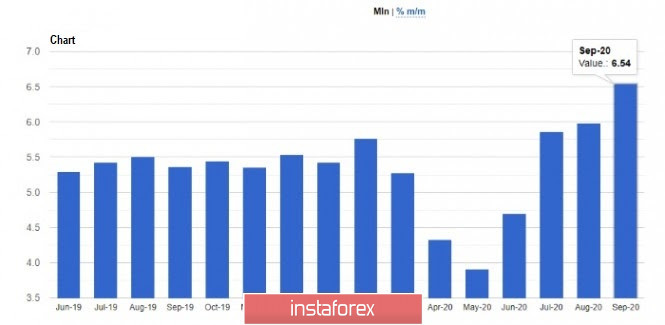 As for the technical picture of the EUR / USD pair, demand for the euro may decline further if the data on the eurozone's manufacturing and services sectors come out bad or worse than economists' forecast. For example, the composite PMI runs the risk of falling below 50 points, which will stall the pace of economic growth in mid-autumn this year, which is a bad news for the euro. If the indicators really turn out bad, the euro will definitely decline, in which it may break out of yesterday's lows (1.1790) and move further down towards the levels 1.1740 and 1.1685. The price will have a chance to move up only if the data exceeds the forecasts. Demand, meanwhile, will only resume after a breakout from the resistance level of 1.1815, and such will make it easier for the bulls to bring the quote up to the weekly high (1.1875). GBP / USD Brexit is again adding pressure on the British pound, especially since the rumors that the UK is ready to make concessions on the trade deal remained just a talk, thereby cooling the ardor of speculative buyers of the pound. To add to that, the recently published data on UK consumer confidence indicated a decrease in October this year, which is not good both for the economy and the British pound. The report of GfK said the figure fell to -31 points from -25 points a month earlier, while economists had expected it to be -27 points. The main reason for this decline is the massive increase of COVID-19 incidence across the country, as well as on the new measures of restrictions. 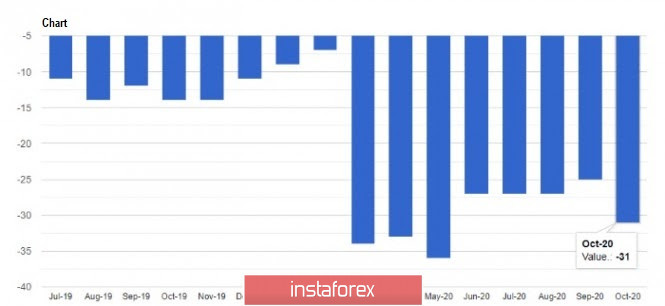 So, for the technical picture of the GBP/USD pair, major support is now seen around the level of 1.3035, however, it is hard to say if the bulls will actively defend it. Most likely, active positions will be set up on the support level of 1.2980, but if the bulls want to return the pair to a bull market, they have to make sure that the quote breaks above the resistance level of 1.3100. Only by this will the pound have a chance to reach a high of 1.3150.
Author's today's articles: Sebastian Seliga  Sebastian Seliga was born on 13th Oсtober 1978 in Poland. He graduated in 2005 with MA in Social Psychology. He has worked for leading financial companies in Poland where he actively traded on NYSE, AMEX and NASDAQ exchanges. Sebastian started Forex trading in 2009 and mastered Elliott Wave Principle approach to the markets by developing and implementing his own trading strategies of Forex analysis. Since 2012, he has been writing analitical reviews based on EWP for blogs and for Forex websites and forums. He has developed several on-line projects devoted to Forex trading and investments. He is interested in slow cooking, stand-up comedy, guitar playing, reading and swimming. "Every battle is won before it is ever fought", Sun Tzu Sebastian Seliga was born on 13th Oсtober 1978 in Poland. He graduated in 2005 with MA in Social Psychology. He has worked for leading financial companies in Poland where he actively traded on NYSE, AMEX and NASDAQ exchanges. Sebastian started Forex trading in 2009 and mastered Elliott Wave Principle approach to the markets by developing and implementing his own trading strategies of Forex analysis. Since 2012, he has been writing analitical reviews based on EWP for blogs and for Forex websites and forums. He has developed several on-line projects devoted to Forex trading and investments. He is interested in slow cooking, stand-up comedy, guitar playing, reading and swimming. "Every battle is won before it is ever fought", Sun Tzu Irina Manzenko  Irina Manzenko Irina Manzenko Mihail Makarov  - - Maxim Magdalinin  In 2005 graduated from the Academy of the Ministry of Internal Affairs of the Republic of Belarus, law faculty. Worked as a lawyer for three years in one of the biggest country's company. Besides the trading, he develops trading systems, writes articles and analytical reviews. Works at stock and commodity markets explorations. On Forex since 2006. In 2005 graduated from the Academy of the Ministry of Internal Affairs of the Republic of Belarus, law faculty. Worked as a lawyer for three years in one of the biggest country's company. Besides the trading, he develops trading systems, writes articles and analytical reviews. Works at stock and commodity markets explorations. On Forex since 2006. Stanislav Polyanskiy  Graduated from Odessa State Economic University. On Forex since 2006. Writes analytical reviews about international financial markets for more than 3 years. Worked as a currency analyst in different finance companies for a long time including the biggest companies of Russia and Ukraine. Graduated from Odessa State Economic University. On Forex since 2006. Writes analytical reviews about international financial markets for more than 3 years. Worked as a currency analyst in different finance companies for a long time including the biggest companies of Russia and Ukraine. Vladislav Tukhmenev  Vladislav graduated from Moscow State University of Technologiy and Management. He entered the forex market in early 2008. Vladislav is a professional trader, analyst, and manager. He applies a whole gamut of analysis – technical, graphical, mathematical, fundamental, and candlestick analysis. Moreover, he forecasts the market movements using his own methods based on the chaos theory. Vladimir took part in development of trading systems devoted to fractal analysis. In his free time, Vladimir blogs about exchange markets. Hobbies: active leisure, sporting shooting, cars, design, and marketing. "I do not dream only of becoming the best in my field. I also dream about those who I will take with me along the way up." Vladislav graduated from Moscow State University of Technologiy and Management. He entered the forex market in early 2008. Vladislav is a professional trader, analyst, and manager. He applies a whole gamut of analysis – technical, graphical, mathematical, fundamental, and candlestick analysis. Moreover, he forecasts the market movements using his own methods based on the chaos theory. Vladimir took part in development of trading systems devoted to fractal analysis. In his free time, Vladimir blogs about exchange markets. Hobbies: active leisure, sporting shooting, cars, design, and marketing. "I do not dream only of becoming the best in my field. I also dream about those who I will take with me along the way up." Sergey Belyaev  Born December 1, 1955. In 1993 graduated from Air Force Engineering Academy. In September 1999 started to study Forex markets. Since 2002 has been reading lectures on the technical analysis . Is fond of research work. Created a personal trading system based on the indicator analysis. Authored the book on technical analysis "Calculation of the next candlestick". At present the next book is being prepared for publishing "Indicator Analysis of Forex Market. Trading System Encyclopedia". Has created eleven courses on indicator analysis. Uses classical indicators. Works as a public lecturer. Held numerous seminars and workshops presented at international exhibitions of financial markets industry. Is known as one of the best specialists in the Russian Federation researching indicator analysis. Born December 1, 1955. In 1993 graduated from Air Force Engineering Academy. In September 1999 started to study Forex markets. Since 2002 has been reading lectures on the technical analysis . Is fond of research work. Created a personal trading system based on the indicator analysis. Authored the book on technical analysis "Calculation of the next candlestick". At present the next book is being prepared for publishing "Indicator Analysis of Forex Market. Trading System Encyclopedia". Has created eleven courses on indicator analysis. Uses classical indicators. Works as a public lecturer. Held numerous seminars and workshops presented at international exhibitions of financial markets industry. Is known as one of the best specialists in the Russian Federation researching indicator analysis. Viktor Vasilevsky  Viktor Vasilevskiy is a practicing trader, analyst, and teacher. He has been studying financial markets professionally since 2005. Since then, he has gained wide experience of forecasting the movements of currency exchange rates on economic statistics and analysis of reasons and consequences of the world's political events. He focuses on the dynamics of government bonds, situation on the stock markets of developed countries as well as general market sentiment. Viktor Vasilevskiy is a practicing trader, analyst, and teacher. He has been studying financial markets professionally since 2005. Since then, he has gained wide experience of forecasting the movements of currency exchange rates on economic statistics and analysis of reasons and consequences of the world's political events. He focuses on the dynamics of government bonds, situation on the stock markets of developed countries as well as general market sentiment. Pavel Vlasov  No data No data
Subscription's options management Theme's:
Fundamental analysis, Fractal analysis, Wave analysis, Technical analysis, Stock Markets
Author's :
A Zotova, Aleksey Almazov, Alexander Dneprovskiy, Alexandr Davidov, Alexandros Yfantis, Andrey Shevchenko, Arief Makmur, Dean Leo, Evgeny Klimov, Fedor Pavlov, Grigory Sokolov, I Belozerov, Igor Kovalyov, Irina Manzenko, Ivan Aleksandrov, l Kolesnikova, Maxim Magdalinin, Mihail Makarov, Mohamed Samy, Mourad El Keddani, Oleg Khmelevskiy, Oscar Ton, Pavel Vlasov, Petar Jacimovic, R Agafonov, S Doronina, Sebastian Seliga, Sergey Belyaev, Sergey Mityukov, Stanislav Polyanskiy, T Strelkova, Torben Melsted, V Isakov, Viktor Vasilevsky, Vladislav Tukhmenev, Vyacheslav Ognev, Yuriy Zaycev, Zhizhko Nadezhda
Edit data of subscription settings
Unsubscribe from the mailing list Sincerely,
Analysts Service | If you have any questions, you can make a phone call using one of the
InstaForex Toll free numbers right now:
|  | InstaForex Group is an international brand providing online trading services to the clients all over the world. InstaForex Group members include regulated companies in Europe, Russia and British Virgin Islands. This letter may contain personal information for access to your InstaForex trading account, so for the purpose of safety it is recommended to delete this data from the history. If you have received this letter by mistake, please contact InstaForex Customer Relations Department. |


No comments:
Post a Comment