| The fall of EUR/USD stopped again at the banking support zone 2020-11-03 The probability of growth from current levels is increasing significantly due to the fact that the support zone formed by bank liquidity was tested. It is important to note that the pair fell by 1%, indicating the impulsive nature of the bearish movement. The first growth target is the start point of operations on the open market ECB 1.1765. The possibility of closing today's trading above this level is below 10%, which indicates the need to consider the further decline in the second half of this week as the main one. 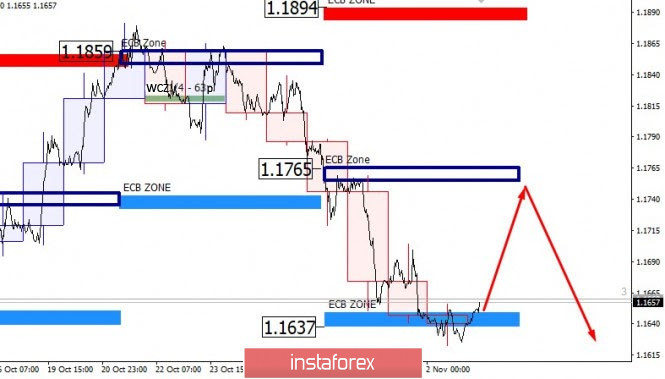 This is the second week that leads to a decrease from the level of bank opening of trading. The European Central Bank supports the pair's decline and makes it possible to continue working in a downward direction. Working towards a corrective movement to return to the banking level of 1.1765 is possible. However, it is necessary to understand that a new zone will appear tomorrow, which may become a resistance. For this reason, purchases must be converted to breakeven and attention must be on tomorrow's formation of the reference point. Elliott wave analysis of EUR/JPY for November 3, 2020 2020-11-03 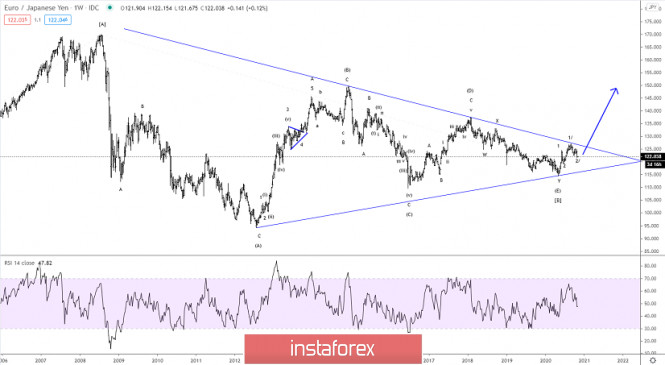
Without much action overnight, we think that it might be wise to take a step back and look at the larger picture. In April 2020 we concluded that wave (E) of the huge multi-year [B]-wave triangle bottom and a new long-term impulse rally in wave [C] has begun. We are still in the early days of this new impulsive [C] that ultimately should move above the peak of wave [A] at 169.97. To confirm this scenario the pair needs to break clearly above the triangle-resistance line near 127.07. A break above here calls for much more upside pressure with resistance at 137.50 as the first major target. As long as the pair remains locked inside the triangle almost everything can happen as wave (E) can turn into a mini-triangle itself within the boundaries of the larger triangle. It is not our favorite count but at this point, it still cannot be excluded. R3: 129.68 R2: 127.07 R1: 125.16 Pivot: 122.62 S1: 121.62 S2: 119.12 S3: 116.60 We are long EUR from 122.25 with our stop placed at 121.60 Trading plan for the EUR/USD pair on November 3. COVID-19 and the US presidential elections. 2020-11-03 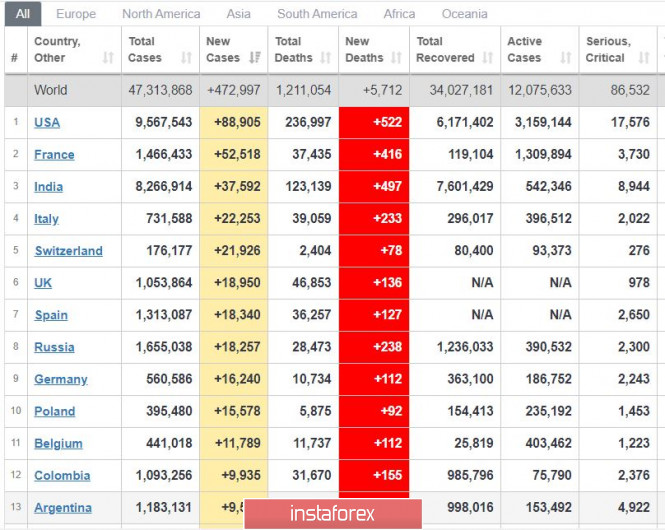
As of Tuesday morning, the United States has again recorded near record highs of new COVID-19 cases, same with Europe, which continues to see a high incidence rate in many countries. Latest data indicates that France already has 52 thousand new cases a day, while 9 European countries have above 11 thousand per day. Because of this, quarantine has been reintroduced in many states, namely Britain, Germany, Austria, Switzerland and Italy. Nonetheless, many hope that this is already the peak of the second pandemic wave, or if not, approaching it already. 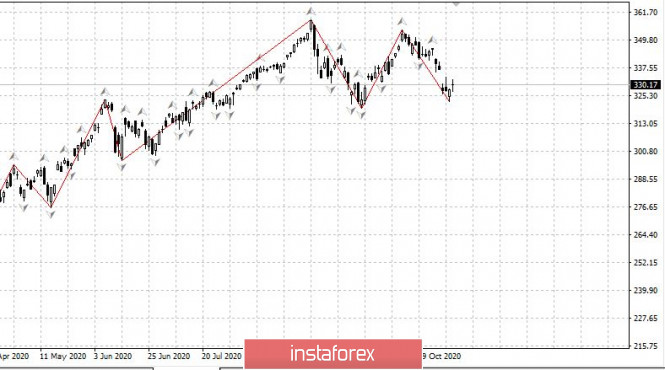
The US market is currently near two-month lows, and if Joe Biden wins the US presidential elections, the market will go down even lower. 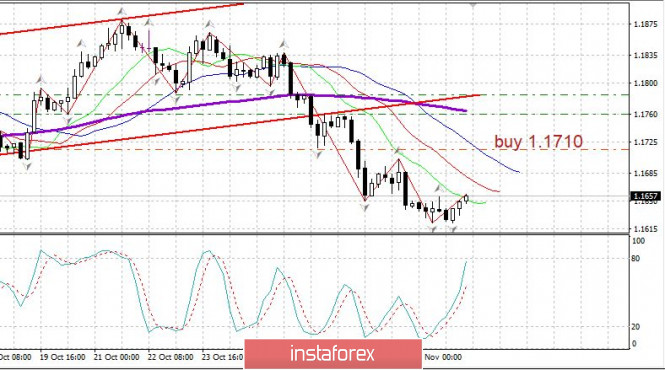
EUR/USD - The euro is in a downward trend. Long positions may be set up from 1.1710. However, a decline is more likely to happen, thus, it would be better to open short positions from the level of 1.1680. Technical Analysis of EUR/USD for November 3, 2020 2020-11-03 Technical Market Outlook: The EUR/USD pair keeps making lower lows, but recently the gulls have managed to break out of the descending channel and hit the technical resistance at the level of 1.1655. The momentum is weak and negative and the market conditions at the H4 time frame chart are extremely oversold, so please keep an eye on a temporary rebound. The nearest technical resistance is seen at the level of 1.1695. Bears are in full control of the market and the weekly outlook is bearish despite the election night in the USA. Weekly Pivot Points: WR3 - 1.1974 WR2 - 1.1916 WR1 - 1.1756 Weekly Pivot - 1.1698 WS1 - 1.1531 WS2 - 1.1471 WS3 - 1.1314 Trading Recommendations: Since the middle of March 2020 the main trend is on EUR/USD pair has been up, which can be confirmed by almost 10 weekly up candles on the weekly time frame chart and 4 monthly up candles on the monthly time frame chart. The recent correction towards the level of 1.1612 seems to be completed and now market is ready for another wave up. This means any local corrections should be used to buy the dips until the key technical support is broken. The key long-term technical support is seen at the level of 1.1445. The key long-term technical resistance is seen at the level of 1.2555. 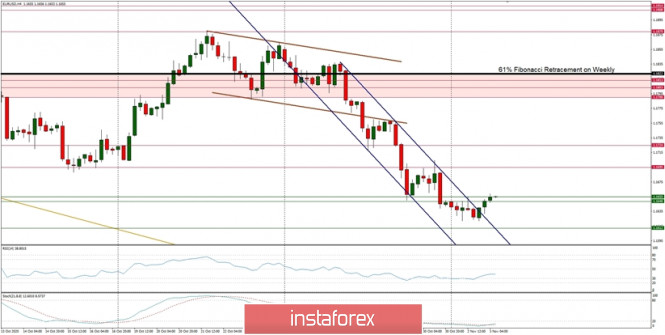
Technical Analysis of GBP/USD for November 3, 2020 2020-11-03 Technical Market Outlook: The GBP/USD pair keeps going lower in a descending channel and another lower low was made at the level of 1.2854, which is at the short-term trend line support. The candle on the H4 time frame chart that made the low looks like a Pin Bar, so the bulls are defending the trend line support. Any sustained violation of this trend line will indicate more bearish pressure that can push the prices to the level of 1.2868, 1.2848 or even 1.2816. The weak and negative momentum supports the short-term bearish outlook despite the oversold market conditions. Only a sustained breakout above the level of 1.2982 would change the intraday outlook to bullish. Weekly Pivot Points: WR3 - 1.3236 WR2 - 1.3153 WR1 - 1.3037 Weekly Pivot - 1.2956 WS1 - 1.2835 WS2 - 1.2757 WS3 - 1.2653 Trading Recommendations: The GBP/USD pair is in the down trend on the monthly time frame, but the recent bounce from the low at 1.1411 made in the middle of March 2020 looks very strong and might be a reversal swing. In order to confirm the trend change, the bulls have to break through the technical resistance seen at the level of 1.3518. All the local corrections should be used to enter a buy orders as long as the level of 1.2674 is not broken. 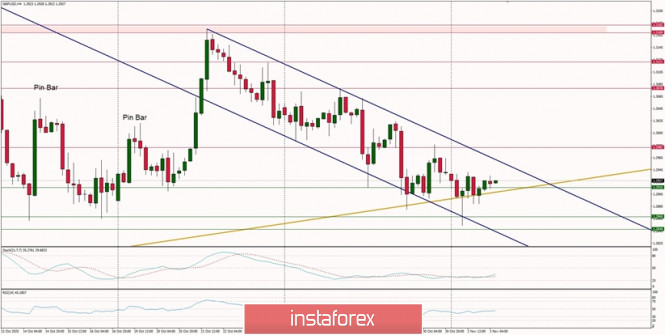
Elliott wave analysis of GBP/JPY for November 3, 2020 2020-11-03 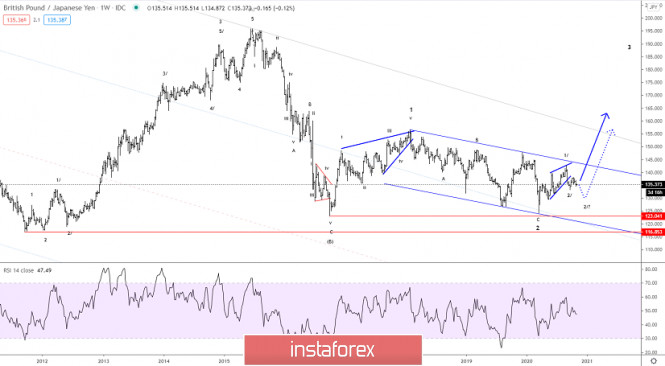
After an uneventful overnight trading session, today we are expecting more clear shifts. Contrary to EUR/JPY, the trajectory of GBP/JPY is difficult to forecast. The options remain multiple. Our preferred count shows that GBP/JPY completed a larger corrective decline in March with the dip to 124.09 and has started a new impulsive rally towards at least 157.65 and the longer-term closer to the 2015 peak at 195.88. We need a clear break above the wave 1/ peak at 142.72 to confirm that wave 3/ higher is in motion towards at least 147.49 on the way higher towards 157.65. However, as long as minor resistance at 138.04 is able to cap the upside, we cannot exclude a larger correction in wave 2/ closer to 129.70 to complete the corrective wave 2/. R3: 148.18 R2: 142.72 R1: 138.04 Pivot: 133.05 S1: 129.70 S2: 126.55 S3: 124.09 - Can't be broken or we will be forced to a recount of our long-term scenario Trading plan for EUR/USD and GBP/USD on 11/03/20 2020-11-03 Yesterday, some macroeconomic data was published. In particular, the final indexes of business activity in the manufacturing sectors of Europe, Great Britain and the United States. However, the market did not react to this, since their only focus is today's US presidential elections. In this regard, the single European currency has been standing still throughout the day. The pound, in turn, showed a sharp decline, but then changed its mind and entirely recovered all its losses and is now waiting for the elections. This decline was nothing more than a reaction to the announcement of the re-introduction of full-scale quarantine. But this is not surprising, as Germany and France had introduced similar measures before. The fact that other European countries would follow their example did not raise any questions. In general, the markets are in their starting positions, preparing for a sharp surge. However, the question is where will it be? Up or down? From the viewpoint of common logic, Donald Trump's victory can be perceived extremely positively. The fact is that during the election race, both candidates enthusiastically accused each other of corruption, working for all imaginable and inconceivable foreign intelligence services, and the like. As a result, economic issues were not discussed, even though these are very important. Thus, it turned out that investors and big business have no idea what the economic policy of Mr. Biden will be. In contrast, everything is clear with Mr. Trump, since he will pursue the same policy, which has proven itself well. If you forget about such force majeure, like COVID-19 under Trump, the US economy was doing well – the 2019 unemployment rate back was at its lowest ever value and the industry showed steady growth. In fact, many companies did gradually bring production back to the United States. As mentioned earlier, we don't know what will happen if J. Biden wins. This uncertainty scares investors. Nevertheless, all the most interesting things will happen after the closing of the US session. The first results will be announced only after the poll stations will be closed, so markets will stand still today. 
The EUR/USD pair found a variable pivot point within the level of 1.1620, where it slowed down the decline and formed a stagnation at 1.1620/1.1660. We can assume that the quote will continue to fluctuate in a narrow range, which will eventually lead to a speculative surge in activity against a strong information background. 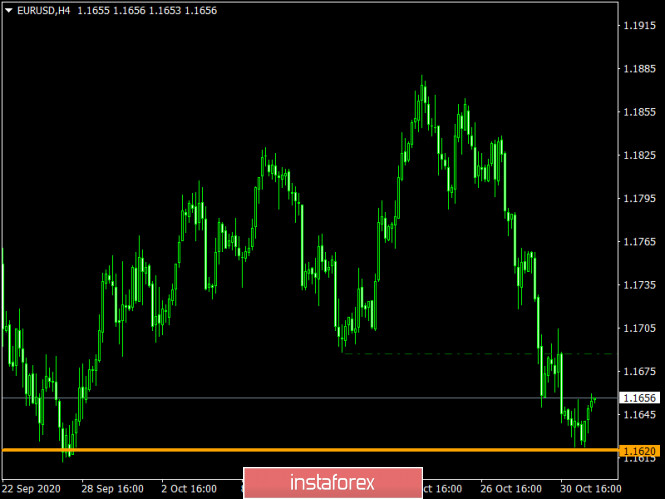
The GBP/USD pair naturally found a pivot point, that is, to the support level of 1.2860, where there was a stop, followed by a correction. We can assume that the correction course will be replaced by a variable oscillation, where the coordinates 1.2880/1.2940 will be used as the amplitude boundaries. 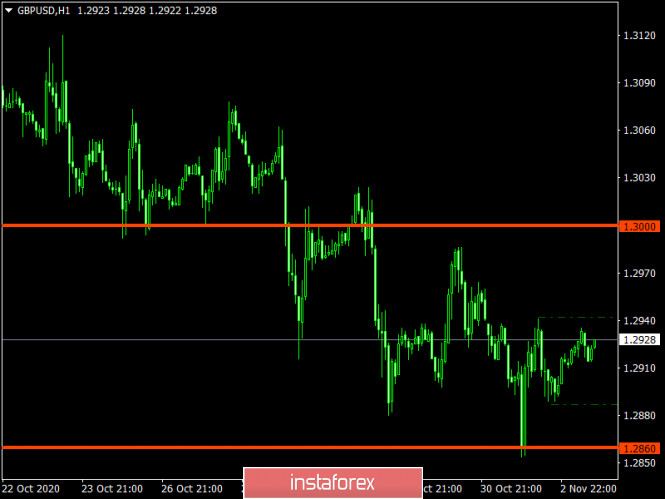
AUD/USD: Australian dollar was not scared of RBA's dovish meeting 2020-11-03 The RBA meeting was held today. They lowered the interest rate to 0.1% and announced buying five and ten-year government bonds in the amount of $100 billion over the next 6 months. This decision was already expected, so the bears failed to impulsively break through the support level of 0.7000. However, the tone of the accompanying statement, as well as the contradictory rhetoric of the RBA head, Philip Lowe, did not allow the buyers of the AUD/USD pair to take control. As a result, the pair is still under background pressure. The results of the RBA's November meeting were very pessimistic. The Central Bank did not actually rule out further easing of monetary policy, although it did not directly announce the corresponding steps. However, many economists at major banks agreed that the RBA left a space for subsequent movements. At the same time, there is talk in the market that a rate cut to zero is only a matter of time, especially if the labor market does not show steady growth in the coming months. Some experts, such as Stephen Koukoulas (former economic adviser to the Australian Prime Minister and former chief economist at Citibank), are equally confident that the Central Bank will go into the negative area within a year – first to the level of -0.1%, and then to -0.4%. But, fortunately, this opinion is not yet prevailing among experts. 
At the same time, the RBA members were really worried about the latest trends in the labor market, so this issue has been in focus. It should be recalled that this concern is justified, since the growth rate in the number of employees in October reflected alarming trends. First, this indicator declined for the first time since May of this year (when the country was just coming out of full lockdown mode). Second, this decline was mainly due to a reduction in the full employment component. If the indicator of partial employment growth decreased by 9 thousand, the indicator of full employment moved into the negative zone by 20 thousand. In view of this, Philip Lowe reiterated during his press conference today that such an imbalance would negatively affect the recovery process. After all, full-time positions imply a higher level of wages and a higher level of social security, compared with temporary part-time jobs; hence, the decline in Australian's consumer activity and weak inflationary growth. Therefore, the current dynamics seriously worried the members of the Australian regulator. In an accompanying statement, they said that in order to achieve the inflation target, the rate of earnings growth must be significantly higher than the current one. As for unemployment, the Central Bank says that will remain at high levels, but it will reach the peak when approaching the 8% level. Despite RBA's dovish meeting, we should highlight the following: First, the Central Bank is ready for further steps to ease monetary policy, if necessary. Although they have not announced any clear criteria in this context, it should be clear that traders should focus on the dynamics of the labor market and inflation. Secondly, the RBA members assured the market that the interest rate will not be increased for at least the next three years. They also mentioned that the size and duration of the incentive program may be revised. In connection with this, some experts have stated that the 6-month QE period will almost certainly be extended. In addition, they stated that they are ready to buy bonds in any necessary amount to reach the target level of 3-year bond yields. Moreover, these purchases will be as a bonus, that is, an addition to the above-mentioned 100-billion-dollar asset purchase program. It is also noteworthy that the accompanying statement also contains the phrase that "the measures taken by the Central Bank will put downward pressure on the Australian dollar." However, the expectations of the Reserve Bank did not coincide with reality. The AUD slightly declined after this meeting, but did not weaken its position. Thus, it is holding out above the key support level of 0.7000. Meanwhile, the AUD/USD bears were counting on a sharp downward breakdown, which would help them consolidate within the 69th figure. 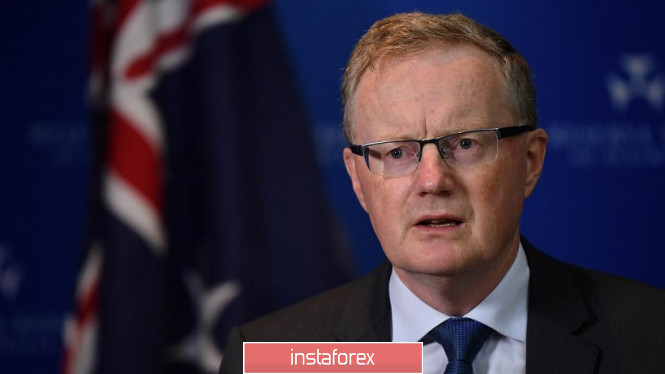
Unfortunately, this did not happen. The AUD/USD pair left the mid-70th figure area after a relatively small and short-term downward impulse. This is partly because the US dollar index is showing a downward trend today, after another upward surge yesterday. However, the main problem of the AUD/USD bears is that the RBA did not implement the worst-case scenario that was discussed before the meeting. So, according to some analysts, the Central Bank could reduce the rate to zero and announce further steps in this direction, thereby hinting at a negative zone. The minutes of the RBA's October meeting generally allowed for this scenario. However, this option was not implemented, so the Australian dollar remained above and withstood the blow from the Central Bank. The further behavior of the AUD/USD pair in the medium-term will depend solely on the behavior of the US currency, which in turn will respond to the election results and to the first statements of the main rivals. In general, long positions can be considered from the level of 0.7000. We saw that this support level was too tough for the pair's bears, even despite dollar's strengthening yesterday and the dovish results of the November RBA meeting. This suggests that the pair will attract buyers, when approaching the support level and moving to the 69th figure in the short-term. The first target of the corrective growth is 0.7120, which is the middle line of the Bollinger Bands indicator on the daily chart, coinciding with the Kijun-sen line. Indicator analysis. Daily review on GBP/USD for November 3, 2020 2020-11-03 Trend analysis (Fig. 1). Today, the market will try to continue moving up from the level of 1.2919 (closing of yesterday's daily candlestick) in order to reach the pullback level of 38.2% - 1.2982 (blue dotted line). If this level is tested, the upward movement will continue with the target of 1.3078 - the pullback level of 50.0% (blue dotted line). 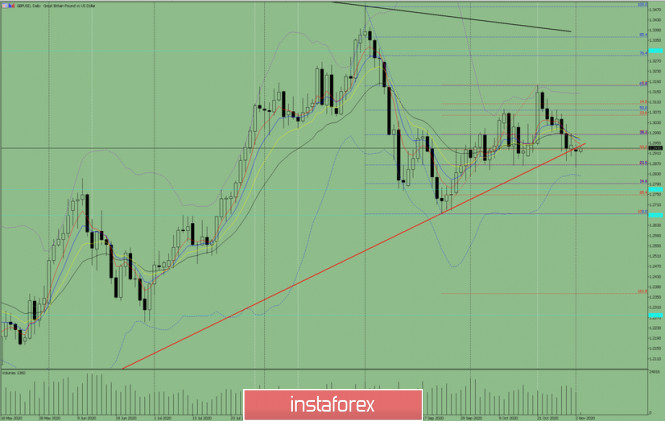
Figure 1 (Daily Chart). Comprehensive analysis: - Indicator analysis - up
- Fibonacci levels - up
- Volumes - up
- Candlestick analysis - up
- Trend analysis - down
- Bollinger bands - up
- Weekly chart - up
General conclusion: Today, the price from the level of 1.2919 (closing of yesterday's daily candlestick) will attempt to continue moving up in order to reach the pullback level of 38.2% - 1.2982 (blue dotted line). If this level is tested, the upward movement will continue with the target of 1.3078 - the pullback level of 50.0% (blue dotted line). Unlikely scenario: the price from the level of 1.3043 (closing of yesterday's daily candlestick) works up to reach the resistance line - 1.2941 (red bold line). If this line is tested, work downward to the target of 1.2867, which is a pullback level of 61.8% (red dotted line). Brief trading recommendations for the EUR/USD pair on 11/03/20 2020-11-03 
The EUR/USD pair found a pivot point yesterday within the local low (1.1612) from September 25, where the quote immediately stopped and formed a variable stagnation within the area of 1.1622/1.1660. What we have right now in the market is a natural basis with a strong uncertainty. This judgement is according to several factors. Let's consider them: From the point of view of technical analysis, there is a reduction in trading volumes, where the local low (1.1612) on September 25, acted as a support, which led to a rebound and successive slowdown. Meanwhile, in terms of fundamental analysis, the upcoming US presidential elections play an important role, where investors are taking a wait-and-see position due to a strong uncertainty in the election results. Regarding the quote's current location, the stagnation process within the variable borders of 1.1622/1.1660 can be observed, where a slight deviation of 10-15 points is allowed, but the quote will most likely remain stagnant. We can assume that the main lever for action will be the information background associated with the voting process in the United States, where the results will be known by the end of the trading day. After that, we can expect sharp price changes. At the same time, speculative fluctuations are not excluded, where technical analysis, despite variable stagnation 1.1622/1.16560 (+/- 15 p.) can act as local operations and work on the principle of breaking a particular border. 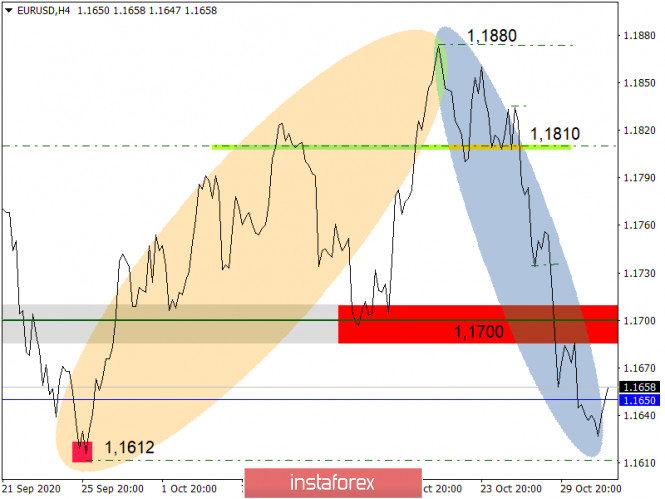
Analysis and forecast for EUR/USD on November 3, 2020 2020-11-03 In yesterday's trading, in the absence of significant macroeconomic statistics, market participants focused their attention on the presidential elections in the United States of America, which will be held today. Investors are cautious and do not want to risk operations because of the high probability that the election will be contested and the candidates will not recognize their results. Let me remind you that according to public opinion polls, the candidate from the Democratic Party of the United States, Joe Biden, has an advantage over the current head of the White House, Republican Trump. Nevertheless, knowing the obstinate nature and demeanor of the 45th US President, it is highly likely that if Biden wins, Trump will insist on fraud and urge Americans not to recognize the results of the vote. The situation is aggravated by the fact that due to the use of postal voting, the final election results may be delayed for 5-7 days. Regarding election statements, Biden promises US citizens victory over COVID-19, which is very frivolous and smacks of rotten populism. Trump at the last election speeches convinced everyone that he will win because he wins everywhere and always. Meanwhile, American gun stores are doing a brisk trade, and shopkeepers in New York and other major cities are preparing wooden shutters for their windows and storefronts in case of riots and pogroms. If we go back to the elections themselves, Trump expects to reduce the gap from his opponent Biden at the expense of undecided states. By the way, this is quite real. From an economic point of view, elections are evaluated differently. Some experts believe that Biden's victory will lead to a risky mood on global financial markets, however, this euphoria will not last long. Other economists believe that a second term for Donald Trump will carry more certainty for the world's leading economy, which is crucial. In general, the election of the American President will be a hot battle, and the markets will experience increased volatility. Against the backdrop of the US presidential election, today's data on manufacturing orders in America is likely to remain unnoticed by market participants. But the extended meeting of the Federal Reserve System (FRS), the results of which will be announced on Thursday, at 20:00 (London time), and the press conference of the head of this department, Jerome Powell, at 20:30 London time, will certainly be taken very seriously by market participants. The same can be said about the data on the US labor market, which will be published on Friday, at 14:30 (London time). Daily 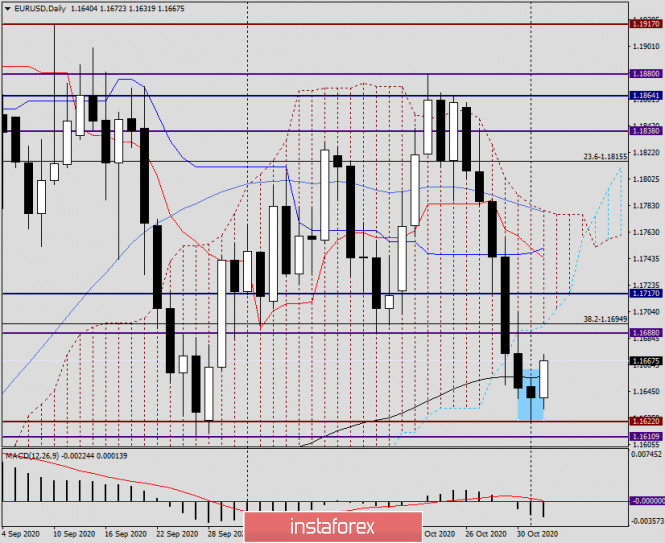
Moving on to the technical picture for the main currency pair of the Forex market, we can't help but pay attention to yesterday's candle, which formed with a long lower shadow, which touched the support around 1.1620. Most often, after the appearance of such candles, the quote increases, which is observed at the end of the article. However, in connection with the US elections, it is very difficult to assume what will be the outcome of today's auction. The reaction of market participants can be different and very unpredictable. Nevertheless, according to the technical picture, it is quite possible to assume the growth of EUR/USD, the goals of which may be the area of 1.1688-1.1717, that is, both broken support levels. If this happens, we will see a technical pullback to the previously broken levels, after which we can prepare for sales. In case of consolidation above 1.1717, the breakdown of both support levels will be considered false, and this will give grounds to expect further strengthening of the exchange rate. H1 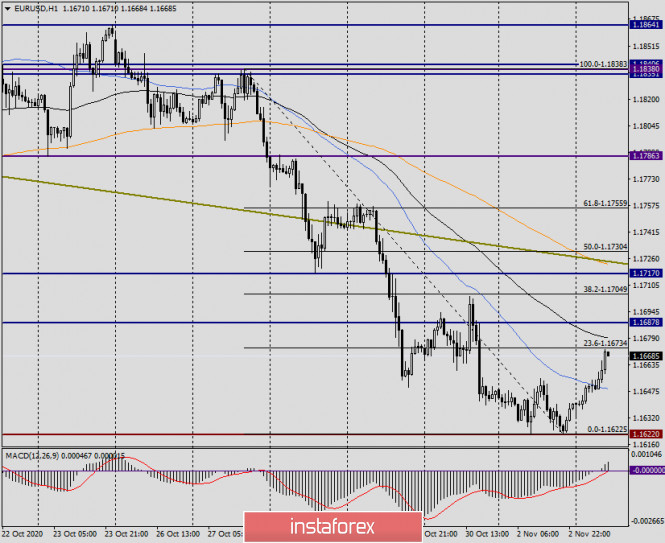
On the hourly chart, the bullish divergence of the MACD indicator was defused, but the pair have already overcome the 50 simple moving average and continues to correct. On days like today, giving specific trading recommendations is like flipping a coin. If you rely solely on the technical component, then after adjusting to the area of 1.1680-1.1720 and the appearance of reversal candle signals there, you should try to sell EUR/USD. At least this positioning is based on the current downward trend and after a rollback to the landmark level of 1.1700, which has long been strong support. GBP/USD. November 3. COT report. The Briton is also preparing for the US election and is waiting for news from Michel Barnier and David Frost 2020-11-03 GBP/USD – 1H. 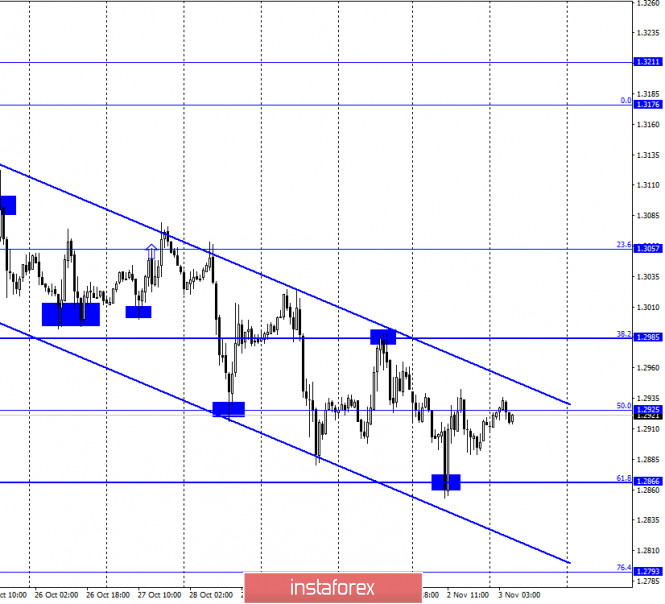
According to the hourly chart, the quotes of the GBP/USD pair fell to the corrective level of 61.8% (1.2866), rebounded from it, and rose to the upper border of the downward trend corridor. A rebound of the pair's quotes from this line will work in favor of the US currency and resume falling towards the corrective levels of 61.8% and 76.4%. However, today it is impossible to predict the movement of the pair. The pair can go several hundred points in any direction today, and the reason for this movement can only be the elections in America, which will begin in the afternoon (early in the morning in the United States). Meanwhile, the UK is completely quiet and smooth. The country has gone on a second "lockdown", thus, most British citizens stay at home and go only to the store, work or study. It is the coronavirus that is now the biggest problem for Britons, the country, and the British economy. We need to reduce the number of cases as quickly as possible to return to normal life as soon as possible (in the context of a global pandemic). So far, 24-25 thousand cases of infection continue to be recorded every day in Britain. Indicators do not decrease. As for the Brexit negotiations, which are generally unclear whether they are continuing in London or have already ended, but the heads of the negotiating groups forgot to report the results to the press, there is no information. The next stage of negotiations was supposed to end last week, however, the parties did not announce a new extension of the deadline and did not announce the end. GBP/USD – 4H. 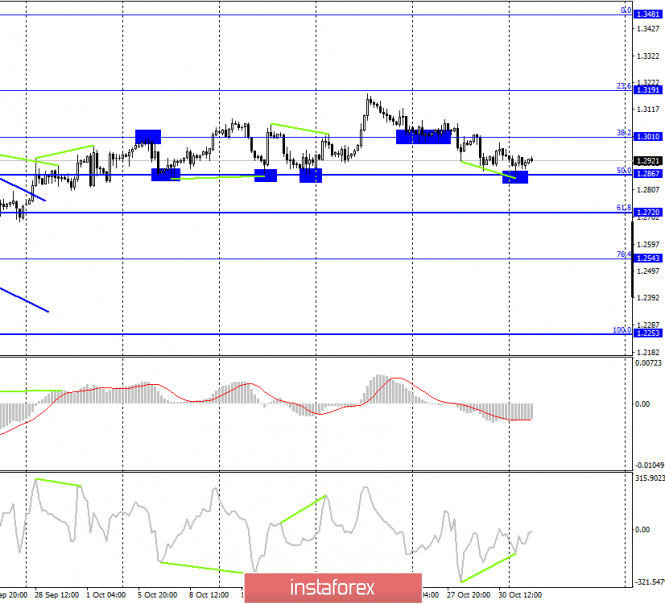
On the 4-hour chart, the GBP/USD pair fell to the corrective level of 50.0% (1.2867). Rebound from it allows traders to count on a reversal in favor of the British currency and some growth in the direction of the Fibo level of 38.2% (1.3010). The bullish divergence of the CCI indicator also worked in favor of the beginning of the growth of quotes. Fixing the pair's exchange rate below the level of 50.0% will work in favor of the US currency and resume falling in the direction of the corrective level of 61.8% (1.2720). GBP/USD – Daily. 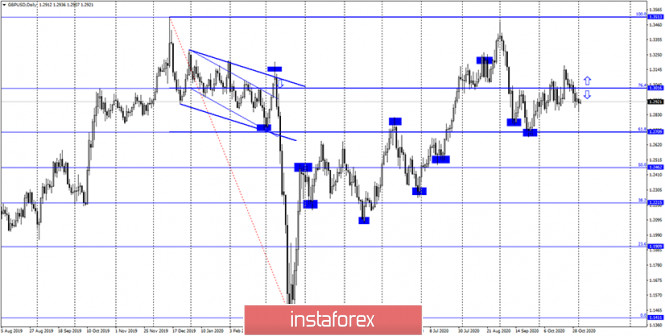
On the daily chart, the pair's quotes have consolidated below the corrective level of 76.4% (1.3016), which now allows us to expect a fall in the direction of the next corrective level of 61.8% (1.2709). GBP/USD – Weekly. 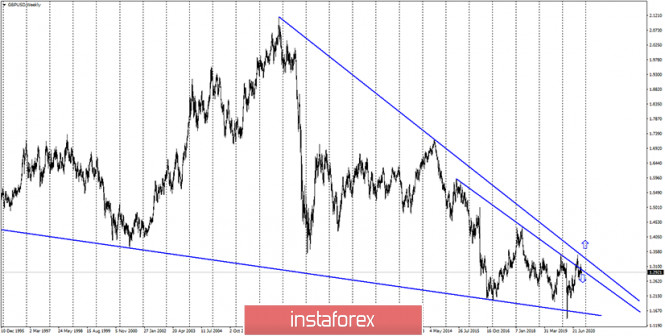
On the weekly chart, the pound/dollar pair closed under the lower downtrend line, so a false breakout of this line followed earlier. However, in recent weeks, the pair has made new attempts to gain a foothold over both trend lines. Overview of fundamentals: On Monday in the UK, the index of business activity in the manufacturing sector was higher, which exceeded the expectations of traders but did not cause any reaction. There was also still no official information about the progress of negotiations between the UK and the European Union. News calendar for the US and the UK: On November 3, the UK news calendar is empty, so traders will be closely monitoring the US election, and also hoping for information about the negotiations on the trade agreement from London. COT (Commitments of Traders) report: 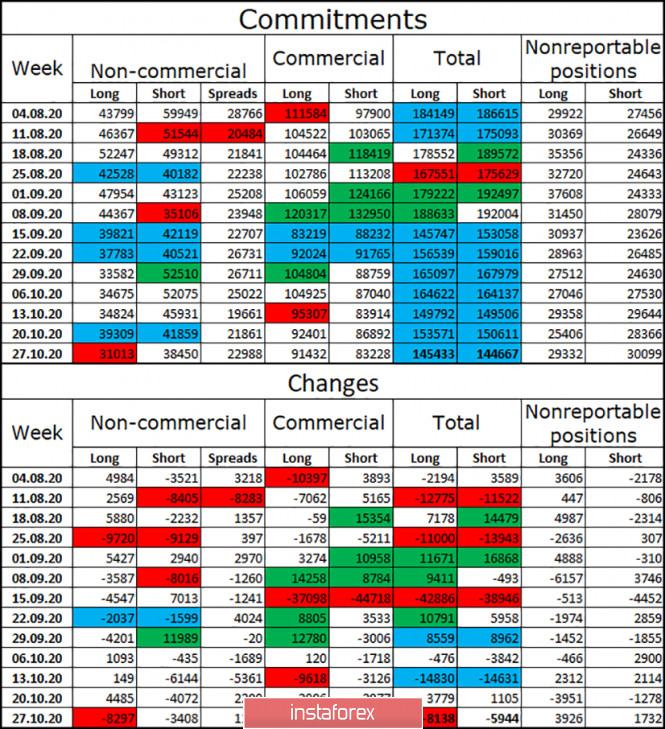
The latest COT report on the British pound showed that the mood of the "Non-commercial" category of traders became more "bearish" over the reporting week. Speculators got rid of 8,297 long contracts and 3,408 short contracts. Thus, in general, speculators got rid of any contracts for the British. However, it is mostly from long contracts. This suggests that the major players do not believe in the pound. It is extremely difficult to do this in the current conditions, as the prospects for the British economy remain extremely vague. Since August, the total number of long contracts in the hands of speculators has decreased to an absolute minimum – only 31,013. The total number of open contracts among all categories of traders has been almost the same for two months. Forecast for GBP/USD and recommendations for traders: Today, I recommend selling the GBP/USD pair with targets of 1.2866 and 1.2793, if a rebound is made from the upper border of the descending corridor. I recommend buying the British dollar with the goals of 1.2985 and 1.3057 if the consolidation above the corridor on the hourly chart is completed. Terms: "Non-commercial" - major market players: banks, hedge funds, investment funds, private, large investors. "Commercial" - commercial enterprises, firms, banks, corporations, companies that buy currency not for speculative profit, but for current activities or export-import operations. "Non-reportable positions" - small traders who do not have a significant impact on the price. EUR/USD. November 3. COT report. "wavering" states must decide the fate of the election. Forecasts say almost 100% guarantee of Joe Biden's victory 2020-11-03 EUR/USD – 1H. 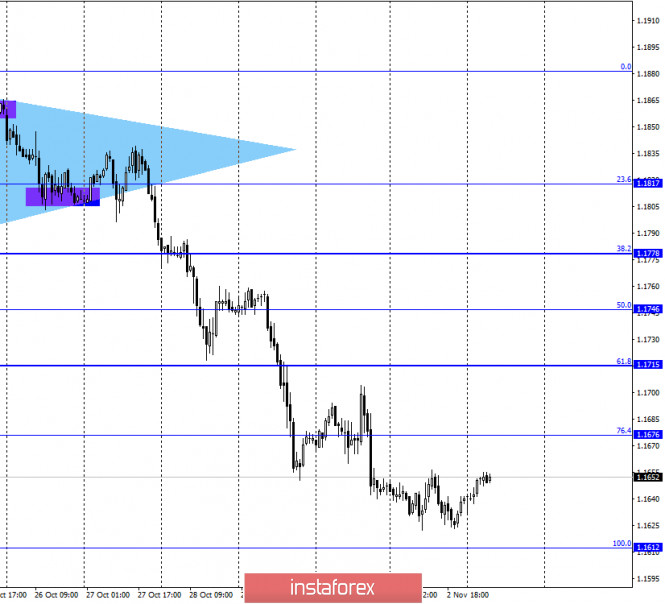
On November 2, the EUR/USD pair fell almost to the corrective level of 100.0% (1.1612), turned in favor of the European currency, and began the growth process towards the corrective level of 76.4% (1.1676). A rebound of the pair's quotes from this level will work again in favor of the US currency and resume falling towards the level of 1.1612. Meanwhile, the day has come on November 3, when the American presidential election will be held. This day was expected not only by the whole of America but also by all traders, as today and tomorrow, many pairs may experience the highest activity. It is not that traders like to move 300-400 points a day, and not that such trades are guaranteed today and tomorrow, however, this option is very likely. On election day in 2016, when Donald Trump won, the pair was very volatile. On the last day before the election, the results of all opinion polls and simulations were summed up, and the results remained approximately the same as before. Joe Biden is 90% likely to win the election, and his support rating among voters is at least 7-8% higher than Trump. By and large, the fate of the 2020 election depends on the "wavering" states, where the result cannot be predicted in advance. For example, in Texas, which provides 38 electoral votes at once, 49.5% of residents are ready to vote for Trump, and 48.2% for Biden. The gap is very small and the errors have not been canceled. Thus, as many as 28 electoral votes can easily go to either candidate. EUR/USD – 4H. 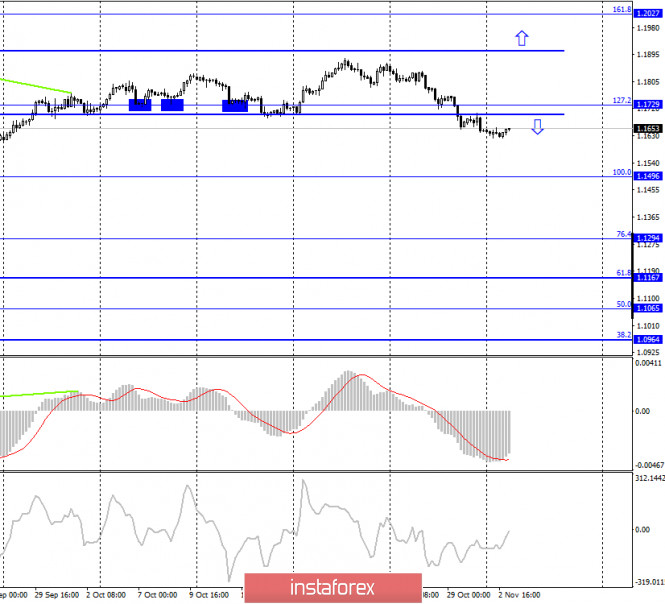
On the 4-hour chart, the pair's quotes were fixed under the side corridor. Thus, the probability of a further fall in the direction of the corrective level of 100.0% (1.1496) increased. The lower chart also supports this scenario. A bullish divergence is brewing for the CCI indicator, but completely different factors will rule the market today. The information background is in the first place today. EUR/USD – Daily. 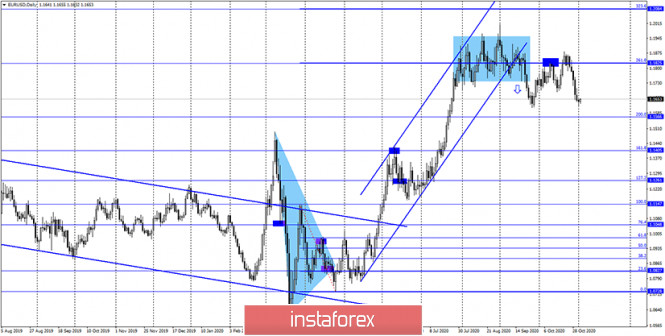
On the daily chart, the EUR/USD pair quotes performed a new rebound from the corrective level of 261.8% (1.1825), after which the quotes continue to fall in the direction of the Fibo level of 200.0% (1.1566). Closing the pair's exchange rate below this level will work in favor of a further drop in quotes towards the level of 161.8% (1.1405). EUR/USD – Weekly. 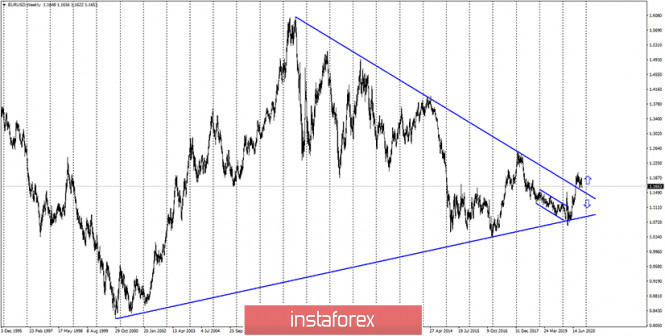
On the weekly chart, the EUR/USD pair performed a consolidation above the "narrowing triangle", which preserves the prospects for further growth of the pair, but in the long term. In the short term, a drop is preferable. Overview of fundamentals: On November 2, the European Union released the index of business activity in the manufacturing sector, which exceeded the forecast values. The same ISM index in the US also exceeded traders' expectations. News calendar for the United States and the European Union: On November 3, the calendars of economic events in the United States and the European Union are empty. And traders are looking forward to the start of the US election, which may be accompanied by mass riots. COT (Commitments of Traders) report: 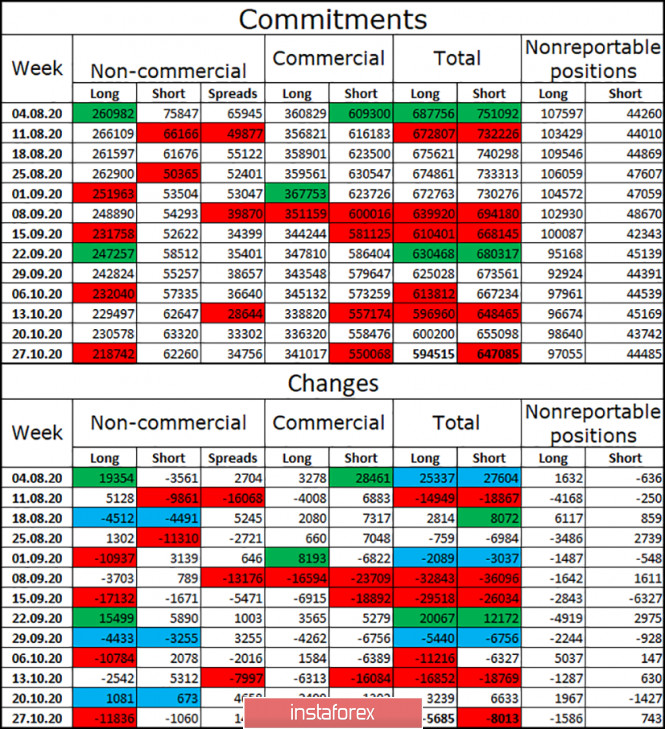
The latest COT report was quite informative. The most important category of non-commercial traders got rid of 12 thousand long contracts and 1 thousand short contracts during the reporting week. Thus, speculators do not believe in the further growth of the European currency and get rid of more purchases of this currency. This process has been going on for several weeks, so a trend is emerging. Over the past two months, the total number of long contracts in the hands of speculators has been steadily falling, while the number of short contracts has been growing slightly. Thus, I am inclined to the option with a further fall in the euro currency quotes. Forecast for EUR/USD and recommendations to traders: Today, I recommend opening new sales of the euro currency with a target of 1.1612, if the rebound from the Fibo level of 76.4% (1.1676) is completed. Purchases of the pair will be possible with a target of 1.1715 if the quotes consolidate above the level of 76.4% on the hourly chart. In the second half of the day, the activity of traders can grow significantly. Terms: "Non-commercial" - major market players: banks, hedge funds, investment funds, private, large investors. "Commercial" - commercial enterprises, firms, banks, corporations, companies that buy currency not for speculative profit, but for current activities or export-import operations. "Non-reportable positions" - small traders who do not have a significant impact on the price. Simplified wave analysis and forecast for GBP/USD and USD/JPY on November 3 2020-11-03 GBP/USD Analysis: The latest wave structure that is relevant for short-term trading on the chart of the major British pound is ascending, starting from September 10. On October 21, a corrective decline began towards the main exchange rate. Forecast: Today, the price is expected to move in the corridor between the opposite zones. In the first half of the day, pressure on the amount of support is likely. By the end of the day, you can expect price growth, up to the resistance zone. Potential reversal zones Resistance: - 1.2990/1.3020 Support: - 1.2890/1.2860 Recommendations: Trading on the British pound market today can be unprofitable and is only possible during sessions. Purchases of the instrument are more promising. 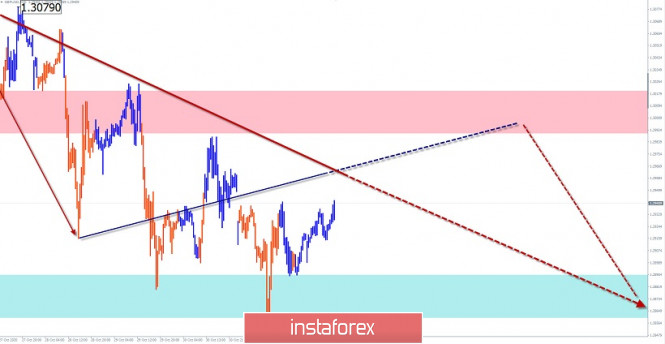
USD/JPY Analysis: The unfinished section in the dominant downward wave of the Japanese yen counts down from October 7. In the last 2 weeks, the pair's quotes form a correction of the wrong type. The movement is nearing completion. Forecast: Today, we expect a general flat mood of price movement in the corridor between the nearest zones. After pressure on the support zone, the rate will continue to develop mainly with an upward vector. Potential reversal zones Resistance: - 105.10/105.40 Support: - 104.40 / 104.10 Recommendations: In the conditions of the upcoming flat, trading on the pair's market may become risky. It is safer to buy from the area of the support zone. It is wiser to reduce the lot. 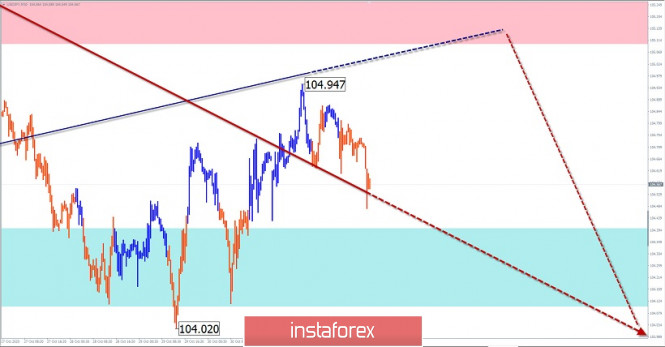
Explanation: In the simplified wave analysis (UVA), waves consist of 3 parts (A-B-C). The last incomplete wave is analyzed. The solid background of the arrows shows the formed structure, and the dotted background shows the expected movements. Note: The wave algorithm does not take into account the duration of the instrument's movements in time! EUR/USD, GBP/USD and AUD/USD: Markets await the results of the US presidential elections. The RBA lowered its key rate to almost zero. 2020-11-03 Markets froze in anticipation of the results of the US presidential elections, as only its outcome will determine the direction in which the US dollar will go. Many expect a sharp weakening in the currency, however, the latest macroeconomic data tell a different story. To add to that, the lockdown in many European countries does not give confidence to the bulls, because if earlier, there is a chance of growth in risky assets, the announcement of new quarantine restrictions have limited the upward potential in the market.  EUR/USD The better-than-expected data on the US manufacturing sector led to another wave of decline in the European currency, so as a result, the EUR/USD pair returned to its weekly low. The Institute of Supply Management said the Manufacturing PMI in the United States jumped to 59.3 points in October, while economists had expected growth to only 56.0 points. This sharp increase indicates that the manufacturing sector is recovering, in which all sub-indices have risen rather impressively. 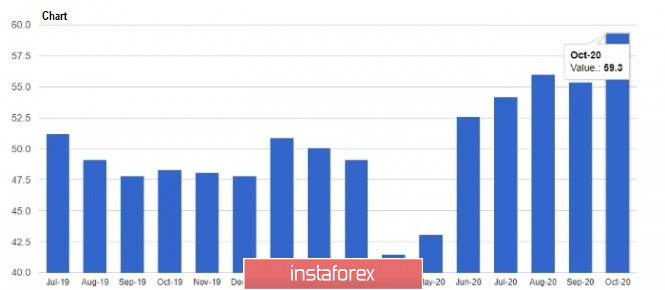 But despite this, the US dollar did not rise strongly in the markets, mainly because the victory of Joe Biden in the presidential elections could seriously weaken the currency's position. If the Democratic Party wins and gains a majority in both chambers of the Congress, there is a high chance that the next stimulus package would amount to $ 2-2.5 trillion, which will inevitably lead to a decreased demand in the currency. The worst scenario though is Biden's victory but loss of control in one of the chambers of the US Congress. In this, his party members may lose their positions, since parliamentary elections will take place along with the election of the head of state. Such would result in significant economic losses, in which the US GDP could lose about 0.5 to 1.0%. However, this does not set yet the final direction of currencies, since there is still the ongoing lockdown in Europe, which negatively affects the economy. Although the EU's manufacturing sector is still in the saddle, its service sector has already failed, and it will only get worse. Therefore, only an improvement in macroeconomic indicators will lead to more confident demand for risky assets. At the moment, there's no strong movement in the EUR/USD pair, but the bears will soon seek to break the support at 1.1615, as such will make it easier to bring the quote to the low of 1.1580. The main target though is the level of 1.1540, however, this is where pressure could ease in the European currency. Nonetheless, short positions will increase if Donald Trump wins the presidential election, but if Joe Biden comes out victorious, demand for the US dollar will decrease, which will return the euro to the level of 1.1660. Such will make it easier for the euro to reach the 17th figure, and a breakout from which will lead to a price of 1.1760 or 1.1835. GBP/USD The British pound remains trading in a sideways channel amid news that the UK government will expand aid to the self-employed in November. Minister of Finance, Rishi Sunak, said that support will increase from 40% of the trade profit to 80%, so the total fund that will be allocated for this purpose will amount to £ 4.5 billion. The technical picture of the GBP/USD pair says the bears failed again to break below the support of 1.2855, which suggests that there are still many bullish positions set up at the level. Therefore, the focus of sellers will be at this level today, and if they finally manage to bring the euro below 1.2855, a further downward move will occur, in the direction of lows 1.2800 and 1.2745. But if Brexit negotiations finally show progress, demand for the British pound will increase in the short term, which will lead in a breakout from the level of 1.2985. Such will result in active purchases of the trading instrument with an exit to the highs of 1.3060 and 1.3180. AUD/USD Today, the Reserve Bank of Australia lowered its key rate to almost zero, and announced a quantitative easing program that has an amount of A$ 100 billion. The bank said it came to this conclusion in order to reduce the yield of 5-year and 10-year government bonds within 6 months. 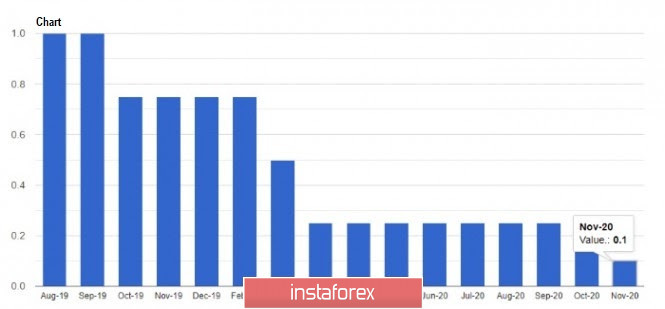 RBA governor, Philip Lowe, gave a more detailed explanation on this, saying that the easing of the policy reflects the bank's desire to ensure price stability, full employment and the well-being of the population. He said the bank is ready to buy bonds with a maturity of more than 10 years, however, it would depend on the market situation. In this case, the total weekly purchase volume of bonds will be in the region of A$ 5 billion. As for inflation, this problem remains a cornerstone of the RBA's monetary policy. Against this background, the Australian dollar declined in the market, in which the trading chart clearly shows a tense situation. The zigzag pattern of the quotes indicate the nervous state of traders, most especially since it is far from clear who will emerge victorious between the AUD and USD. Aside from that, the decision of the RBA casts doubt on the further strengthening of the Australian dollar, therefore, a downward trend in the currency has a higher chance of continuing. So, a breakout from the support level of 0.7000 will lead to a sharp downward movement towards the lows of 0.6940 and 0.6905, but a movement above 0.7075 will strengthen the currency, leading it towards the highs of 0.7105 and 0.7150. Trading idea for gold 2020-11-03  Today is a rather volatile day for all trading instruments because of the US presidential elections. And since the outcome of it is very difficult to predict, the best strategy right now is to trigger a false breakout, the range of which is around 10,000 pips: 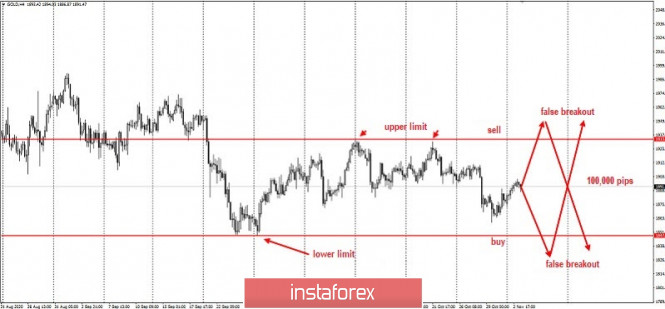 In this approach, the channel is actually a sideways one, within which both the buyers and sellers are trapped and are forced to limit their losses at technical levels (the upper and lower limits of the channel). Such would trigger a huge price movement, raising profitability to an incredible level (about 10,000 pips!). Of course, risks are needed to be monitored and controlled to avoid any losses. As we all know, trading in this market is very precarious and uncertain, but also very profitable if we use the right techniques "Price Action" and "Stop Hunting" were used for the strategy. Good luck!
Author's today's articles: Sergey Mityukov  Sergey Mityukov was born on September 18, 1981. He holds degrees in: - Process Engineering from Irkutsk State Technical University; - Psychology from Irkutsk State Technical University. Forex trading experience: 5 years. Sergey is a professional educational psychologist, the author of trading methods based on adjacent markets interrelation and developer of alternative approaches to Fibonacci sequence in trading. He has a 2-year experience in carrying out live and online trading conferences. His portfolio includes dozens of training courses and methods. He developed several indicators, which are widely used by traders on futures and spot markets. Sergey Mityukov was born on September 18, 1981. He holds degrees in: - Process Engineering from Irkutsk State Technical University; - Psychology from Irkutsk State Technical University. Forex trading experience: 5 years. Sergey is a professional educational psychologist, the author of trading methods based on adjacent markets interrelation and developer of alternative approaches to Fibonacci sequence in trading. He has a 2-year experience in carrying out live and online trading conferences. His portfolio includes dozens of training courses and methods. He developed several indicators, which are widely used by traders on futures and spot markets. Torben Melsted  Born in November 1962. Graduated from CBS, got Diploma in Finance. Began trading on Forex in 1986 and since that time held various positions such as advising clients, hedging client flows on FX and commodity markets. Also worked for major corporations as Financial Risk Manager. Uses Elliott wave analysis in combination with classic technical analysis, and has been using a Calmar Ratio of 5.0 for over 3 years. Has his own blog, where he uses Elliott wave and technical analysis on all financial markets. Born in November 1962. Graduated from CBS, got Diploma in Finance. Began trading on Forex in 1986 and since that time held various positions such as advising clients, hedging client flows on FX and commodity markets. Also worked for major corporations as Financial Risk Manager. Uses Elliott wave analysis in combination with classic technical analysis, and has been using a Calmar Ratio of 5.0 for over 3 years. Has his own blog, where he uses Elliott wave and technical analysis on all financial markets. Mihail Makarov  - - Sebastian Seliga  Sebastian Seliga was born on 13th Oсtober 1978 in Poland. He graduated in 2005 with MA in Social Psychology. He has worked for leading financial companies in Poland where he actively traded on NYSE, AMEX and NASDAQ exchanges. Sebastian started Forex trading in 2009 and mastered Elliott Wave Principle approach to the markets by developing and implementing his own trading strategies of Forex analysis. Since 2012, he has been writing analitical reviews based on EWP for blogs and for Forex websites and forums. He has developed several on-line projects devoted to Forex trading and investments. He is interested in slow cooking, stand-up comedy, guitar playing, reading and swimming. "Every battle is won before it is ever fought", Sun Tzu Sebastian Seliga was born on 13th Oсtober 1978 in Poland. He graduated in 2005 with MA in Social Psychology. He has worked for leading financial companies in Poland where he actively traded on NYSE, AMEX and NASDAQ exchanges. Sebastian started Forex trading in 2009 and mastered Elliott Wave Principle approach to the markets by developing and implementing his own trading strategies of Forex analysis. Since 2012, he has been writing analitical reviews based on EWP for blogs and for Forex websites and forums. He has developed several on-line projects devoted to Forex trading and investments. He is interested in slow cooking, stand-up comedy, guitar playing, reading and swimming. "Every battle is won before it is ever fought", Sun Tzu Alexandr Davidov  No data No data Irina Manzenko  Irina Manzenko Irina Manzenko Sergey Belyaev  Born December 1, 1955. In 1993 graduated from Air Force Engineering Academy. In September 1999 started to study Forex markets. Since 2002 has been reading lectures on the technical analysis . Is fond of research work. Created a personal trading system based on the indicator analysis. Authored the book on technical analysis "Calculation of the next candlestick". At present the next book is being prepared for publishing "Indicator Analysis of Forex Market. Trading System Encyclopedia". Has created eleven courses on indicator analysis. Uses classical indicators. Works as a public lecturer. Held numerous seminars and workshops presented at international exhibitions of financial markets industry. Is known as one of the best specialists in the Russian Federation researching indicator analysis. Born December 1, 1955. In 1993 graduated from Air Force Engineering Academy. In September 1999 started to study Forex markets. Since 2002 has been reading lectures on the technical analysis . Is fond of research work. Created a personal trading system based on the indicator analysis. Authored the book on technical analysis "Calculation of the next candlestick". At present the next book is being prepared for publishing "Indicator Analysis of Forex Market. Trading System Encyclopedia". Has created eleven courses on indicator analysis. Uses classical indicators. Works as a public lecturer. Held numerous seminars and workshops presented at international exhibitions of financial markets industry. Is known as one of the best specialists in the Russian Federation researching indicator analysis. Vladislav Tukhmenev  Vladislav graduated from Moscow State University of Technologiy and Management. He entered the forex market in early 2008. Vladislav is a professional trader, analyst, and manager. He applies a whole gamut of analysis – technical, graphical, mathematical, fundamental, and candlestick analysis. Moreover, he forecasts the market movements using his own methods based on the chaos theory. Vladimir took part in development of trading systems devoted to fractal analysis. In his free time, Vladimir blogs about exchange markets. Hobbies: active leisure, sporting shooting, cars, design, and marketing. "I do not dream only of becoming the best in my field. I also dream about those who I will take with me along the way up." Vladislav graduated from Moscow State University of Technologiy and Management. He entered the forex market in early 2008. Vladislav is a professional trader, analyst, and manager. He applies a whole gamut of analysis – technical, graphical, mathematical, fundamental, and candlestick analysis. Moreover, he forecasts the market movements using his own methods based on the chaos theory. Vladimir took part in development of trading systems devoted to fractal analysis. In his free time, Vladimir blogs about exchange markets. Hobbies: active leisure, sporting shooting, cars, design, and marketing. "I do not dream only of becoming the best in my field. I also dream about those who I will take with me along the way up." Ivan Aleksandrov  Ivan Aleksandrov Ivan Aleksandrov Grigory Sokolov  Born 1 January, 1986. In 2008 graduated from Kiev Institute of Business and Technology with "Finance and Credit" as a major. Since 2008 has studied the behavior of various currency pairs and their correlation on Forex. In his works and trading practice he uses candlestick analysis and Fibonacci technique. Since 2009 has written analytical reviews and articles which are published on popular Internet resources. Interests: music, computers and cookery. "Out of five deadly sins of business and as a rule, the most widespread, excessive striving to get profit is the worst". P. Drucker Born 1 January, 1986. In 2008 graduated from Kiev Institute of Business and Technology with "Finance and Credit" as a major. Since 2008 has studied the behavior of various currency pairs and their correlation on Forex. In his works and trading practice he uses candlestick analysis and Fibonacci technique. Since 2009 has written analytical reviews and articles which are published on popular Internet resources. Interests: music, computers and cookery. "Out of five deadly sins of business and as a rule, the most widespread, excessive striving to get profit is the worst". P. Drucker Vyacheslav Ognev  Vyacheslav was born on August 24, 1971. In 1993, he graduated from Urals State University of Economics in the Russian city of Ekaterinburg holding a degree in Commerce and Economics of Trade. In 2007, he started concentrating on the Russian stock market, trading stocks on the RTS Stock Exchange and futures contracts on FORTS. Since 2008 he has been engaged in analyzing Forex market and trading currencies. He is an author of a simplified wave analysis method. He has also developed a trading strategy. At present, Vyacheslav is a co-author of training materials on two web portals dedicated to Forex trading education. Interests: fitness, F1 "Experience is the best of schoolmasters, only the school fees are heavy." - Thomas Carlyle Vyacheslav was born on August 24, 1971. In 1993, he graduated from Urals State University of Economics in the Russian city of Ekaterinburg holding a degree in Commerce and Economics of Trade. In 2007, he started concentrating on the Russian stock market, trading stocks on the RTS Stock Exchange and futures contracts on FORTS. Since 2008 he has been engaged in analyzing Forex market and trading currencies. He is an author of a simplified wave analysis method. He has also developed a trading strategy. At present, Vyacheslav is a co-author of training materials on two web portals dedicated to Forex trading education. Interests: fitness, F1 "Experience is the best of schoolmasters, only the school fees are heavy." - Thomas Carlyle Pavel Vlasov  No data No data Andrey Shevchenko  Andrey Shevchenko Andrey Shevchenko
Subscription's options management Theme's:
Fundamental analysis, Fractal analysis, Wave analysis, Technical analysis, Stock Markets
Author's :
A Zotova, Aleksey Almazov, Alexander Dneprovskiy, Alexandr Davidov, Alexandros Yfantis, Andrey Shevchenko, Arief Makmur, Dean Leo, Evgeny Klimov, Fedor Pavlov, Grigory Sokolov, I Belozerov, Igor Kovalyov, Irina Manzenko, Ivan Aleksandrov, l Kolesnikova, Maxim Magdalinin, Mihail Makarov, Mohamed Samy, Mourad El Keddani, Oleg Khmelevskiy, Oscar Ton, Pavel Vlasov, Petar Jacimovic, R Agafonov, S Doronina, Sebastian Seliga, Sergey Belyaev, Sergey Mityukov, Stanislav Polyanskiy, T Strelkova, Torben Melsted, V Isakov, Viktor Vasilevsky, Vladislav Tukhmenev, Vyacheslav Ognev, Yuriy Zaycev, Zhizhko Nadezhda
Edit data of subscription settings
Unsubscribe from the mailing list Sincerely,
Analysts Service | If you have any questions, you can make a phone call using one of the
InstaForex Toll free numbers right now:
|  | InstaForex Group is an international brand providing online trading services to the clients all over the world. InstaForex Group members include regulated companies in Europe, Russia and British Virgin Islands. This letter may contain personal information for access to your InstaForex trading account, so for the purpose of safety it is recommended to delete this data from the history. If you have received this letter by mistake, please contact InstaForex Customer Relations Department. |


No comments:
Post a Comment