| Analysis and forecast for EUR/USD on November 20, 2020 2020-11-20 Recently, the US dollar has been trading in pairs with the single European currency very unevenly, without a clear direction. The price dynamics of the main currency pair is still affected by the ongoing COVID-19 pandemic. So, in the United States of America, the number of deaths from coronavirus has already exceeded 250 thousand people, and therefore New York schools have switched to correspondence education. However, in Europe, the situation with the daily number of infected people, to put it mildly, is far from ideal. This has been repeatedly reported in previous articles, so we will not repeat it. In general, the US currency is in an uncertain state. On the one hand, the dollar is still in demand as a protective asset, but on the other, fiscal stimulus in the United States, which is delayed due to Donald Trump's non-recognition of the results of the presidential election, puts pressure on the rate of the "American". Against this background, speculation has resumed that the US Federal Reserve (FRS) will further ease its monetary policy by expanding its bond-buying program. Yesterday's data from the United States on the number of initial applications for unemployment benefits came out worse than forecasts of 707 thousand and amounted to 742 thousand applications. However, market participants decided to ignore this fact, and it did not have a significant impact on the price dynamics of EUR/USD. Today, on the last day of weekly trading, no significant statistics from Europe and the United States are expected, so it is reasonable to assume that the pair's movement will depend on market sentiment and the technical picture. Daily 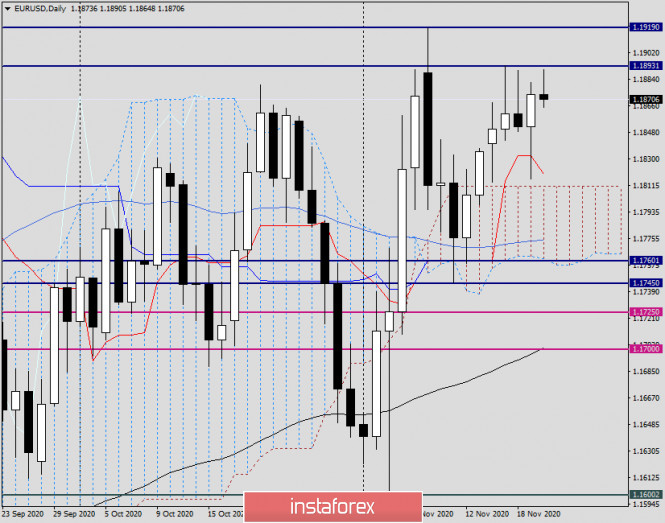
In yesterday's review of the main currency pair, attention was drawn to the candle for November 18, which could be considered a reversal with good reason. At the same time, the intrigue remained - whether the market will win back this signal. And here again, everything turned out to be very ambiguous. At first, the pair started to decline, but after finding strong support near 1.1816, the downward movement stopped and the quote turned on the rise. As a result, Thursday's trading ended with growth, and the closing price of the session was 1.1873. Today, at the time of writing this article, the upward trend continued and the rate was already rising to 1.1890, which is slightly below the resistance of 1.1893, where the maximum values were shown on November 17-18. Slowly but surely, the pair is getting closer to the most important and largely defining resistance zone of 1.1900-1.1920. Interestingly, after the US presidential election, the quote has not yet managed to rise above 1.1920. As for yesterday's recommendation to buy EUR/USD on a decline in the area of 1.1835-1.1815, it turned out to be correct. Attempts to break through the red line of the Tenkan Ichimoku indicator were unsuccessful, and it fulfilled its support function. So far, the weekly candle is bullish and the euro/dollar has every chance to end trading on November 16-20 with growth. A very important factor will be the closing price of weekly trading relative to the levels of 1.1900 and 1.1920, but we will talk about this on Monday, taking into account the actual closing of the week. For those who do not want to take risks and enter the market on the last day of weekly trading, I recommend staying out of the market. For those who want to open positions, I suggest paying attention to the opportunity to buy the EUR/USD pair after short-term declines to the levels of 1.1870, 1.1865, and 1.1860. Technical picture and trading recommendations for EUR/GBP on November 20 2020-11-20 Today, on the last day of weekly trading, we will consider an interesting cross-rate of the euro/pound. As has been repeatedly pointed out, this tool often has a serious impact on the price dynamics of the main currency pairs EUR/USD and GBP/USD. Well, let's analyze several charts of the EUR/GBP price and try to understand which direction the cross will move in the near future. Weekly 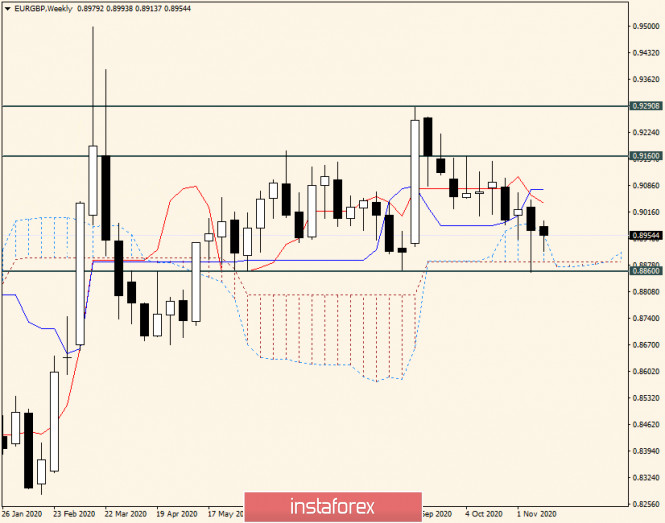
After the appearance of the previous weekly candle with a long lower shadow, it was quite possible to count on the growth of the single currency against the British pound, but this is not happening at the time of writing, and the pair has every chance to end the weekly trading with a decline. It is worth noting that in the past week's trading, the bears' attempts to bring the price down from the Ichimoku indicator cloud ended in vain. Strong support was received at the significant technical level of 0.8860, which is where the long tail of the last weekly candle came from. The support zone can be considered 0.8887-0.8860, where the lower border of the cloud and the minimum values of previous trades pass. At the same time, the euro/pound is trading under the Tenkan and Kijun lines of the Ichimoku indicator, and this may increase the pressure on the quote. Based on this, to resume and strengthen the bullish mood, the pair's bulls need to close weekly trading above the important psychological level of 0.9000 and the marked Tenkan and Kijun lines. If this can be done, the next target for players to increase will be strong resistance from sellers near 0.9160. Today, it is unlikely that there will be enough time and effort to meet this condition, so the market will focus on the 0.9000 level and the closing price of weekly trading above or below this landmark mark. Daily 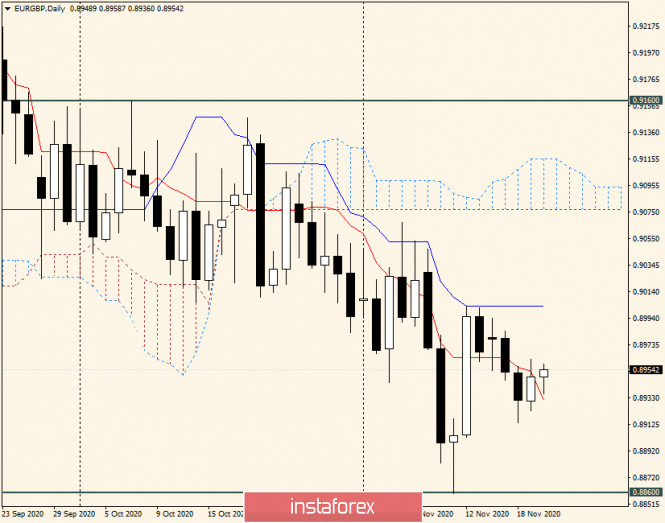
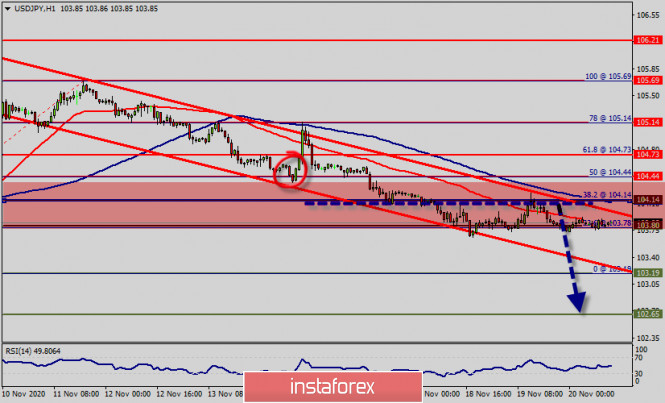
Despite the report that the seven-year budget of the European Union was not adopted at the last summit, the cross showed strengthening in yesterday's trading. Regarding the budget that was not adopted, Hungary and Poland used their veto power. Let me remind you that the EU's seven-year budget was proposed taking into account assistance to the countries most affected by the COVID-19 pandemic, and amounted to almost 2 trillion euros. Now, this issue is being dragged out, and Poland and Hungary are likely to be persuaded to refuse to block this important document and agree to accept it. It is characteristic that this factor did not actually put any pressure on the single European currency, either in pair with the pound or in pair with the US dollar, which is very surprising. From a technical point of view, the possible growth of EUR/GBP can reach the blue Kijun line, which serves as a strong resistance. Support, in turn, is provided by the Tenkan red line, closing the day below which will increase bearish sentiment and pressure on the quote. According to trading recommendations, all attention should be paid to the 0.9000 resistance level. If this mark is broken, on a rollback to it, you can plan purchases with the nearest target in the area of 0.9080. If bearish candlestick patterns appear near 0.9000 on the four-hour and/or hourly charts, a signal will appear to open short positions with the nearest target in the area of 0.8925. In my personal opinion, a little more priority for sales, but for more accurate conclusions, you need to wait for the closing of today and all weekly trading! Trading idea for the EUR/USD pair 2020-11-20  The euro continues to trade upward in the market, so as a result, a pin bar was formed in the EUR/USD chart. What exactly happened is that small players created "provocations" in an attempt to disembark large players from the trend. In particular, they made a false breakout, enabling the quotes to close higher. However, they left the tops untouched. 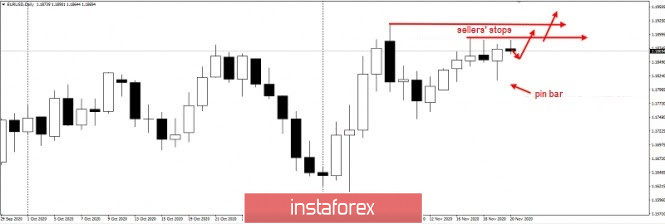 Such an action, on the one hand, is a provocation of the bulls, but on the other hand, it is a good signal for long positions, because even if the quotes rose sharply yesterday, the sellers' stops were not touched. Taking this into account, resuming the climb is still profitable, and this can be done by following the idea below: 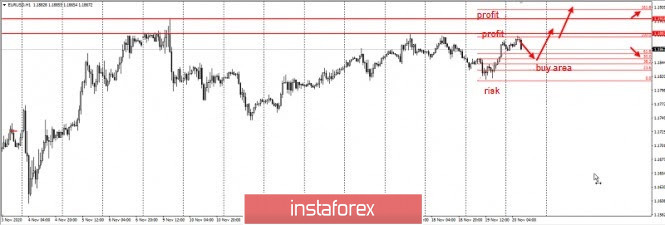 Since the quotes form a three-wave pattern (ABC) wherein wave "A" is the bullish impulse yesterday, the best action is to take long positions from a pullback, towards 50% Fibonacci. This plan is relevant until the quotes update yesterday's low (1.8200). Traders may take profit at levels 1.18934 and 1.19200. The risk/profit ratio for these transactions is 1.5:1. Price Action and Stop Hunting methods were used for this strategy. Good luck! Technical analysis of EUR/USD for November 20, 2020 2020-11-20 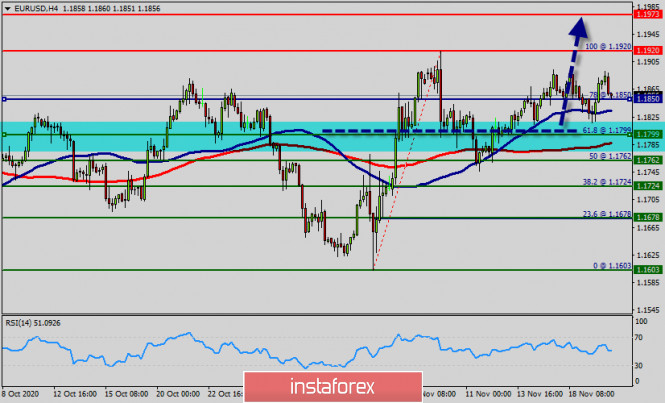 Overview : The EUR/USD pair climbed from 1.1800 to 1.1920 and closed at the price of 1.1850. But, this week we note that the market above the level of 1.1850. Please, note that the resistance stands at the levels of 1.1920 and 1.1973 in the 4H time frame. In the longer term, the strong resistance at 1.1973 (last week's high, see also the long-term declining trendline from the November peak) continues to represent a major hurdle. Therefore, right now the first descending impulse is forming the first one; the market is being corrected from the area of 1.1800 this week. In our opinion, the EUR/USD pair may grow up to test 1.1920 from above and then form the second ascending impulse with a target at 1.1920 to test the double top. Furthermore, the level of 1.1920 will form a double bottom which represents the major support level this week. Today, if the trend is able to close above the level of 1.1920, the price will rise into the bullish market in order to go further towards the strong resistance at 1.1973. In the the daily time frame, the pair will probably go up because a upward trend is still strong and the RSI indicator is still signaling that the trend is upward. Conclusion The depicted resistance level of 1.1800 acted as an important key level offering a valid buy entry. So, buy at the 1.1800 level with the targets of 1.1920 and 1.1973 this week. Conversely, stop loss should be placed below the low reached near the second support (1.1762). Technical analysis of USD/JPY for November 20, 2020 2020-11-20 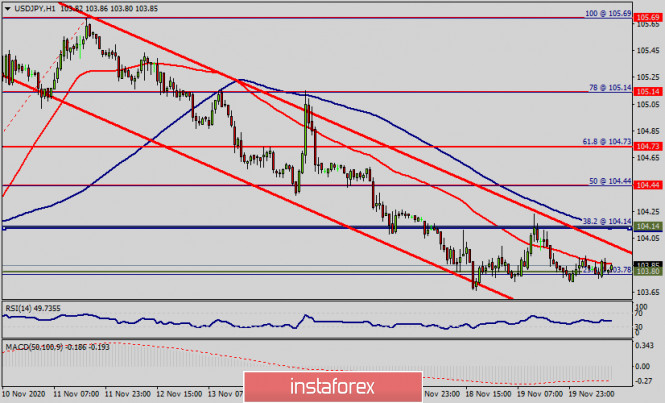 Overview: Yesterday, the USD/JPY pair reached a new minimum at the price of 103.80. So, today the price may reach one more minimum around the spot of 103.80, which coincides with the double bottom On the H1 chart. The USD/JPY pair dropped perfectly, remain bearish for a further drop. We expect to see a strong reaction off this level to push price down towards 104.14 before 103.80 support (Fibonacci retracement, horizontal swing low support). Today, the USD/JPY pair is challenging the psychological resistance at 104.14. Hence, the resistance is seen at the level of 104.14 at the same time frame. We expect the USD/JPY pair to continues moving in a downtrend below the level of 104.14 towards the first target at 103.19, while major resistance is found at 104.14 (38.2% Fibonacci). On the downside, a clear break at the level of 103.19 could trigger further bearish pressure testing 102.65, which represents the major support today. Forecast: As a result, it is gainful to sell below this price of 104.14 with targets at 103.19 and 102.65. However, the bullish trend is still expected for the upcoming days as long as the price is above 102.65. Daily Technical level: - Major resistance: 104.73
- Minor resistance: 104.44
- Intraday pivot point: 104.14
- Minor support: 103.19
- Major support: 102.65
 NZD/USD. New Zealand dollar keeps on breaking records 2020-11-20 The New Zealand dollar against the US currency continues to break records. It managed to consolidate within the 0.69 level, approaching two-year price highs. There are a lot of important factors that contribute to the growth of this pair, especially amid the US dollar, which continues to show vulnerability. On the one hand, the current fundamental background allows us to unconditionally recommend long positions in the NZD/USD pair. But on the other hand, the proximity of the 0.70 level causes concern – negative reaction from the RBNZ may follow, as soon as buyers "swing" at this price target. 
In fact, it is worth noting that RBNZ members, in fact, gave the go signal for the upward trend of the NZD/USD pair. During this year's last meeting, the regulator not only kept a wait-and-see attitude, but also stated their future prospects. In particular, Adrian Orr, Central bank's head, said that the country's economy turned out to be more stable than previously assumed. He also announced that the Central Bank intends to maintain the status quo at the rate at least until March next year. Thus, he made it clear that the bank will not introduce negative rates in the near future, since the current risks have become more balanced than before. The market was clearly surprised by such results of the November meeting, as most experts expected a "dovish" scenario. This week, buyers of NZD/USD pair continued to rally upwards after a deep corrective pullback. This was supported by China's data, which mostly came out in the green zone. It became known that October's industrial production rose by 6.9% in annual terms, which exceeded the expectations of the market, with a forecasted growth by around 6.5% only. In addition, retail sales were also pleasant. The corresponding figure surged by 4.3% in October, after rising by 3.3% in September. The New Zealand dollar received additional support in the form of growth in the price index for dairy products. At the first GDT auction in November, the trades closed in the red zone, although the index showed positive dynamics before that. Nevertheless, the indicator left the negative zone during the last auction this Wednesday and reached 1.8%, leveling the decline at the beginning of the month. At the same time, the recovery of the index was due to the strengthening of prices for most of the tradable categories of dairy products. Let me remind you that the cost of milk and the demand for it is quite important for the New Zealand economy, therefore, the current situation may have a corresponding impact on the mood of the RBNZ members. The island nation exports powdered milk and other dairy products mainly to China and Europe, so recent trends indicate higher demand from them. On another note, COVID-19 which is exerting the strongest pressure on the US currency, has the opposite effect for the New Zealand currency. The fact is that New Zealand actually "defeated" COVID-19 not so long ago, and since then, there were almost no cases. For example, only three COVID-19 cases were detected in the country yesterday. At the same time, all infected were found during quarantine upon arrival in New Zealand. No cases of the spread of infection within the state were recorded. Thus, RBNZ's wait-and-see attitude, China's growing data, the rise in the milk's price and the victory against COVID-19 allows the NZD to update price ranges. The US dollar, in turn, is still under pressure from fundamental issues. New coronavirus anti-records, conflict between the US Treasury and the Fed, slowing inflation and falling retail sales, the inability of congressmen to compromise on a new stimulus package to support economic recovery and the possible easing of the Fed's monetary policy parameters – all these fundamental factors play against the USD. 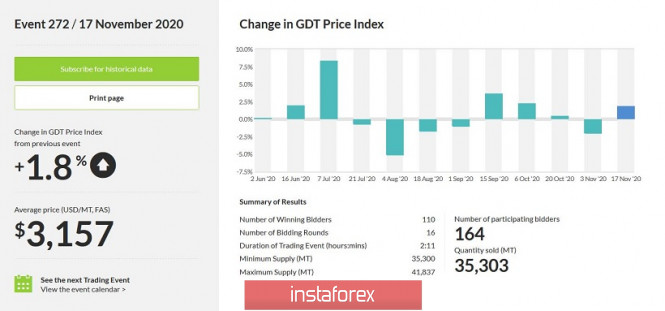
Therefore, we can consider buying the NZD/USD pair with the main goal of 0.7000 in the medium term. However, it is suggested to take profit after reaching this level. The Reserve Bank of New Zealand is concerned about the inflated exchange rate of the national currency, putting verbal pressure on it. The relevant signals have already been voiced by the country's trade minister. He believes that the current strengthening of the "kiwi" exchange rate is an unfavorable factor for the country's export-oriented economy. From a technical viewpoint, we can also talk about the priority of long positions on the NZD/USD pair. This pair is on the upper line of the Bollinger Bands indicator and above all lines of the Ichimoku indicator on all bigger time frames, with the exception of the monthly TF. The upside goal is the resistance level which corresponds to the level of 0.7005 – the upper line of the Bollinger Bands indicator on the monthly time frame. GBP/USD and EUR/USD: Brexit negotiations were paused due to one participant contracting COVID-19. Meanwhile, the US Treasury Secretary abandons a number of lending programs, which put pressure on the US dollar. 2020-11-20 The dollar lost a number of positions yesterday amid growing jobless claims in the United States. To add to that, the US Treasury Secretary said he is abandoning a number of lending programs, which put more pressure to the US currency. Meanwhile, Brexit negotiations are paused due to one participant contracting COVID-19. Such news did not exert any pressure on the British pound though, which raises many questions, since there is practically no time left to find a compromise.  Yesterday, Secretary of the Treasury, Steven Mnuchin said he is abandoning a number of lending programs that were applied during the first wave of the pandemic. These are several credit lines of the Fed, scheduled to expire later this year. Mnuchin said these programs no longer need to be extended, as in his opinion, the markets for corporate loans and municipal borrowing can already function independently. Banks already have reserves and opportunities to provide their own loans to corporate, municipal and non-profit clients. In his letter to the Federal Reserve, Mnuchin said the above programs have already fulfilled their tasks, which led to sharp criticism from Jerome Powell. The head of the Fed made it clear that he is disappointed with this decision, as he would prefer to keep the entire set of emergency lines open during the coronavirus pandemic in the future. Powell claims the rejection of a number of programs could put additional pressure on the already struggling economy. These different views did not put serious pressure on the US dollar though, but led to a partial decline against the euro and pound. Thus, for the EUR/USD pair, everything will depend on whether the bulls manage to break above the monthly high of 1.1915. Only a break above this range will increase demand for risky assets, which will make it easier for the quotes to reach 1.1970 and 1.2020. Meanwhile, if the euro consolidates below 1.1820, the EUR/USD pair will collapse to 1.1760, and then to the base of the 17th figure. With regards to the COVID-19 situation in the United States, Vice President Mike Pence announced yesterday that the government is ready to immediately distribute the vaccine as soon as it is ready. Pence noted that the US has never been so ready to fight the virus, and the administration is against economic lockdowns and school closings. Over the past day, as reported by Johns Hopkins University, over 170,000 Americans have been infected with coronavirus. This figure is almost equal to the peak recorded last Friday. Various states are already independently taking measures to contain the pandemic. For example, New York Mayor, Bill de Blasio, said that from today, all schools in the city will be closed at least until the end of November. Various social distancing measures have also been announced in Kentucky, Wisconsin and Illinois, from expanding the list of mandatory wearing masks to closing bars and restaurants. Many states have restrictions on personal communication. 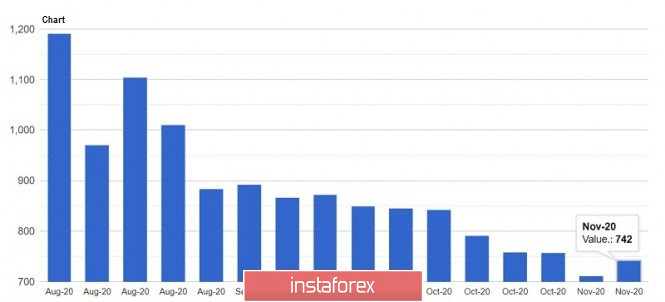 As for economic data, the US Department of Labor published a report yesterday, which revealed that jobless claims in the US have increased. This indicates that the situation is turning in a negative direction due to the second outbreak of coronavirus. The data said initial applications for the week of November 8-14 rose to 742,000, from 711,000 a week earlier. Economists had expected the number to be 710,000. 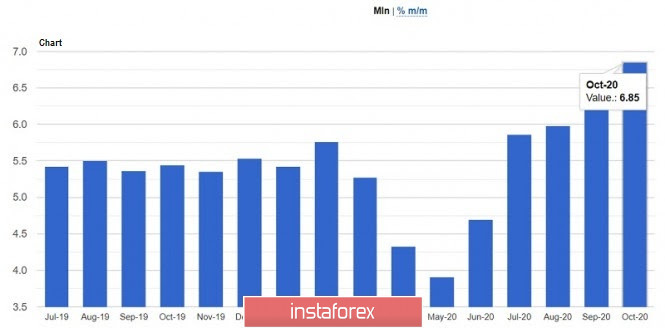 The composite index of leading indicators, which tracks economic cycles in the United States, also continued to rise in October, reaching a value of 108.2 points. It increased by 0.7% compared to September, and fully coincided with the forecasts of economists Sales in the US secondary housing market also increased, especially given the level of interest rates and how widely available lending is due to a number of emergency programs. According to the National Association of Realtors, sales in October increased by 4.3% compared to September, and amounted to 6.85 million homes per year. Compared to the same period last year, sales grew by 26.6%. Economists had expected a decline of about 1.2%. As for the median home price in October, the amount jumped 15.5% to $ 313,000. GBP/USD Brexit negotiations were paused as one participant was reported to have contracted COVID-19. Supposedly, the meeting was the finale of the talks, however, it wasn't able to produce any progress, thereby leaving the issue of the trade agreement remained in limbo. Surprisingly, the pound did not react to this news, which indicates positive expectations from market participants. It is unclear yet whether negotiations will resume next week. Until a test is made to all participants in the meeting and reliable results are obtained that no one else has become infected with COVID-19, it will hardly be possible to talk about the continuation of negotiations. The lack of market reaction is further evidence of the fact that everyone is determined to reach a compromise and sign an agreement at the last minute. However, if an agreement was not signed, the British pound could plummet. A recent study said a Brexit without deal would lead to a major collapse in the market, as such would deal a significant blow both to the UK and EU economy. Thus, for the GBP/USD pair, bulls are aiming for a breakout above the resistance level of 1.3310, as only such will lead to movements towards 1.3380 and 1.3470. But if the quotes decline below 1.3235, the GBP/USD pair will go to the support level of 1.3165, and then to the base of the 31st figure. EUR/USD analysis for November 20 2020 - Potential for the dowsnide rotation towards the 1.1850 2020-11-20 This was very much expected already as Eamonn highlighted earlier in the day here. After the passing of safety data on Wednesday, the latest move here was anticipated. The response to the latest development above is relatively mild but it sees 10-year Treasury yields hold at the highs for the day, up 1.8 bps to 0.847%. European equities are also keeping firmer still and the dollar is losing some ground on the session. I don't expect the knee-jerk reaction here to be a massive one, all things considered. However, just be mindful of the key levels at play for the dollar that are still intact and with S&P 500 futures near flat levels, watch out for the 3,600 level. On the latter especially, get above that and we could see risk swing back heavily in favour of buyers ahead of the weekend. Further Development 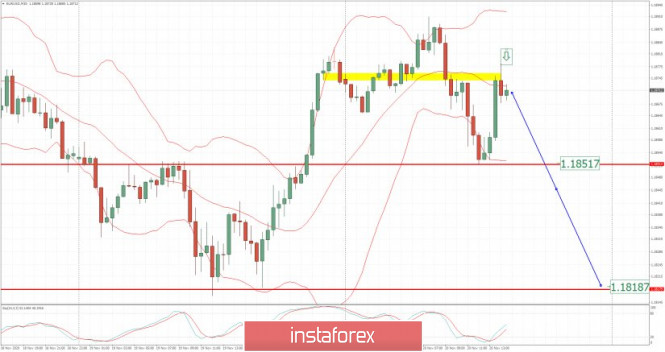
Analyzing the current trading chart of EUR/USD, I found that the buyers got exhausted today at the level at 1,1880 and that there is potential for the downside continuation based on the last downside swing. 1-Day relative strength performance Finviz 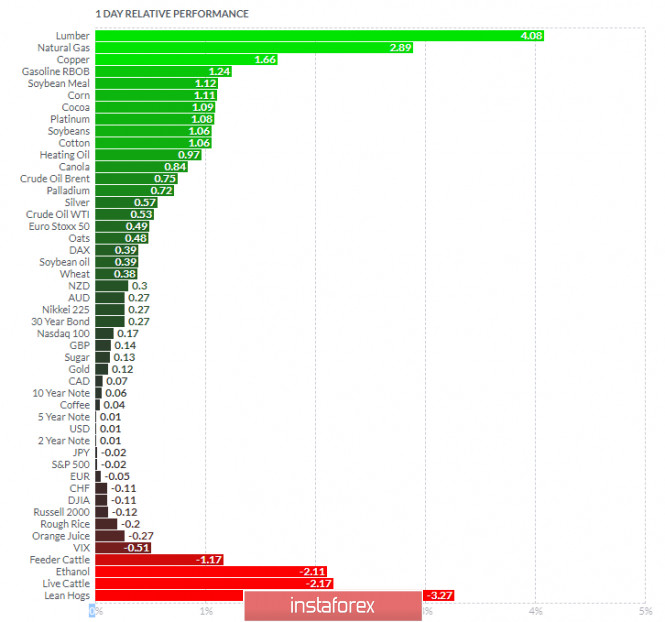
Based on the graph above I found that on the top of the list we got Lumber and Natural Gas today and on the bottom Lean Hogs and Live Catlle. Key Lvels: Resistance: 1,1880 Support levels: 1,1850 and 1,1820 Analysis of Gold for November 20,.2020 - Breakout of the rising trendline and potetnial for the downside rotation 2020-11-20 This seems to be the safety net in case negotiations next week continue to lead nowhere. The pressing issue now is time as EU officials view that a deal needs to be struck by next Monday in order to facilitate the translation and ratification before the year-end. According to RTE Europe editor, Tony Connelly: Another standout element of today's briefing is that officials are considering Provision Application of the agreement because time is diminishing so fast, ie that an agreement wd provisionally come into effect on Jan 1 but that all the ratification procedures wd happen after. Those would include ratification by the European Parliament some time early in the new year - not clear yet how that will go down with MEPs. Such a move will bring up the debate on whether or not the deal would be "mixed" or "EU only" but that would be a technicality that they should be able to easily work out in the end; not withstanding the three key outstanding issues of course. 
Further Development 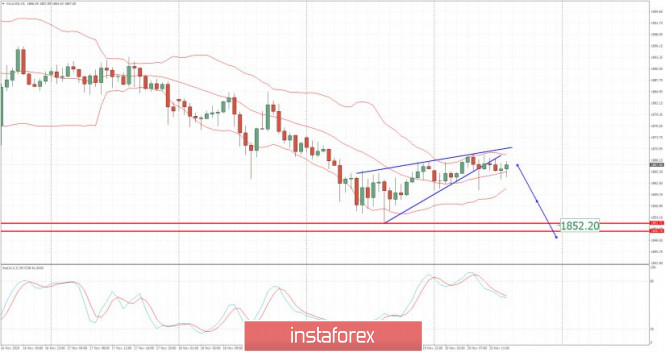
Analyzing the current trading chart of Gold, I found that the buyers got exhausted today and that there is the breakout of the rising trend line in the background, which is sign for potential downside continuation. My advice is to watch for selling opportunities with the target at the price of $1,852. Finviz Relative Strength - 
Based on the graph above I found that on the top of the list we got Lumber and Natural Gas today and on the bottom Lean Hogs and Live Cattle. Gold is neutral on the list, which is sign of the sideways regime... Key e: Resistance: $1,870 Support level: $1,850 November 20, 2020 : EUR/USD daily technical review and trade recommendations. 2020-11-20 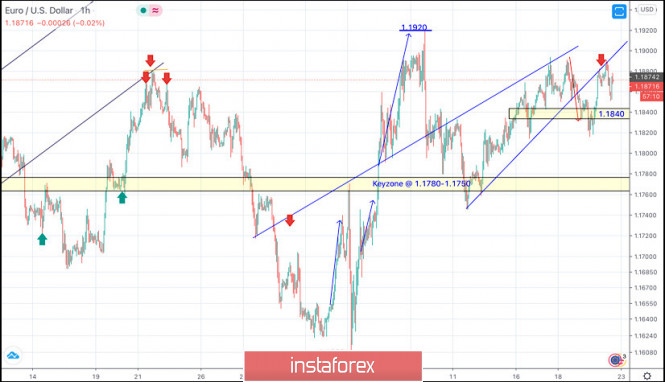
Recently, Two opportunities for SELL Entries were offered upon the recent upside movement towards 1.1880-1.1900. All target levels were achieved. Evident signs of bullish reversal were demonstrated around the recent price levels of 1.1600. Shortly after, the EUR/USD pair has demonstrated a significant BUYING Pattern after the recent upside breakout above the depicted price zone (1.1750-1.1780) was achieved. As mentioned in the previous article, the pair has targeted the price levels around 1.1920 which exerted considerable bearish pressure bringing the pair back towards 1.1800 which constituted a prominent KEY-Zone for the EUR/USD pair. Recently, the price zone around 1.1840 was mentioned as a prominent KeyZone to be watched for Price Action. Since, then, the pair has been failing to breakthrough below it. Bearish closure below the price zone of 1.1840 is needed to enhance a quick bearish decline towards 1.1750. Trade Recommendations :- Currently, the price zone around 1.1880 ( backside of the broken trendline ) stand as significant Resistance-Zone to offer a valid SELL Entry. Exit level should be placed above 1.1920 November 20, 2020 : EUR/USD Intraday technical analysis and trade recommendations. 2020-11-20 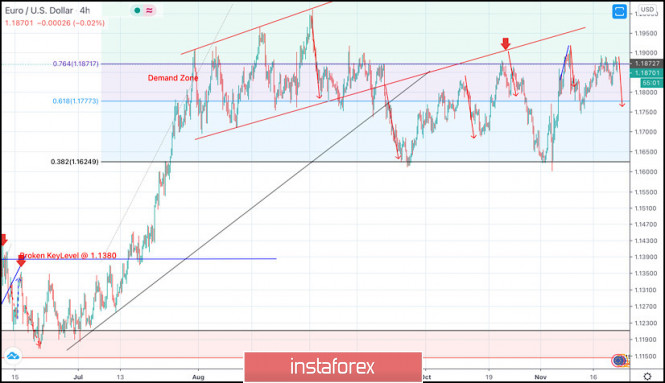
Intraday traders should have noticed the recent bearish closure below 1.1700. This indicated bearish domination for the market on the short-term. However, the EURUSD pair has failed to maintain sufficient bearish momentum below 1.1625 (38% Fibonacci Level). Instead, another bullish breakout was being demonstrated towards 1.1870 which corresponded to 76% Fibonacci Level. As mentioned in previous articles, the price zone of 1.1870-1.1900 stood as a solid SUPPLY Zone corresponding to the backside of the broken channel. Moreover, the recent bearish H4 candlestick closure below 1.1770 was mentioned in previous articles to indicate a valid short-term SELL Signal. All bearish targets were already reached at 1.1700 and 1.1630 where the current bullish recovery was initiated. The curren bullish pullback towards the price zone of 1.1870-1.1900 is supposed to be considered for signs of bearish rejection and another valid SELL Entry. S/L should be placed just above 1.1950. Bearish closure and persistence below 1.1777 (61.8% Fibonacci Level) is needed to enhance further bearish decline at least towards 1.1630. Otherwise, another bullish pullback towards 1.1870-1.1900 should be considered for another valid SELL Entry. November 20, 2020 : GBP/USD Intraday technical analysis and trade recommendations. 2020-11-20 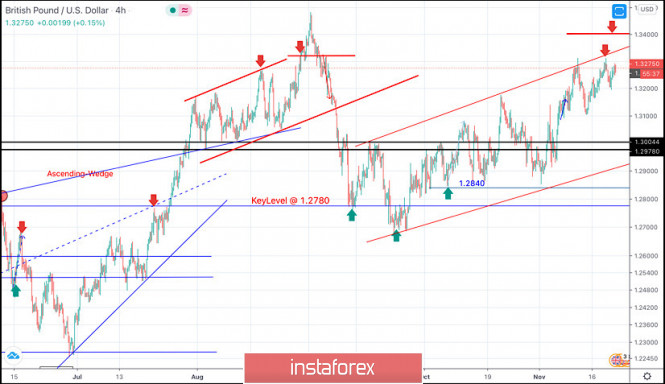
In July, the GBP/USD pair has expressed an Ascending Flag Pattern above the price level of 1.2780. Shortly after, bullish persistence above the price zone of 1.3300 was achieved. This was supposed to allow bullish pullback to pursue towards 1.3400 as a final projection target for the suggested pattern. However, the GBP/USD pair failed to do so. Instead, another bearish movement was targeting the price level of 1.2840 and 1.2780 where bullish SUPPORT existed allowing another bullish movement initially towards 1.3000 which failed to maintain sufficient bearish momentum. That's why, the recent bullish breakout above 1.3000 has enabled further bullish advancement towards 1.3250-1.3270 where the upper limit of the new movement channel came to meet the GBP/USD pair. Upon the current bullish pullback, price action should be watched around the price levels of (1.3270-1.3290) for signs of bearish pressure as a valid SELL Entry can be offered. Initial bearish target would be located at 1.3000. While S/L should be placed above 1.3330.
Author's today's articles: Ivan Aleksandrov  Ivan Aleksandrov Ivan Aleksandrov Andrey Shevchenko  Andrey Shevchenko Andrey Shevchenko Mourad El Keddani  Was born in Oujda, Morocco. Currently lives in Belgium. In 2003 obtained B.S. in Experimental Sciences. In 2007 obtained a graduate diploma at Institut Marocain Specialise en Informatique Applique (IMSIA), specialty – Software Engineering Analyst. In 2007–2009 worked as teacher of computer services and trainer in a professional school specializing in computer technologies and accounting. In 2005 started Forex trading. Authored articles and analytical reviews on Forex market on Forex websites and forums. Since 2008 performs Forex market research, and develops and implements his own trading strategies of Forex analysis (especially in Forex Research & Analysis, Currency Forecast, and Recommendations and Analysis) that lies in: Numerical analysis: Probabilities, equations and techniques of applying Fibonacci levels. Classical analysis: Breakout strategy and trend indicators. Uses obtained skills to manage traders' accounts since 2009. In April 2009 was certified Financial Technician by the International Federation of Technical Analysts. Winner of several social work awards: Education Literacy and Non-Formal Education (in Literacy and Adult Education in The National Initiative for Human Development). Was born in Oujda, Morocco. Currently lives in Belgium. In 2003 obtained B.S. in Experimental Sciences. In 2007 obtained a graduate diploma at Institut Marocain Specialise en Informatique Applique (IMSIA), specialty – Software Engineering Analyst. In 2007–2009 worked as teacher of computer services and trainer in a professional school specializing in computer technologies and accounting. In 2005 started Forex trading. Authored articles and analytical reviews on Forex market on Forex websites and forums. Since 2008 performs Forex market research, and develops and implements his own trading strategies of Forex analysis (especially in Forex Research & Analysis, Currency Forecast, and Recommendations and Analysis) that lies in: Numerical analysis: Probabilities, equations and techniques of applying Fibonacci levels. Classical analysis: Breakout strategy and trend indicators. Uses obtained skills to manage traders' accounts since 2009. In April 2009 was certified Financial Technician by the International Federation of Technical Analysts. Winner of several social work awards: Education Literacy and Non-Formal Education (in Literacy and Adult Education in The National Initiative for Human Development).
Languages: Arabic, English, French and Dutch.
Interests: Algorithm, Graphics, Social work, Psychology and Philosophy. Irina Manzenko  Irina Manzenko Irina Manzenko Pavel Vlasov  No data No data Petar Jacimovic  Petar was born on July 08, 1989 in Serbia. Graduated from Economy University and after has worked as a currency analyst for large private investors. Petar has been involved in the world of finance since 2007. In this trading he specializes in Volume Price Action (volume background, multi Fibonacci zones, trend channels, supply and demand). He also writes the market analytical reviews for Forex forums and websites. Moreover Petar is forex teacher and has wide experience in tutoring and conducting webinars. Interests : finance, travelling, sports, music "The key to success is hard work" Petar was born on July 08, 1989 in Serbia. Graduated from Economy University and after has worked as a currency analyst for large private investors. Petar has been involved in the world of finance since 2007. In this trading he specializes in Volume Price Action (volume background, multi Fibonacci zones, trend channels, supply and demand). He also writes the market analytical reviews for Forex forums and websites. Moreover Petar is forex teacher and has wide experience in tutoring and conducting webinars. Interests : finance, travelling, sports, music "The key to success is hard work" Mohamed Samy  Born November 18, 1966, in Egypt. In 1990 graduated from the Faculty Of Engineering, Alexandria University. In 2000 started to follow financial markets. Took a higher diploma in investing and finance in 2008 and also CMT in 2009. Started at the Financial World as an analyst, then worked as a technical analysis consultant at Misr Financial Investments Co. Since 2005 has been working on the Stock Exchange. Has been familiar with Forex since December 2005. Being a member of the Egyptian Society of Technical Analysis, attends seminars and conferences dedicated to financial markets. Is a member of the American Market Technicians Association. Interests: football, reading, volleyball, swimming, movies Born November 18, 1966, in Egypt. In 1990 graduated from the Faculty Of Engineering, Alexandria University. In 2000 started to follow financial markets. Took a higher diploma in investing and finance in 2008 and also CMT in 2009. Started at the Financial World as an analyst, then worked as a technical analysis consultant at Misr Financial Investments Co. Since 2005 has been working on the Stock Exchange. Has been familiar with Forex since December 2005. Being a member of the Egyptian Society of Technical Analysis, attends seminars and conferences dedicated to financial markets. Is a member of the American Market Technicians Association. Interests: football, reading, volleyball, swimming, movies
Subscription's options management Theme's:
Fundamental analysis, Fractal analysis, Wave analysis, Technical analysis, Stock Markets
Author's :
A Zotova, Aleksey Almazov, Alexander Dneprovskiy, Alexandr Davidov, Alexandros Yfantis, Andrey Shevchenko, Arief Makmur, Dean Leo, Evgeny Klimov, Fedor Pavlov, Grigory Sokolov, I Belozerov, Igor Kovalyov, Irina Manzenko, Ivan Aleksandrov, l Kolesnikova, Maxim Magdalinin, Mihail Makarov, Mohamed Samy, Mourad El Keddani, Oleg Khmelevskiy, Oscar Ton, Pavel Vlasov, Petar Jacimovic, R Agafonov, S Doronina, Sebastian Seliga, Sergey Belyaev, Sergey Mityukov, Stanislav Polyanskiy, T Strelkova, Torben Melsted, V Isakov, Viktor Vasilevsky, Vladislav Tukhmenev, Vyacheslav Ognev, Yuriy Zaycev, Zhizhko Nadezhda
Edit data of subscription settings
Unsubscribe from the mailing list Sincerely,
Analysts Service | If you have any questions, you can make a phone call using one of the
InstaForex Toll free numbers right now:
|  | InstaForex Group is an international brand providing online trading services to the clients all over the world. InstaForex Group members include regulated companies in Europe, Russia and British Virgin Islands. This letter may contain personal information for access to your InstaForex trading account, so for the purpose of safety it is recommended to delete this data from the history. If you have received this letter by mistake, please contact InstaForex Customer Relations Department. |


No comments:
Post a Comment