| Technical analysis of GBP/USD pair for this week (Nov 2-7, 2020) 2020-11-02 Trend analysis The price from the level of 1.2941 (the close of the last weekly candle) is expected to decline to the 21 average EMA - 1.2870 (black thin line) this week. If this line is reached, it can work upwards with the goal at 1.2944 - the resistance line (white thick line). Considering that the resistance line is also reached, further growth of the pair is likely. 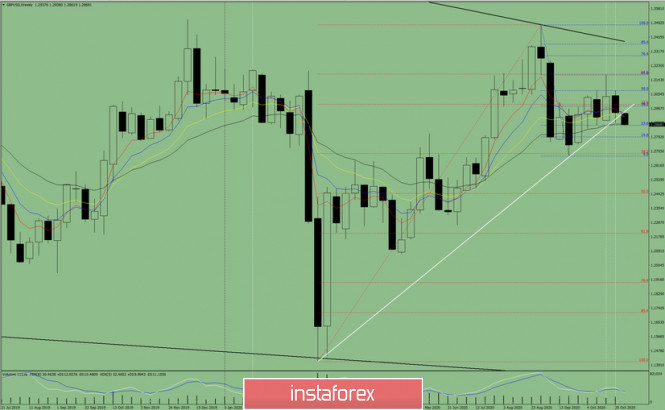
Figure 1: Weekly chart Comprehensive analysis: - indicator analysis - up; - Fibonacci levels - up; - volumes - up; - candlestick analysis - up; - trend analysis - up; - Bollinger lines - up; - monthly chart - up. An increase in the pair can be concluded based on the comprehensive analysis. The total calculation of candlestick of the GBP/USD pair on a weekly chart: the price is likely to have an upward trend this week, with the first lower shadow at the weekly white candle (Monday - down) and having a second upper shadow (Friday - down). The first lower target is the 21 average EMA 1.2870 (black thin line). If this line is reached, rising towards the goal at 1.2944 - the resistance line (white thick line) can be expected. After testing the resistance line, we can continue to further increase. An alternative scenario: the price will decline from the level of 1.2941 (closing of the last weekly candle), in order to reach the 21 average EMA - 1.2870 (black thin line). In case of reaching this line, a decline is likely in order to test the pullback level of 38.2% - 1.3175 (red dotted line). Technical recommendations for EUR/USD and GBP/USD on November 2 2020-11-02 EUR / USD 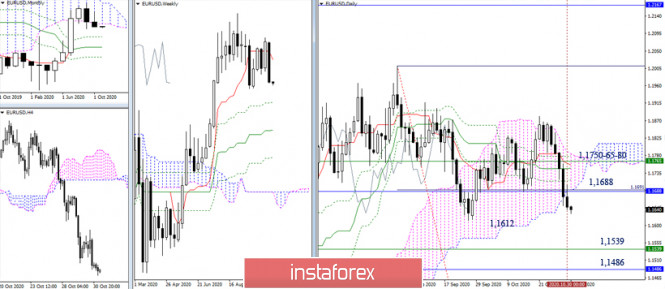 The bears managed to close the month of October below the monthly cloud. Now, the decline continues and the main task in this direction is to update the low extremum (1.1612) and consolidate below it, which will help us to restore the weekly and monthly downward correction. In this case, the nearest pivot points will be Fibo Kijun support (weekly 1.1539 + monthly 1.1486). If the bulls' position slow down and restore it to grow, the resistances around 1.1688 (lower limit of the daily and monthly clouds),as well as a cluster of resistances at the limits 1.1750-65-80 (daily cross + weekly Tenkan + upper limit of the daily cloud) can be noted. 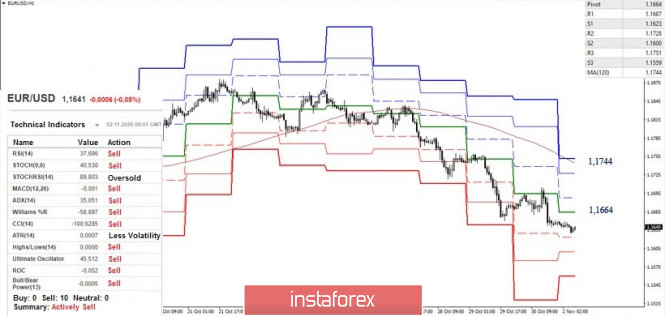 Meanwhile, the downward trend can be seen developing in the smaller time frame, which is supported by all analyzed technical tools. The downside benchmarks within the day in the form of classical pivot levels are located today at 1.1623 - 1.1600 - 1.1559. The development of an upward correction will lead to testing the central pivot level (1.1664), which will lead to traders' fairly large margin of safety. In turn, the correction can develop up to a weekly long-term trend (1.1744), this area is strengthened by the resistance of the larger time frames (1.1750-65-80), so it is strategically important not only for lower time frames, but also for higher ones. In this direction, the nearest resistances can be noted at 1.1687 (R1) – 1.1728 (R2). GBP / USD 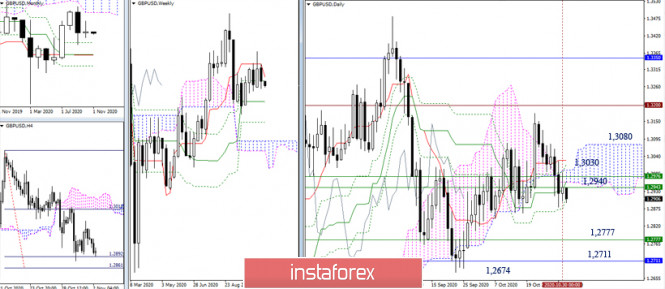 The bears tend to take the initiative in order to leave the confrontation zone. If this plan is fulfilled, their main interest will be concentrated in the area of 1.2777 (weekly Kijun) - 1.2711 (monthly Fibo Kijun) - 1.2674 (extreme low). However, the attraction of a large cluster of fairly strong levels of the larger time frames can still restrain the development of the situation. Thus, it will be possible to consider the possibility of the bulls only after a reliable consolidation above the cluster of resistances of 1.2940-1.3030 or possibly 1.3080, if the situation drags on for a while. 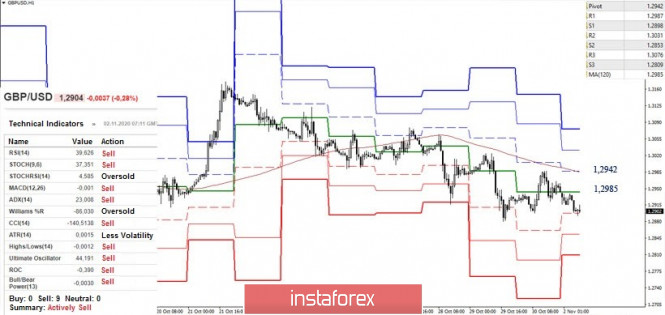 The bears in the smaller time frame are in the correction zone, despite their advantages. To further strengthen their moods, updating last week's low (1.2880) will be necessary. At the same time, further support levels can be noted at 1.2853 (S2) and 2809 (S3) today. The level of 1.2898 (S1) is currently being tested. The key resistance levels, in turn, are located at 1.2985 (central pivot level) and 1.2942 (weekly long-term trend). A consolidation above which will change the balance of power in the lower TF, but the bulls' further success will depend on passing the accumulation of resistance levels of the higher TF, which now strengthen the resistance within the day from the classical pivot levels (1.3031-1.3076). Ichimoku Kinko Hyo (9.26.52), Pivot Points (classical), Moving Average (120) Technical analysis of GBP/USD for November 02, 2020 2020-11-02 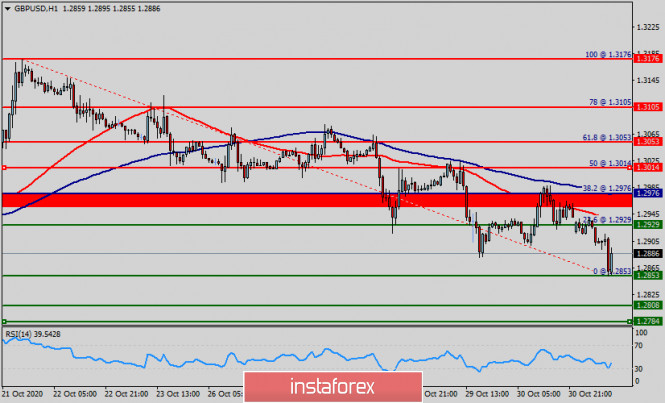 Overview : As expected last week, the GBP/USD pair continues to move downwards from the areas of 1.2976 and 1.2929. The pair dropped from the level of 1.2976 to 1.2853. Today, resistance is seen at the levels of 1.2976 and 1.3014. The level of 1.3014 coincides with a ratio of 50% Fibonacci on the H1 chart. So, we expect the price to set below the strong resistance at the levels of 1.3014 and 1.2976; because the price is in a bearish channel now. Amid the previous events, the price is still moving between the levels of 1.2976 and 1.2808. In overall, we still prefer the bearish scenario as long as the price is below the level of 1.2976. Furthermore, if the GBP/USD pair is able to break out the bottom at 1.2853, the market will decline further to 1.2808 (daily support 2). Next objective will be set at 1.2784. Hence, the price will fall into a bearish trend in order to go further towards the strong support at 1.2784. On the other hand, if the price closes above the strong resistance of 1.3014, the best location for a stop loss order is seen above 1.3014. Analysis and forecast for GBP/USD on November 2, 2020 2020-11-02 Taking into account the October trading that ended last Friday, in today's review we will consider the monthly timeframe, summarize the results of the past five days and determine the prospects of the British pound sterling in pair with the US dollar. There is no way to ignore the important events that the GBP/USD currency pair will experience this week. Let's start with them. So, tomorrow, November 3, the US presidential election will take place, which will undoubtedly have an impact on the price dynamics of the US currency. Most experts believe that Joe Biden's victory will lead to an increase in the craving for risky assets and a weakening of the US dollar. However, although Biden has been ahead of the incumbent Trump in polls for a long time, the US dollar is feeling quite confident and strengthening across a wide range of the market. In recent years, it has become a trend to challenge elections held in a particular country and not recognize their results, which leads to mass riots, and sometimes to a violent seizure of power. Given the fact that both US presidential candidates have more than hinted that they will not admit their defeat, it is likely that in the cradle of world democracy there will be serious problems with recognizing the results of the presidential election. I believe that this prospect, along with the invasion of the second wave of COVID-19, supports the US dollar as a protective asset. Indeed, in this situation, there can be no appetite for risk, the whole world is waiting with interest for the results of the US presidential election and what will follow. On Thursday, November 5, the Bank of England will announce its decision on the main interest rate, the volume of the asset purchase program, and publish the minutes of its meeting, which will show how the votes of the members of the monetary policy committee were distributed. As you know, there has long been talk that the British Central Bank is considering introducing negative interest rates. In my personal opinion, this will not happen yet and the rate will remain at 0.10%. However, the asset purchase program can increase from 745 to 845 billion pounds. Such a move by the Bank of England seems most likely to counteract the negative consequences of the coronavirus epidemic. As for negative rates, the English regulator will keep this trump card up its sleeve, because it is still unclear how the Brexit process will end - with a trade agreement or without a deal. On the last day of the trading week, data on the US labor market will be released, which is traditionally considered by investors to be one of the most important reports. The unemployment rate and the number of newly created jobs in non-agricultural sectors of the economy will clarify the situation with the recovery of the world's largest economy from the effects of the COVID-19 pandemic. Thus, we can assume with great confidence that this week will be the most important for the "British" in general and the GBP/USD pair in particular. Monthly 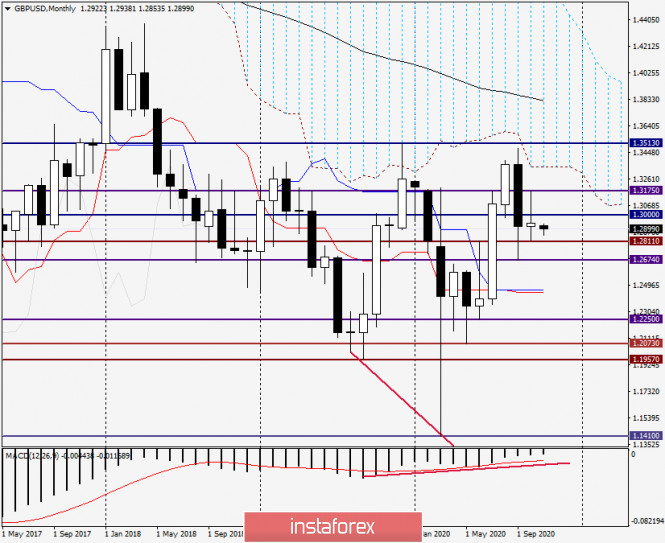
As you can see, unlike the single European currency, the pound sterling did not fall against the US dollar in October but even slightly strengthened its position. Nevertheless, the long upper shadow and the closing price below the significant psychological and technical level of 1.3000 leave more questions than answers about the further direction of the quote. In the meantime, November trading began with the strengthening of the US currency. I believe that a very important role will be played by the support level of 1.2811, where the minimum values of the previous month were shown, as well as the highs of October at 1.3175. If the bears push the support at 1.2811, the pair will decline to the next level of 1.2674. If the sellers' resistance breaks through at 1.3175, the quote will move to the lower border of the monthly cloud, which passes at 1.3350. Naturally, this will not happen today or tomorrow, but most senior timeframe is still considered. Weekly 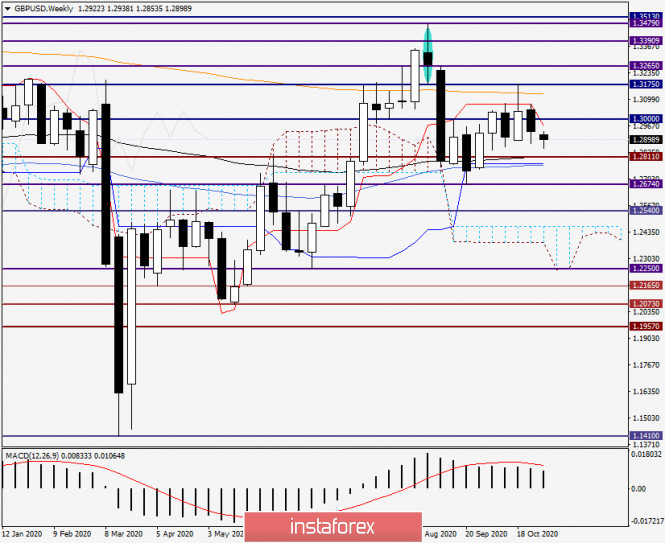
As for the results of trading on October 26-30, the pair lost 0.66% on the decline, which is much less than the same euro. Strong resistance to growth attempts is still provided by the red Tenkan line of the Ichimoku indicator, which has already turned down and is located under the iconic mark of 1.3000 at 1.2970. In my opinion, no less strong support is in the price zone of 1.2811-1.2770, where the black 89 exponential moving average is located right at the support level, and the blue Kijun line and 50 simple moving average are located below. It can be assumed that a true Tenkan breakout will open the way up, and a break of 50 MA will send the pair to the south. H1 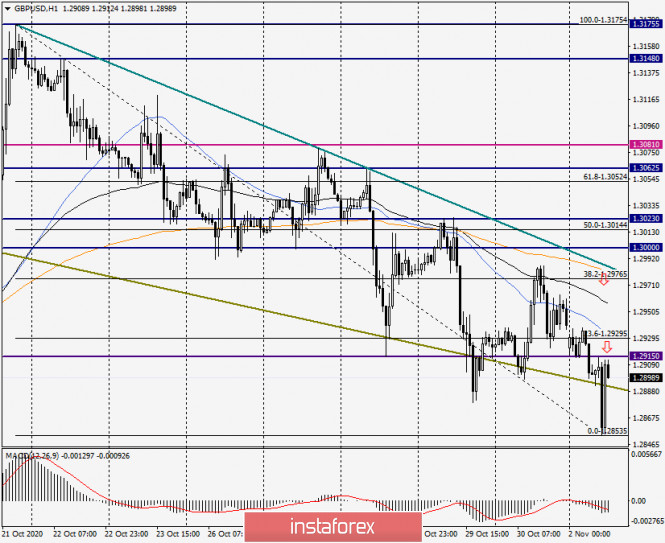
Today's trading for the pound/dollar pair opened with a small bearish gap, which was almost immediately closed, after which the pair is already showing increased volatility. After all, the main events are still ahead. In the meantime, I recommend considering both options for positioning on GBP/USD, but purchases already look late, and the trend on the hourly timeframe is descending. I suggest that the main trading idea for GBP/USD should be considered sales after corrective pullbacks to the strong technical zone of 1.2900-1.2930. Opening short positions at more favorable prices can be considered after the rise in the area of 1.2955-1.2980. The graph clearly shows the technical background for such recommendations. Trading idea for the NZD/USD pair 2020-11-02  On the eve of the US presidential elections, demand for the dollar increased significantly, thereby decreasing the values of many currencies, including the always overbought NZD / USD pair. 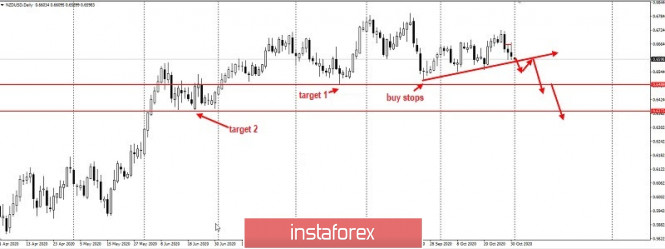 In fact, an interesting pattern has appeared in the pair, when a false breakout occurred at two highs, which indicates the serious intentions of traders to sell the currency pair: 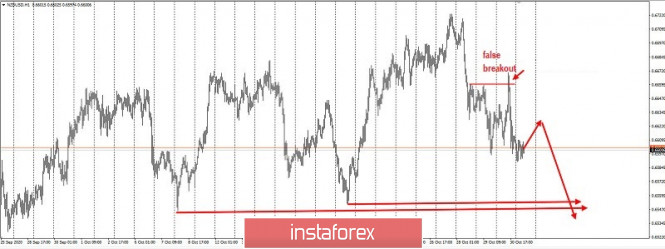 So, taking into account this bearish development, the best action is to open short positions at a pullback, targeting the price levels indicated at the charts above. Of course, risks are needed to be monitored and controlled to avoid losing profit. As we all know, trading in this market is very precarious and uncertain, but also very profitable if we use the right techniques "Price Action" and "Stop Hunting" were used for the strategy. Good luck! Technical analysis of EUR/USD pair for the month of November 2020-11-02 Trend analysis This month, we expect the decline to continue with the first goal at 1.1579 - the historical support level (blue dotted line). If this level is broken down, the next downside goal will be the level of 1.1484 is the 38.2% - a pullback level (red dotted line). It is highly likely that the US presidential election will affect the price movement. 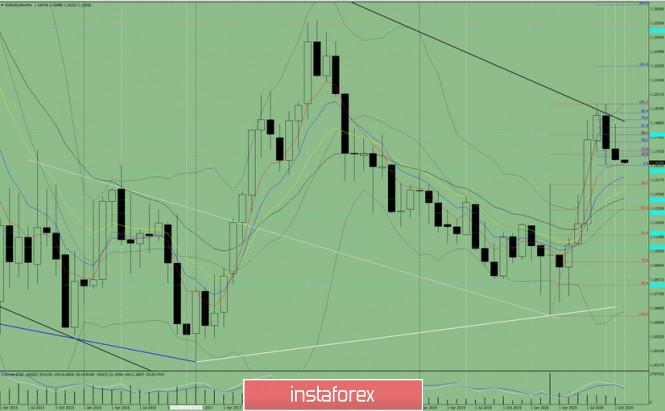 Figure: 1 (monthly chart). Indicator analysis: - indicator analysis - down; - Fibonacci levels - down; - volumes - down; - candlestick analysis - down; - trend analysis - down; - Bollinger lines - down; A decline can be concluded based on the comprehensive analysis. The overall result of calculating the candlestick of the EUR/USD pair on the monthly chart: the price will most likely have a downward trend this month, without the first upper shadow (the first week of the month - bottom) in the monthly black candlestick and second lower shadow (last week - black). General scenario: a decline from the level of 1.1647 (closing of the October monthly candlestick) with the goal at 1.1579 - the historical support level (blue dotted line) is likely. If this level breaks down, the next downside goal will be 1.1484 - pullback level of 38.2% (red dotted line). An alternative scenario, in turn, will be considered depending on the results of the US elections. An alternative scenario: growth from the level of 1.1647 (closing of the monthly candlestick in October) with the goal at 1.1762 - a pullback level of 38.2% (blue dotted line). If this level is broken upwards, the next upside goal will be the level of 1.1896 - resistance line (black bold line). Technical analysis of GBP/USD pair for the month of November 2020-11-02 Trend analysis It is possible that the price from the level of 1.2941 (closing of the October monthly candlestick) will decline this month with the first goal of 1.2867 - 21 EMA (black thin line). If this level is tested, it is possible to further move below towards the next goal of 1.2689 - a pullback level of 38.2% (red dashed line). 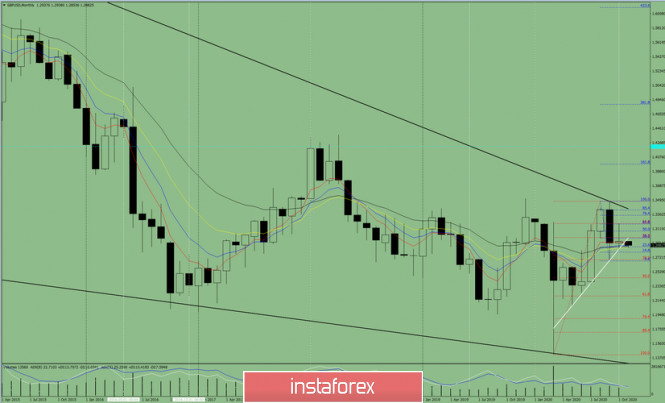
Figure: 1 (monthly chart). Indicator analysis: - indicator analysis - down; - Fibonacci levels - down; - volumes - down; - candlestick analysis - down; - trend analysis - down; - Bollinger lines - down; A decline can be concluded based on the comprehensive analysis. The overall result of calculating the candlestick of the GBP/USD pair on the monthly chart: the price will most likely decline without the first upper shadow (first week of the month - black) in the monthly black candlestick and second lower shadow (last week - black). Most likely scenario: the price from the level of 1.2941 (closing of the October monthly candlestick) is likely to decline this month with the first goal of 1.2867 - 21 EMA (black thin line). If this level is tested, it is possible to further move below towards the next goal of 1.2689 - a pullback level of 38.2% (red dashed line). An alternative scenario: a decline with the goal of 1.2868 - 21 EMA (black thin line) from the level of 1.2941 (closing of the October monthly candle) is possible. In case that this level is tested, rising towards the goal of 1.2992 - a pullback level of 38.2% (red dashed line) can be considered. If this level is broken upwards, we can continue to further rise towards the level of 1.3075 - a pullback level of 50% (blue dashed line). Trading recommendations for the EUR/USD pair on November 2 2020-11-02 Last Friday, the EUR / USD pair managed not only to keep the downward interest in the market, but also consolidate the quote below the price level of 1.1650 in the four-hour time frame, which opens up even greater prospects for sellers. As a result, the recovery relative to the price movement from 1.1612 to 1.1880 is almost complete, and only a breakout from the local low of September 25 remains. This means that we are very close to observing a trend change in the medium-term. In fact, there are already plenty of signals for a downward development, both in terms of technical and fundamental analysis. This suggests that speculation can be very unpredictable and high, thus, traders should be prepared for sharp price changes during the current week. And if we look at the M15 chart and analyze all the trades set up last Friday, we will see that a wave of short positions appeared during the American session, as a result of which a consolidation below 1.1650 occurred both in the four-hour and daily period. It gave a daily dynamics of 65 points, which is 12% below the average level. Yes, volatility is low, but it was enough to break price level 1.1650. As for the dynamics of the whole October, a value of 66 points is recorded, which is 12% below the average level. In comparison with the dynamics for September, there is a deceleration of 12.6%. This indicates that there is a characteristic slowdown, but in terms of speculation, nothing has changed. As for the ideas on the previous review , such a downward development is already expected, and this breakout only confirms the earlier forecast. Thus, in the daily chart, there is a chance that the medium-term trend will change from bullish to bearish, in which the price will move towards the values: 1.1550; 1.1350; 1.1180; 1.1000. With regards to news, a preliminary estimate on the EU's GDP was released last Friday, and it indicated a slowdown in economic recession from -14.7% to -4.3%. Although it is better than the forecasts, it is only a rebound after the economic collapse in the second quarter. At the same time, preliminary data on inflation was also published, where consumer prices remain in the deflationary border, which aggravates the economic recovery process -0.3% (y / y). As for hot topics such as the coronavirus, many countries have again implemented quarantine restrictions, in which some even returned to lockdown mode, closing shops, bars, restaurants and travel. Because of this, there is a high chance of a downturn again, which will pull the economy to the bottom.  Further development As we can see on the daily chart, the only move remaining is a breakout from the local low of September 25 (1.1612), however, this can only be achieved by consolidating the quote lower than 1.1600 in the four-hour time frame. In fact, such a movement will ensure the medium-term trend to change from bullish to bearish, in which the levels 1.1550; 1.1350; 1.1180; 1.1000 will be the coordinates. But, an alternative scenario could develop, if the quote rebounds from 1.1612 and stops moving downward in the market. 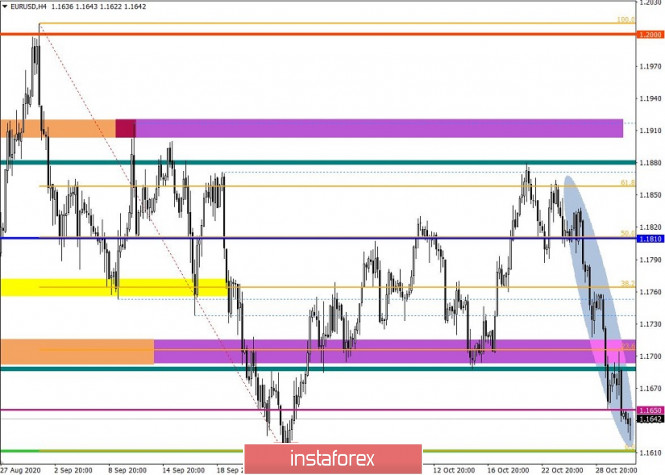 Indicator analysis Looking at the different sectors of time frames (TF), we can see that the indicators are currently signaling SELL, following the bearish mood in the market. Meanwhile, the minute period has a variable signal, and this is because of the price convergence at the local low of September 25. 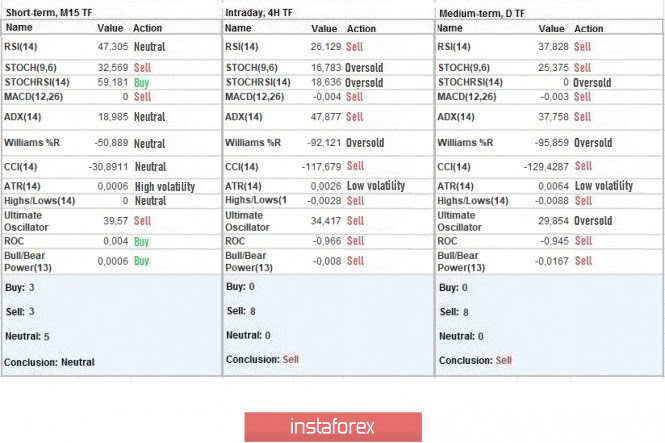 Weekly volatility / Volatility measurement: Month; Quarter; Year Volatility is measured relative to the average daily fluctuations, which are calculated every Month / Quarter / Year. (The dynamics for today is calculated, all while taking into account the time this article is published) Volatility is currently at 27 points, which is 63% below the average level. An acceleration is expected to appear soon, after the quote consolidates lower than 1.1600, or against the background of the US presidential elections. 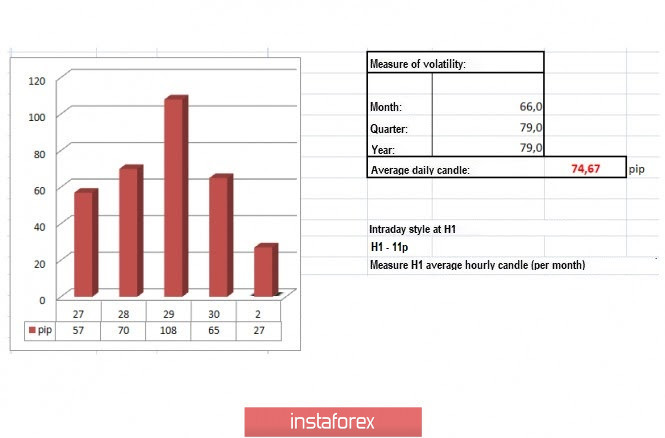 Key levels Resistance zones: 1.1650 *; 1.1700; 1.1880; 1.1910; 1.2000 ***; 1.2100 *; 1.2450 **; 1.2550; 1.2825. Support Zones: 1.1612 *; 1.1500; 1.1350; 1.1250 *; 1.1180 **; 1.1080; 1.1000 ***. * Periodic level ** Range level *** Psychological level Also check the trading recommendations for the GBP / USD pair here , or the brief trading recommendations here . EUR/USD: plan for the American session on November 2 (analysis of morning deals) 2020-11-02 To open long positions on EURUSD, you need: In my morning forecast for the second half of the day, I paid attention to purchases from the level of 1.1617, which we did not reach. There were no signals to enter the market in the area of 1.1651, which indicates a wait-and-see position of traders before tomorrow's US elections and the Federal Reserve meeting this week. This situation is more likely to play into the hands of euro buyers, so in the afternoon I recommend taking a closer look at this scenario. 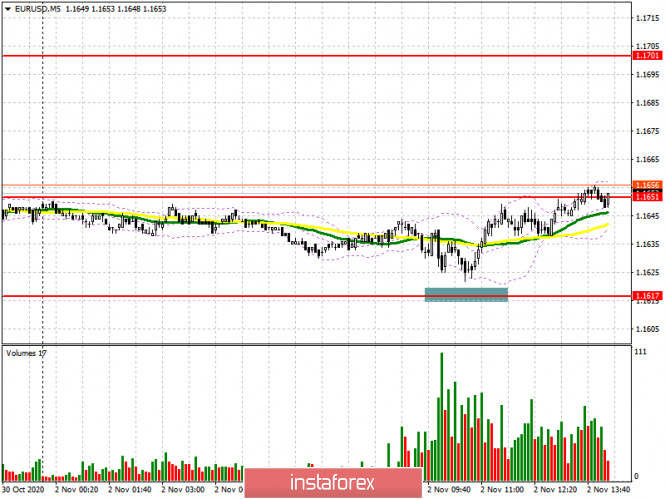
From a technical point of view, nothing much has changed. Buyers of the European currency still have the main task, which is to return the resistance of 1.1651 under their control. Given that the production figures were slightly better than economists' forecasts, the bulls managed to avoid a test of the minimum of 1.1617 and are now focused on the resistance of 1.1651. Only a consolidation above this level with a test of it from top to bottom will be a signal to open long positions in the expectation of recovery of EUR/USD to the resistance area of 1.1701, just below which are the moving averages that play on the side of buyers. In this case, the trade may move to the side channel. With growth above 1.1701, the bulls' goal will be a maximum of 1.1754, where I recommend fixing the profits. If the pressure on the euro persists in the second half of the day, and this will happen only in the case of very good data on the ISM manufacturing index in the US, you can only consider buying EUR/USD if there is a false breakdown at 1.1617. In case of bad macroeconomic statistics, I recommend postponing long positions only until the test of the next large minimum in the area of 1.1585, based on a correction of 15-20 points within the day. To open short positions on EURUSD, you need to: Sellers need to form a false breakout in the resistance area of 1.1651, which is gradually being smeared by the market. Therefore, you can rush to sell from this level after a confident formation of a false breakout there. If the signal is not very clear to you, it is best to refrain from opening short positions in the continuation of the emerging trend. If the pressure on the euro returns, the first target will be at least 1.1617, but I recommend taking profit only after the pair reaches the support of 1.1585. If the data on manufacturing activity in the US turns out to be worse than economists' forecasts, and the bears do not show activity in the resistance area of 1.1651, it is best to postpone sales until the test of Friday's high of 1.1701 or open short positions immediately for a rebound from the resistance of 1.1754, based on a correction of 15-20 points within the day. 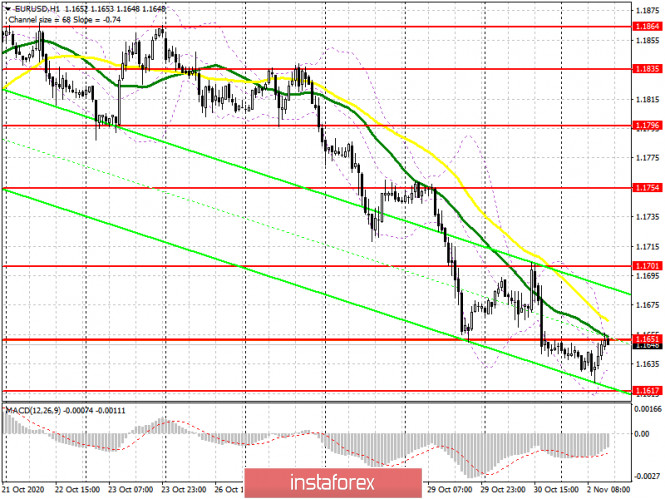
Let me remind you that the COT report (Commitment of Traders) for October 27 recorded a reduction in both long and short positions. But despite this, buyers of risky assets believe in the continuation of the bull market and prefer to act cautiously. Thus, long non-profit positions fell from 229,878 to 217,443, while short non-profit positions also fell to 61,888 from 63,935. The total non-commercial net position fell to 155,555 from 165,943 a week earlier. However, bullish sentiment on the euro remains quite high in the medium term. The stronger the euro declines against the US dollar at the end of this year, the more attractive it will be for new investors, especially after the US presidential election, when additional pressure on the market on this issue will ease. Signals of indicators: Moving averages Trading is below 30 and 50 daily moving averages, which indicates a further decline in the euro. Note: The period and prices of moving averages are considered by the author on the hourly chart H1 and differ from the general definition of the classic daily moving averages on the daily chart D1. Bollinger Bands Volatility has decreased significantly, which does not give a signal to enter the market. Description of indicators - Moving average (moving average determines the current trend by smoothing out volatility and noise). Period 50. The graph is marked in yellow.
- Moving average (moving average determines the current trend by smoothing out volatility and noise). Period 30. The graph is marked in green.
- MACD indicator (Moving Average Convergence / Divergence - moving average convergence / divergence) Fast EMA period 12. Slow EMA period 26. SMA period 9
- Bollinger Bands (Bollinger Bands). Period 20
- Non-profit speculative traders, such as individual traders, hedge funds, and large institutions that use the futures market for speculative purposes and meet certain requirements.
- Long non-commercial positions represent the total long open position of non-commercial traders.
- Short non-commercial positions represent the total short open position of non-commercial traders.
- Total non-commercial net position is the difference between the short and long positions of non-commercial traders.
EUR/USD analysis for November 02 2020 - Downside target at the price of 1.1620 reached but potential for next downside target and test of 1.1500 2020-11-02 ECB's Rehn: Inflation expectations are stuck too low - Says Fed review conclusions must be evaluated
- Hopes that ECB will adopt a 'clearly' symmetrical target
- Says monetary policy strategy should be reviewed every five years going forward
Nothing that really stands out from Rehn, as he is mainly just reaffirming the current situation. As for the current ECB strategy review, it was supposed to have been done by now but has been dragged to next year because of the virus crisis. The headline supports the narrative that more easing action is to follow next month. Further Development 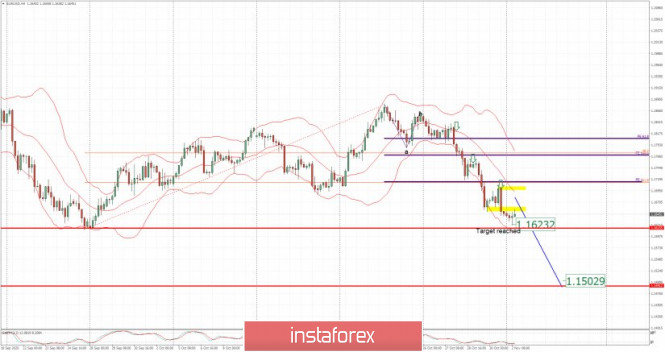
Based on the graph above I found that on the top of the list we got Lumber and Feeder Catt;e today and on the bottom VIX and Gasoline RBOB Key Levels: Resistance: 1,1650 and 1,1700 Support level: 1,15 EUR/USD: What are the options USD have? 2020-11-02 
The US dollar showed its maximum growth last Friday, since September ended. This is primarily due to the rising cases of COVID-19 in Europe and the uncertainty pre-election in the United States. Today, the indicated currency is trying to keep the advantage gained earlier, trading above the mark of 94 points. The long-awaited US presidential election will take place on Tuesday. According to some sources, although the chances of Joe Biden winning are now estimated at 89%, many experts believe that we should not make early conclusions yet because of what happened during the 2016 elections. Mr. Donald Trump has recently managed to somewhat narrow the gap, especially in key fluctuating states such as Florida, Wisconsin and Michigan. If he will be re-elected, the US dollar is expected to rise against the currencies of the G10 countries. On the contrary, if Mr. Joe Biden wins, the US dollar is expected to weaken. In case that the election results will be delayed or if something controversial appeared after that, this will lead to a rise in volatility in the currency market. If this happens, the USD may strengthen amid increasing demand for defensive assets. Experts from Commonwealth Bank of Australia noted that the currency volatility may increase after the election day, since it is possible that the losing candidate will question the election results. If we recall the 2016 election, it took around a month to resolve the disagreement. In the 24 hours after the US presidential election in 2016, the EUR/USD trading range was 300 points. If one of the candidates refuses to recognize the results of the upcoming vote, the fluctuations may be more dramatic. Last Friday, the classic pair tried to recover around the level of 1.1700, however, it pulled back so it closed the day around the level of 1.1645. In terms of news background, ECB's head, Christine Lagarde, signaled that markets should expect new stimulus from the regulator in December. She also warned that the eurozone could face another recession if the region's economy returns to the compression zone in the fourth quarter after rebounding a quarter earlier. After realizing that Europe is ahead of the United States in terms of quantitative easing and quarantine restrictions, it triggered a sell-off in the Euro last week and helped strengthen the US dollar. If the pressure on the single European currency continues in November, the EUR/USD pair may well update the September lows located around 1.1600 after the US presidential election. Analysis of Gold for November 02,.2020 - Potential for another downside cycle and test of $1.866 2020-11-02 Goldman Sachs cuts European growth forecasts amid virus resurgence, lockdown measures No surprises here - Euro area Q4 GDP -2.3% (+2.2% previously)
- UK Q4 GDP -2.4% (+3.6% previously)
I always make mention that when it comes to forecasts, especially during this time, take them with a pinch of salt. They mean little considering that there is no certainty on how the virus situation is going to progress and how governments will respond. If anything else, just use these as a sentiment guide rather than a predictor of sorts. 
Further Development 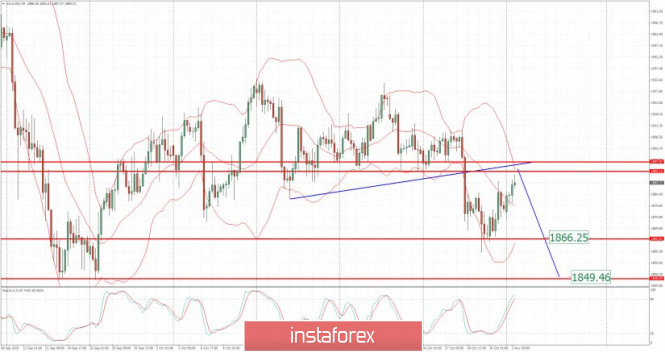
Analyzing the current trading chart of Gold, I found that the Gold is near the critical pivot resistance at the price of $1,895/$1,897 and that there is potential for the downside rotation. 1-Day relative strength performance Finviz 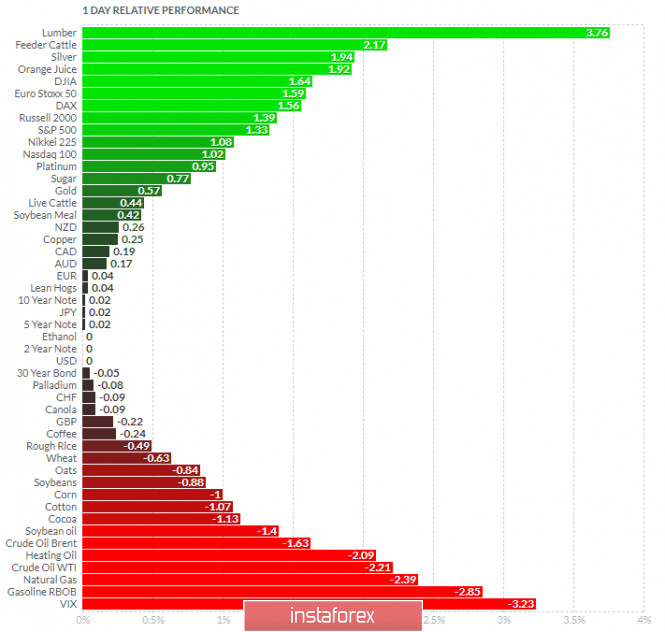
Based on the graph above I found that on the top of the list we got Lumber and Feeder Catt;e today and on the bottom VIX and Gasoline RBOB Gold is positive on the list but with potential overbought condition... Key Levels: Resistance: $1,895 Support level: $1,866 and $1,849
Author's today's articles: Sergey Belyaev  Born December 1, 1955. In 1993 graduated from Air Force Engineering Academy. In September 1999 started to study Forex markets. Since 2002 has been reading lectures on the technical analysis . Is fond of research work. Created a personal trading system based on the indicator analysis. Authored the book on technical analysis "Calculation of the next candlestick". At present the next book is being prepared for publishing "Indicator Analysis of Forex Market. Trading System Encyclopedia". Has created eleven courses on indicator analysis. Uses classical indicators. Works as a public lecturer. Held numerous seminars and workshops presented at international exhibitions of financial markets industry. Is known as one of the best specialists in the Russian Federation researching indicator analysis. Born December 1, 1955. In 1993 graduated from Air Force Engineering Academy. In September 1999 started to study Forex markets. Since 2002 has been reading lectures on the technical analysis . Is fond of research work. Created a personal trading system based on the indicator analysis. Authored the book on technical analysis "Calculation of the next candlestick". At present the next book is being prepared for publishing "Indicator Analysis of Forex Market. Trading System Encyclopedia". Has created eleven courses on indicator analysis. Uses classical indicators. Works as a public lecturer. Held numerous seminars and workshops presented at international exhibitions of financial markets industry. Is known as one of the best specialists in the Russian Federation researching indicator analysis. Zhizhko Nadezhda  Graduated from Irkutsk State University. Having acquainted with Forex market in 2008, followed the courses in the International Academy of Stock Exchange Trading. The agenda was so exiting that she moved to St. Petersburg in order to get professional education. Obtained a diploma of the retraining course on the discipline Exchange market and stock market issues, defended the graduation paper with distinction on the subject "Modern technical indicators as the basis of the trading system". At the moment obtains a master degree in International Banking Institute on specialty Financial markets and investments. Apart from trading is occupied with development of trading systems and formalization of the working strategies using Ichimoku indicator. At the moment is working on the book dedicated to the peculiarities of Ichimoku indicator and its operating methods. Interests: yoga, literature, travelling and photograph. "You can only get smarter by playing a smarter opponent" Basics of Chess play, 1883 "Successful people change by themselves, the others are changed by life" Jim Rohn Graduated from Irkutsk State University. Having acquainted with Forex market in 2008, followed the courses in the International Academy of Stock Exchange Trading. The agenda was so exiting that she moved to St. Petersburg in order to get professional education. Obtained a diploma of the retraining course on the discipline Exchange market and stock market issues, defended the graduation paper with distinction on the subject "Modern technical indicators as the basis of the trading system". At the moment obtains a master degree in International Banking Institute on specialty Financial markets and investments. Apart from trading is occupied with development of trading systems and formalization of the working strategies using Ichimoku indicator. At the moment is working on the book dedicated to the peculiarities of Ichimoku indicator and its operating methods. Interests: yoga, literature, travelling and photograph. "You can only get smarter by playing a smarter opponent" Basics of Chess play, 1883 "Successful people change by themselves, the others are changed by life" Jim Rohn Mourad El Keddani  Was born in Oujda, Morocco. Currently lives in Belgium. In 2003 obtained B.S. in Experimental Sciences. In 2007 obtained a graduate diploma at Institut Marocain Specialise en Informatique Applique (IMSIA), specialty – Software Engineering Analyst. In 2007–2009 worked as teacher of computer services and trainer in a professional school specializing in computer technologies and accounting. In 2005 started Forex trading. Authored articles and analytical reviews on Forex market on Forex websites and forums. Since 2008 performs Forex market research, and develops and implements his own trading strategies of Forex analysis (especially in Forex Research & Analysis, Currency Forecast, and Recommendations and Analysis) that lies in: Numerical analysis: Probabilities, equations and techniques of applying Fibonacci levels. Classical analysis: Breakout strategy and trend indicators. Uses obtained skills to manage traders' accounts since 2009. In April 2009 was certified Financial Technician by the International Federation of Technical Analysts. Winner of several social work awards: Education Literacy and Non-Formal Education (in Literacy and Adult Education in The National Initiative for Human Development). Was born in Oujda, Morocco. Currently lives in Belgium. In 2003 obtained B.S. in Experimental Sciences. In 2007 obtained a graduate diploma at Institut Marocain Specialise en Informatique Applique (IMSIA), specialty – Software Engineering Analyst. In 2007–2009 worked as teacher of computer services and trainer in a professional school specializing in computer technologies and accounting. In 2005 started Forex trading. Authored articles and analytical reviews on Forex market on Forex websites and forums. Since 2008 performs Forex market research, and develops and implements his own trading strategies of Forex analysis (especially in Forex Research & Analysis, Currency Forecast, and Recommendations and Analysis) that lies in: Numerical analysis: Probabilities, equations and techniques of applying Fibonacci levels. Classical analysis: Breakout strategy and trend indicators. Uses obtained skills to manage traders' accounts since 2009. In April 2009 was certified Financial Technician by the International Federation of Technical Analysts. Winner of several social work awards: Education Literacy and Non-Formal Education (in Literacy and Adult Education in The National Initiative for Human Development).
Languages: Arabic, English, French and Dutch.
Interests: Algorithm, Graphics, Social work, Psychology and Philosophy. Ivan Aleksandrov  Ivan Aleksandrov Ivan Aleksandrov Andrey Shevchenko  Andrey Shevchenko Andrey Shevchenko Vladislav Tukhmenev  Vladislav graduated from Moscow State University of Technologiy and Management. He entered the forex market in early 2008. Vladislav is a professional trader, analyst, and manager. He applies a whole gamut of analysis – technical, graphical, mathematical, fundamental, and candlestick analysis. Moreover, he forecasts the market movements using his own methods based on the chaos theory. Vladimir took part in development of trading systems devoted to fractal analysis. In his free time, Vladimir blogs about exchange markets. Hobbies: active leisure, sporting shooting, cars, design, and marketing. "I do not dream only of becoming the best in my field. I also dream about those who I will take with me along the way up." Vladislav graduated from Moscow State University of Technologiy and Management. He entered the forex market in early 2008. Vladislav is a professional trader, analyst, and manager. He applies a whole gamut of analysis – technical, graphical, mathematical, fundamental, and candlestick analysis. Moreover, he forecasts the market movements using his own methods based on the chaos theory. Vladimir took part in development of trading systems devoted to fractal analysis. In his free time, Vladimir blogs about exchange markets. Hobbies: active leisure, sporting shooting, cars, design, and marketing. "I do not dream only of becoming the best in my field. I also dream about those who I will take with me along the way up." Maxim Magdalinin  In 2005 graduated from the Academy of the Ministry of Internal Affairs of the Republic of Belarus, law faculty. Worked as a lawyer for three years in one of the biggest country's company. Besides the trading, he develops trading systems, writes articles and analytical reviews. Works at stock and commodity markets explorations. On Forex since 2006. In 2005 graduated from the Academy of the Ministry of Internal Affairs of the Republic of Belarus, law faculty. Worked as a lawyer for three years in one of the biggest country's company. Besides the trading, he develops trading systems, writes articles and analytical reviews. Works at stock and commodity markets explorations. On Forex since 2006. Petar Jacimovic  Petar was born on July 08, 1989 in Serbia. Graduated from Economy University and after has worked as a currency analyst for large private investors. Petar has been involved in the world of finance since 2007. In this trading he specializes in Volume Price Action (volume background, multi Fibonacci zones, trend channels, supply and demand). He also writes the market analytical reviews for Forex forums and websites. Moreover Petar is forex teacher and has wide experience in tutoring and conducting webinars. Interests : finance, travelling, sports, music "The key to success is hard work" Petar was born on July 08, 1989 in Serbia. Graduated from Economy University and after has worked as a currency analyst for large private investors. Petar has been involved in the world of finance since 2007. In this trading he specializes in Volume Price Action (volume background, multi Fibonacci zones, trend channels, supply and demand). He also writes the market analytical reviews for Forex forums and websites. Moreover Petar is forex teacher and has wide experience in tutoring and conducting webinars. Interests : finance, travelling, sports, music "The key to success is hard work" V Isakov  text text
Subscription's options management Theme's:
Fundamental analysis, Fractal analysis, Wave analysis, Technical analysis, Stock Markets
Author's :
A Zotova, Aleksey Almazov, Alexander Dneprovskiy, Alexandr Davidov, Alexandros Yfantis, Andrey Shevchenko, Arief Makmur, Dean Leo, Evgeny Klimov, Fedor Pavlov, Grigory Sokolov, I Belozerov, Igor Kovalyov, Irina Manzenko, Ivan Aleksandrov, l Kolesnikova, Maxim Magdalinin, Mihail Makarov, Mohamed Samy, Mourad El Keddani, Oleg Khmelevskiy, Oscar Ton, Pavel Vlasov, Petar Jacimovic, R Agafonov, S Doronina, Sebastian Seliga, Sergey Belyaev, Sergey Mityukov, Stanislav Polyanskiy, T Strelkova, Torben Melsted, V Isakov, Viktor Vasilevsky, Vladislav Tukhmenev, Vyacheslav Ognev, Yuriy Zaycev, Zhizhko Nadezhda
Edit data of subscription settings
Unsubscribe from the mailing list Sincerely,
Analysts Service | If you have any questions, you can make a phone call using one of the
InstaForex Toll free numbers right now:
|  | InstaForex Group is an international brand providing online trading services to the clients all over the world. InstaForex Group members include regulated companies in Europe, Russia and British Virgin Islands. This letter may contain personal information for access to your InstaForex trading account, so for the purpose of safety it is recommended to delete this data from the history. If you have received this letter by mistake, please contact InstaForex Customer Relations Department. |


No comments:
Post a Comment