| Indicator analysis. Daily review on the GBP/USD currency pair for November 16, 2020 2020-11-16 Trend analysis (Fig. 1). Today, the market from the level of 1.3187 (closing of Friday's daily candlestick) may continue to move upward with the goal of 1.3231 - a pullback level of 61.8% (blue dotted line). When testing this level, continue working upward with the goal of 1.3282, which is a pullback level of 85.4% (blue dotted line). 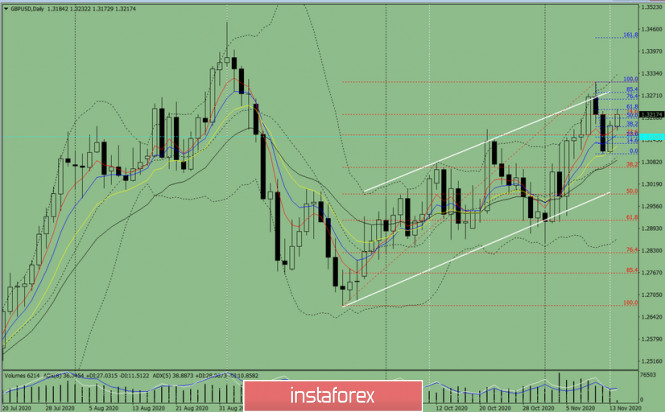
Figure 1 (Daily Chart). Comprehensive analysis: - Indicator analysis - up
- Fibonacci levels - up
- Volumes - up
- Candlestick analysis - down
- Trend analysis - up
- Bollinger bands - up
- Weekly chart - up
General conclusion: The price will try to continue moving upward today with the target of 1.3282 - the resistance line (white bold line). When testing this line, continue working up with the target of 1.3310-the upper fractal (red dotted line). Alternative scenario: from the level of 1.3187 (closing of the Friday's daily candlestick), the price may start moving upward with the goal of 1.3231 - a pullback level of 61.8% (blue dotted line). When testing this level, work downward with a target of 1.3159, which is a pullback level of 23.6% (red dotted line). Indicator Analysis. Daily review for the EUR/USD currency pair 11/16/20 2020-11-16 Trend analysis (Fig. 1). Today, the market may continue to move up from the level of 1.1835 (Friday's daily candle close), in order to reach the resistance line-1.1857 (white bold line). If this line will be tested, an upward movement will most likely continue with the target of 1.1920 at the upper fractal (red dotted line). 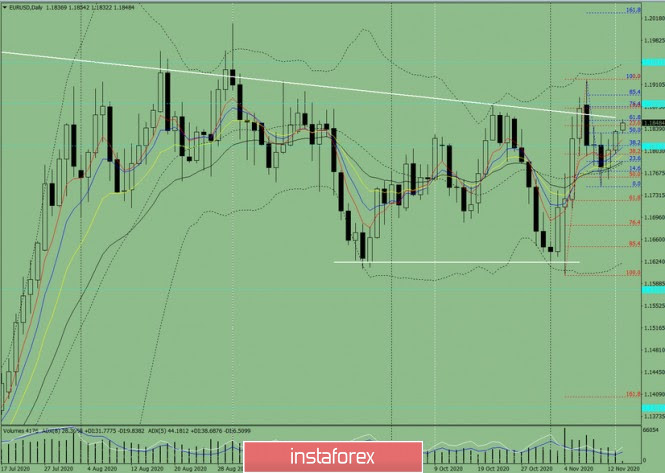 Figure 1 (daily chart). Complex Analysis: General Conclusion: Today, the price may move up to reach the resistance line-1.1857 (white bold line). If this line will be tested, the upward movement will most likely continue with the target of 1.1920 at the upper fractal (red dotted line). Alternative scenario: from the level of 1.1835 (closing of the Friday daily candle) it will go up to reach the resistance line of 1.1857 (white bold line). If this line will be tested, it will go down with the target of 1.1644 – a pullback level of 38.2% (red dotted line). Technical Analysis of EUR/USD for November 16, 2020 2020-11-16 Technical Market Outlook: The EUR/USD pair might have started another wave higher after 38% retracement of the last wave up had been tested. The move up looks like a bounce for now, but if the level of 1.1879 is violated, then the bulls will be in control of the market again and might push the price higher towards the swing high seen at the level of 1.1920. The strong and positive momentum supports the bullish short-term outlook for Euro. Weekly Pivot Points: WR3 - 1.2099 WR2 - 1.2008 WR1 - 1.1924 Weekly Pivot - 1.1834 WS1 - 1.1747 WS2 - 1.1659 WS3 - 1.1571 Trading Recommendations: Since the middle of March 2020 the main trend is on EUR/USD pair has been up, which can be confirmed by almost 10 weekly up candles on the weekly time frame chart and 4 monthly up candles on the monthly time frame chart. The recent correction towards the level of 1.1612 seems to be completed and now market is ready for another wave up. This means any local corrections should be used to buy the dips until the key technical support is broken. The key long-term technical support is seen at the level of 1.1445. The key long-term technical resistance is seen at the level of 1.2555. 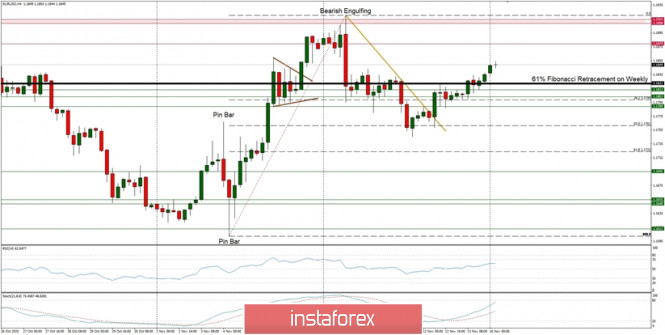
Technical Analysis of GBP/USD for November 16, 2020 2020-11-16 Technical Market Outlook: The GBP/USD had started a new trading week above the level of 1.3220 and due to the strong momentum might continue this move even higher. The nearest technical resistance is seen at the level of 1.3264 - 1.3283, so any violation of this zone will open the road towards the swing high seen at 1.3306. The local technical support is seen at the level of 1.3165 and 1.3121, so as long as GBP trades above this levels the outlook remains bullish. The higher time frame trend remains up as well with a target seen at the level of 1.3380. Weekly Pivot Points: WR3 - 1.3481 WR2 - 1.3397 WR1 - 1.3286 Weekly Pivot - 1.3197 WS1 - 1.3085 WS2 - 1.2994 WS3 - 1.2882 Trading Recommendations: The GBP/USD pair is in the down trend on the monthly time frame, but the recent bounce from the low at 1.1411 made in the middle of March 2020 looks very strong and might be a reversal swing. In order to confirm the trend change, the bulls have to break through the technical resistance seen at the level of 1.3518. All the local corrections should be used to enter a buy orders as long as the level of 1.2674 is not broken. 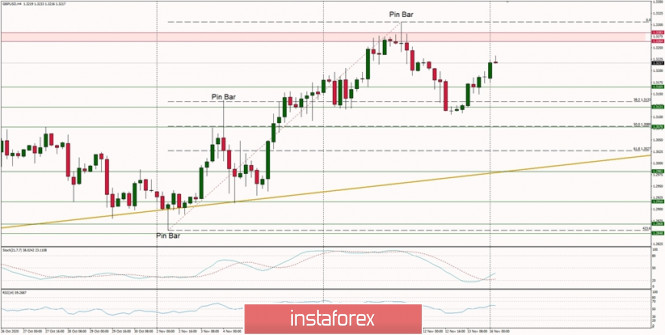
EUR/USD: plan for the European session on November 16. COT reports. Euro regains strength after weak data on the US economy 2020-11-16 To open long positions on EUR/USD, you need: Although we did not wait for some sort of market-entry signal last Friday, buyers of the euro still managed to seize the moment and strengthened their positions against the US dollar after the release of weak fundamental reports. The report on the sharp decline in consumer sentiment in the United States surprised with its numbers. This is primarily due to the lack of a compromise between Republicans and Democrats on a new package of measures to help the economy and the Americans, as well as because of the new wave of the coronavirus pandemic, which calls for measures of social distancing and isolation. The 5-minute chart clearly shows that there were no entry points to the market, since we did not reach any of the levels. 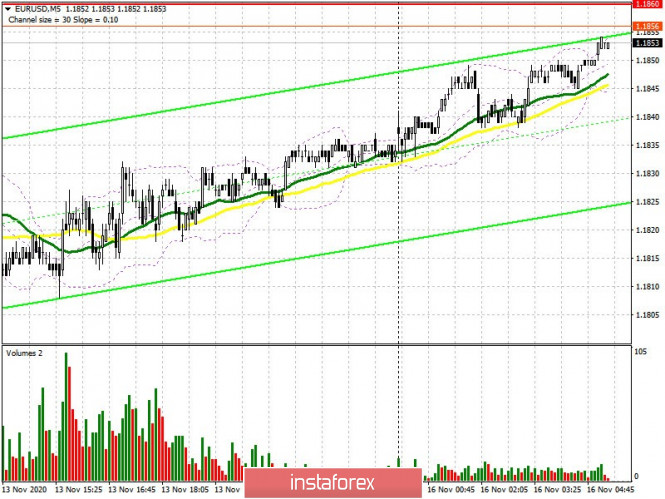 From a technical point of view, not much has changed either, but there are some changes. There is a new support at 1.1832, and buyers will focus on this particular level in the first half of the day. If the euro bulls manage to protect support at 1.1832, then forming a false breakout there will be a good entry point into long positions, in hopes for the pair to reach the resistance area of 1.1868, which is where the pair might temporarily stop growing. The next target will be the monthly high of 1.1915, where I recommend taking profits. No particularly important fundamental reports for the day, so if bulls are not active in the 1.1832 area, then it is possible for EUR/USD to return under this range. In this case, buyers will focus on protecting support at 1.1797 in the first half of the day. However, you can open long positions from it on the first test, based on a correction of 15-20 points within the day. A larger reversal in favor of buyers will occur if they manage to form a false breakout at 1.1743. To open short positions on EUR/USD, you need: The initial task of sellers is to return to the 1.1832 level, which appeared last Friday afternoon. Settling below 1.1832 and testing it from the bottom up produces a more convenient entry point for short positions, in hopes to bring back the downward trend. In this case, the nearest target of the bears will be the low of 1.1797. Testing this level will only indicate that the pair is stuck in a horizontal channel. Going beyond and settling below this range will lead EUR/USD to the lower border of the horizontal channel at 1.1743, where I recommend taking profit. Going beyond this area will increase the pressure on the pair and quickly pull it down to the low of 1.1701, which will indicate the resumption of a new bearish trend. If the bulls are stronger and continue to push the pair up following European Central Bank President Christine Lagarde's speech, then it is best not to rush to sell, and wait for the update of the larger resistance of 1.1868. However, you can only sell from this level if a false breakout appears there. I recommend opening short positions on EUR/USD immediately for a rebound, but only from the monthly high of 1.1915, based on a correction of 15-20 points within the day. 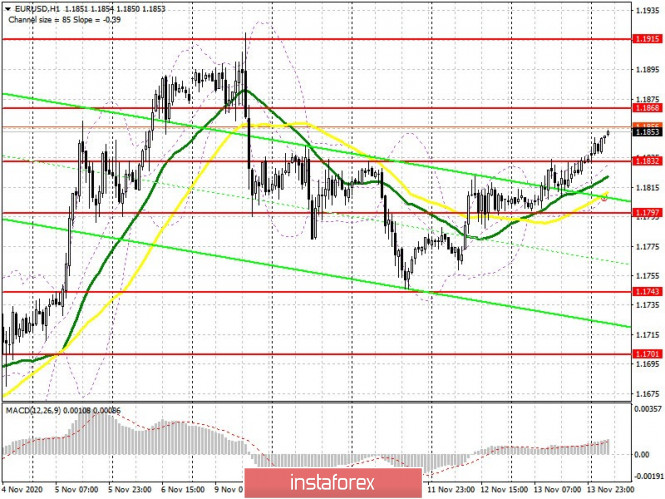 Let me remind you that the Commitment of Traders (COT) report for November 3 showed a reduction in long positions and an increase in short positions. Despite this, buyers of risky assets still believe that the bull market will go on, although they prefer to proceed with caution. Thus, long non-commercial positions fell from 217,443 to 208,237, while short non-commercial positions rose from 61,888 to 67,888. The total non-commercial net position fell to 140 349, from 155,555 a week earlier. Take note that the bullish sentiment on the euro remains rather high in the medium term, especially after Joe Biden's victory, who intends to endow the American economy with the next largest monetary aid package worth more than $2 trillion. Description of indicators - Moving average (moving average, determines the current trend by smoothing out volatility and noise). Period 50. It is marked in yellow on the chart.
- Moving average (moving average, determines the current trend by smoothing out volatility and noise). Period 30. It is marked in green on the chart.
- MACD indicator (Moving Average Convergence/Divergence — convergence/divergence of moving averages) Quick EMA period 12. Slow EMA period to 26. SMA period 9
- Bollinger Bands (Bollinger Bands). Period 20
- Non-commercial speculative traders, such as individual traders, hedge funds, and large institutions that use the futures market for speculative purposes and meet certain requirements.
- Long non-commercial positions represent the total long open position of non-commercial traders.
- Short non-commercial positions represent the total short open position of non-commercial traders.
- Total non-commercial net position is the difference between short and long positions of non-commercial traders.
GBP/USD: plan for the European session on November 16. COT reports. Pound buyers are approaching resistance at 1.3248, bracing for its breakout 2020-11-16 To open long positions on GBP/USD, you need: A fairly good signal to sell the British pound appeared last Friday afternoon. And it seemed like it went down, the movement gained 20 points three times, but then it stopped. The bad data on the deterioration of consumer sentiment in the US surprised with its numbers and also disappointed buyers of the US dollar. This is primarily due to the lack of a compromise between Republicans and Democrats on a new package of measures to help the economy and the Americans, as well as because of the new wave of the coronavirus pandemic, which forces them to resort to measures of social distancing and isolation. Let's take a look at the deal. If you look at the 5-minute chart, you will see how the bears formed a false breakout in the resistance area of 1.3172 and the pair returns to the area under this range, above which the bulls can no longer climb. Testing this level from the bottom up led to producing a signal to sell the pound, which I drew attention to in my Friday review. 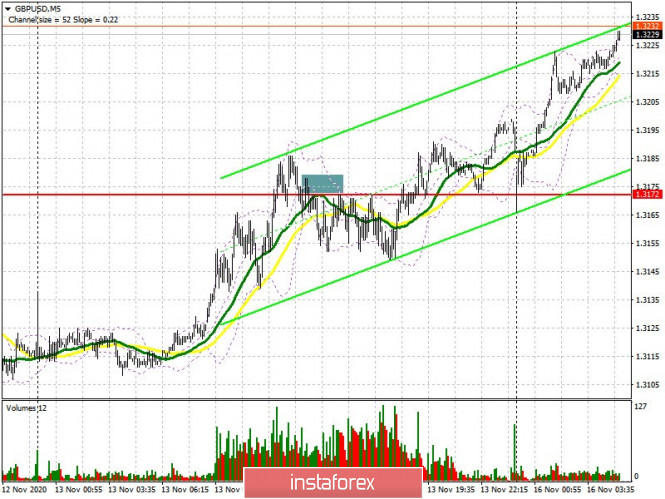 The situation for buyers of the pound has not changed much. It just changed the goals that the bulls will stick to at the beginning of this week. The initial challenge for the first half of the day is to defend support at 1.3172, which will only be tested if the bullish Asian momentum wanes. Forming a false breakout there will stop the bears, which will give confidence to buyers and return GBP/USD to the resistance area of 1.3248, which they are striving for. Speeches by representatives of the Bank of England, which are scheduled for today, can support the pound, provided that they do not mention negative interest rates, which, obviously, will be introduced early next year. In the meantime, getting the pair to settle above the resistance of 1.3248 forms a new entry point into long positions in hopes for GBP/USD to continue rising and reach the high of 1.3310, where I recommend taking profits. The next target will be resistance at 1.3378, but it will require a good reason for an update. In case bulls are not active in the 1.3172 area, it is best not to rush and hold off from long positions until a new low of 1.3106 has been tested, where you can buy the pound immediately on a rebound, counting on a correction of 20-30 points within the day. To open short positions on GBP/USD, you need: The bears have taken a wait-and-see attitude and the main focus is on protecting the resistance of 1.3248. How sellers behave at this level today will determine the pair's succeeding direction. If buyers are not active, then a false breakout in the 1.3248 area will be the first signal to open short positions in the pound, in hopes for it to fall to support 1.3172, which is now the middle of the horizontal channel. It will be possible to say that the bears have taken the market under their control only when they have successfully settled below 1.3172, which will quickly pull the pound to the lower border of this channel at 1.3106. Only its breakout will show that the bearish trend has returned, which could pull down the pound to new lows of 1.3034 and 1.2976, which is where I recommend taking profits. In case bears are not active at 1.3248, it is best to postpone short positions until the test of the monthly high of 1.3310, or sell the pound immediately on a rebound from resistance at 1.3378, counting on a correction of 20-30 points within the day. 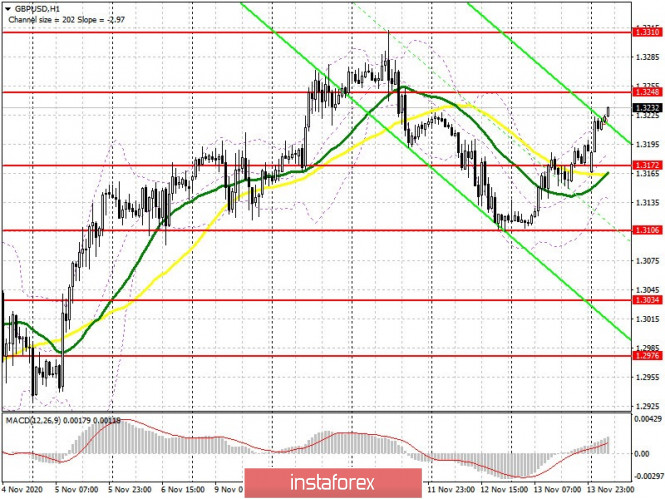 Let me remind you that the Commitment of Traders (COT) report for November 3 showed a reduction in long positions and a slight increase in short positions. Long non-commercial positions fell from 31,799 to 27,701. At the same time, short non-commercial positions slightly rose from 38,459 to 38,928. As a result, the negative non-commercial net position was 11,227 against 6,660 a week earlier, which indicates that the sellers of the British pound retain control and also shows their minimal advantage in the current situation. Indicator signals: Moving averages Trading is carried out above 30 and 50 moving averages, which indicates the likelihood of maintaining the bullish momentum formed during the Asian session. Note: The period and prices of moving averages are considered by the author on the H1 hourly chart and differs from the general definition of the classic daily moving averages on the daily D1 chart. Bollinger Bands In case the pair falls, support will be provided by the lower border of the indicator in the 1.3145 area. Description of indicators - Moving average (moving average, determines the current trend by smoothing out volatility and noise). Period 50. It is marked in yellow on the chart.
- Moving average (moving average, determines the current trend by smoothing out volatility and noise). Period 30. It is marked in green on the chart.
- MACD indicator (Moving Average Convergence/Divergence — convergence/divergence of moving averages) Quick EMA period 12. Slow EMA period to 26. SMA period 9
- Bollinger Bands (Bollinger Bands). Period 20
- Non-commercial speculative traders, such as individual traders, hedge funds, and large institutions that use the futures market for speculative purposes and meet certain requirements.
- Long non-commercial positions represent the total long open position of non-commercial traders.
- Short non-commercial positions represent the total short open position of non-commercial traders.
- Total non-commercial net position is the difference between short and long positions of non-commercial traders.
EUR/USD: Fed and ECB's financial measures will help the economy and currencies 2020-11-16  A lot of experts agree that strong financial injections from leading regulators such as the Fed and ECB, will help the suffering economy. The key currencies will then catch up, allowing the EUR/USD pair to consolidate in an upward direction. The worsening pandemic situation on both sides prevents the dynamics of the EUR/USD pair to be successful. The number of COVID-19 cases continues to rise, which puts increasing pressure on both the economies of America and Europe. In this case, the markets are looking forward to stimulus measures from the ECB and the Fed, which can give new impulse to key economies. Danske Bank experts believe that the EUR/USD pair will manage to break through the level of 1.2000, if the ECB will be the driver of the global economic recovery. In this scenario, the Fed is assigned to take the role of the main catalyst for inflation growth above the target level of 2%. The key to a successful global economic recovery will be a combination of factors such as an improved epidemiological situation in the world, progress in the Brexit negotiations in Europe, and positive developments in the US fiscal stimulus. Technically, the EUR/USD pair will reach new peaks, in case of a relatively favorable development of events in the euro's exchange rate to the US dollar. According to Danske Bank, this is a matter for the next three months. However, most analysts are doubting optimistic prospects for key currencies. Currently, the classic pair has to constantly confirm its importance, breaking through to new levels. Today, the EUR/USD pair was moving around the level of 1.1851-1.1852. The bank is confident that if the current trends continue, major currencies will continue to drift in the range of 1.1500-1.1900. The long-term prospects of the EUR/USD pair are also questionable. Analysts at Danske Bank agree with this, and so adhere to cautious forecasts, which are mainly aimed at deteriorating the dynamics of this pair. By now, their specialists have lowered their forecasts by 1-3 figures in the semi-annual and annual planning ranges. Danske Bank's calculations for the EUR/USD pair for 3 and 12 months provide for its dynamics in the range of 1.2000 and 1.1600, respectively. 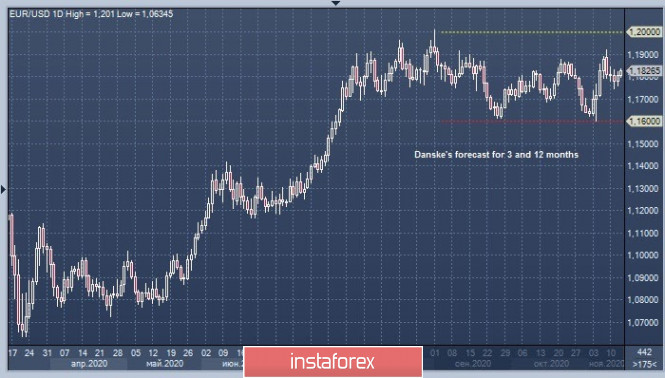 The US economy, whose main goal is to minimize the negative consequences of COVID-19, also has its own difficulties. Experts believe that the strengthening of the current problems will push regulators, in particular the Fed, to take new stimulating measures. In such a situation, we should not expect a quick return, since such measures imply a long-term effect. In view of this, the Fed and the US government are currently ready to give the national economy with additional stimulus. Experts think that such a strategy will help unleash hidden potential that will emerge in 2021. By this time, the US economy will have accumulated significant demand, due to which the yields of long bonds can sharply rise. If this plan is realized, the USD will have a head start, allowing it to bypass the euro. On the contrary, there will be a narrowed growth for the US dollar, if a negative scenario occurs, that is, when long yields are limited. In such a situation, the risk of moving real interest rates in the US into a negative zone increases. According to analysts, this drastically reduces the dollar's chances to rise. If such a scenario happens, experts believe that even the Fed's impulse will not pull the USD to a high level. Technical analysis of EUR/USD for November 16, 2020 2020-11-16 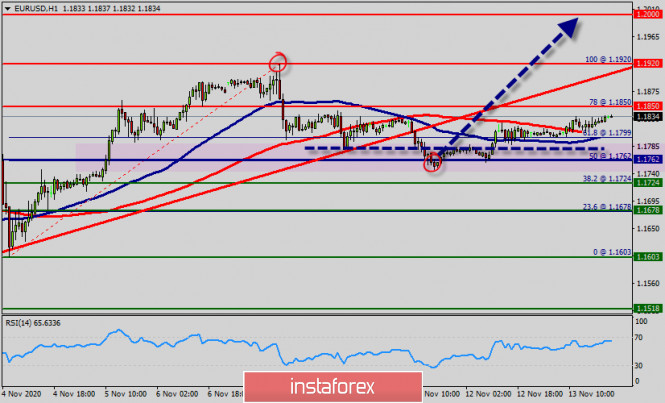 Overview : The EUR/USD pair is trading mainly with growth in the range of 1.1920, after falling to a last-week low (1.1762). The market closed at the price of 1.1834. On the hourly chart, the pair remains above the MA (100) H1 moving average line (1.1850). The situation is similar on the four-hour chart. The EUR/USD pair rebounded to 1.1762 last week but failed to extend gain and retreated sharply. In this situation, it is probably worth continuing to stick to the uptrend direction in trade, and look for exit points to buy. The most likely range of price movement today may be hidden within the range of 1.1762 - 1.1920. Initial bias is neutral this week first. On the upside, break of 1.1850 will reaffirm the case that consolidation from 1.1850 has completed at 1.1920. Further rise would be seen to retest 1.1920 high. The EUR/USD pair will face resistance at the level of 1.1920, while minor resistance is seen at 1.1850. Support is found at the levels of 1.1762 and 1.1724. Also, it should be noted that a daily pivot point has already set at the level of 1.1762. Equally important, the EUR/USD pair is still moving around the key level at 1.1762, which represents a daily pivot in the H1 time frame at the moment. Yesterday, the EUR/USD pair will be continued to move upwards from the level of 1.1762. The level of 1.1762 is expected to act as major support today. From this point, we expect the EUR/USD pair to continue moving in the bullish trend from the support level of 1.1762 towards the target level of 1.1850. If the pair succeeds in passing through the level of 1.1850, the market will indicate the bullish opportunity above the level of 1.1850 in order to reach the second target at 1.1920. Consequently, the market is likely to show signs of a bullish trend. In other words, rebuy orders are recommended above 1.1920 with the third target at 1.2000. Then, the pair is likely to begin an ascending movement to 1.1920 mark and further to 1.2000 levels. The level of 1.2000 will act as strong resistance, and the double top is already set at 1.1920. However, break of 1.1724 support will turn bias to the downside to extend the consolidation with another falling leg. if the pair fails to pass through the level of 1.1920, the market will indicate a bearish opportunity below the level of 1.1920. So, the market will decline further to 1.1762 in order to return to the daily . Moreover, a breakout of that target will move the pair further downwards to 1.1724. Conclusion : - The EURUSD pair keeps its stability above 1.1762, which adds more support to the occasions of achieving more rise in the upcoming sessions and resume the main bullish trend, paving the way to head towards 1.1850 as a next main station, noting that holding above 1.1920 is important to continue the positive trades.
Technical levels for 16/11/2020 - Resistance 3 : 1.2000
- Resistance 2 : 1.1920
- Resistance 1 : 1.1850
- Pivot point : 1.1762
- Support 1 : 1.1724
- Support 2 : 1.1678
- Support 3 : 1.1603
Technical analysis of GBP/USD for November 16, 2020 2020-11-16 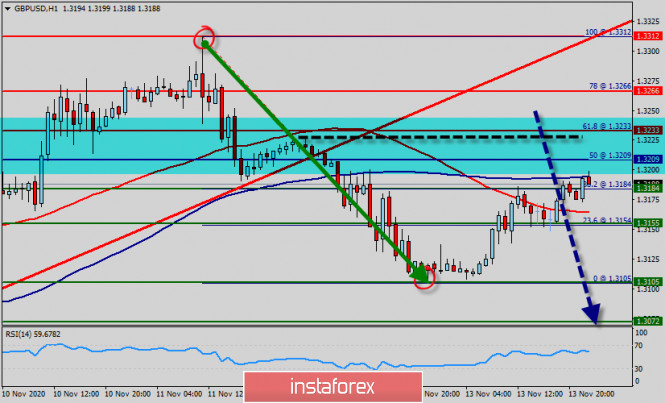 Overview : The British pound closed last week up at the price of 1.3184 against the US dollar, as Brexit fears continued and data released on Friday showed that the UK's economy contracted for the first time since a long time. The British pound rallied significantly during the week, reaching towards 1.3184 handle. At this point in time, it looks like we are running out of momentum. Last week, the GBP/USD pair fell from to top point of 1.3312 to the bottom of 1.3105 to rebound toward 1.3184 (close price) The market is likely to continue to be very sharp if we do pull back from here, but it surely looks as if we are running out of a lot of the momentum. As the current rebound is pushing the cable close to this level once again, price action is trading below the 1.3209 handle. As long as the 1.3209 level holds, the GBP/USD pair is likely to trade subdued. There is a risk of falling further down to the 1.3155 handle. The hourly chart shows strong consolidation taking place as price whipsaws back and forth. As a result, there is currently no clear trend defined within the short term. We are starting to see the market focused on Brexit and coronavirus at the same time, so that probably puts the British pound in the crosshairs of a lot of traders in both directions. Now, the price is set at 1.3209 to act as a daily pivot point. It should be noted that volatility is very high for that the GBP/USD pair is still moving between 1.3312 and 1.3105 in coming days. Furthermore, the price has set below the strong resistance at the levels of 1.3233 and 1.3105, which coincides with the 61.8% and 00% Fibonacci retracement level respectively. Additionally, the price is in a bearish channel now. Amid the previous events, the pair is still in a downtrend. From this point, the GBP/USD pair is continuing in a bearish trend from the new resistance of 1.3233/1.3209. Moreover, the RSI is becoming to signal a downward trend, as the trend is still showing strong above the moving average (100). Thus, the market is indicating a bearish opportunity below the area of 1.3233/1.3209. Thereupon, the price spot of 1.3233/1.3209 remains a significant resistance zone. Therefore, a possibility that the GBP/USD pair will have downside momentum is rather convincing and the structure of a fall does not look corrective. In order to indicate a bearish opportunity below 1.3233/1.3209. If the pair fails to pass through the levels of 1.3233 or/and 1.3209, the market will indicate a bearish opportunity below the strong resistance levels of 1.3233 or/and 1.3209. In this regard, sell deals are recommended lower than the 1.3233 or/and 1.3209 level with the first target at 1.3150. It is possible that the pair will turn downwards continuing the development of the bearish trend to the level 1.3105. The trend is still calling for a strong bearish market from the spot of 1.3312 - sellers are asking for a high price (1.3312 : double top). However, stop loss has always been in consideration thus it will be useful to set it above the last double top at the level of 1.3312 (notice that the major resistance today has set at 1.3312). Forecast : Accordingly, the market is likely to show signs of a bearish trend. In other words, sell orders are recommended below the resistance levels 1.3312, 1.3266 and 1.3233 with the first target at the level of 1.3155. If the trend is be able to break the major support at the level of 1.3155, then the market will continue rising towards the weekly resistance 1 at 1.1305. AUD/USD. COVID-19 anti-records in the US, Trump's defeat, and RCEP agreement 2020-11-16 The AUD/USD currency pair is moving to the limits of the 0.7300 again. The US dollar is showing weakness during the start of a new trading week, amid COVID-19 anti-records in the United States, which lowers anti-risk sentiment and slows down US inflation. In turn, the Australian dollar got a reason to strengthen over this weekend, and, oddly enough, China played an important role in this. 
Trump finally lost hope of being re-elected last weekend, despite denying the obvious. On Saturday, it became known that Joe Biden took Georgia for the first time in 28 years: this state has traditionally voted for the Republicans since 1992, but the Democratic leader was able to change things in his favor this time. His victory in this region led to the final total of electoral votes: 306 votes for Biden and 232 votes for Trump (remember that 270 votes are needed to win). The candidate will be officially declared the winner of the presidential race on December 14, when the Electoral College votes for him. Therefore, it is clear that the Republican will not be able to change the situation through the courts, especially since the majority of judges refuse Trump to consider his claims. The evidence of this fact is also confirmed by the fact that Mr. Biden has already been congratulated by the leaders of the world's leading countries: from Canada to China. And so yesterday, Mr. Trump actually admitted defeat: he tweeted that Joe Biden won, but due to electoral fraud. In other words, traders can now finally turn over this chapter: The US presidential election is over. This fact weakened the US dollar, since traders used this currency as a kind of safety net. However, other fundamental factors have currently come to the fore, which turned out to be not in favor of the US dollar. First of all, we are talking about COVID-19. In the second half of October and the first half of November, this factor supported the US dollar for the same reason – it was used as a protective tool. But recently, investors are worried about the current situation in the United States, where the incidence of COVID-19 breaks all records. As an example, the number of detected cases was 187 thousand people last Friday, which is an absolute anti-record when it comes to the daily incidence rate. For comparison, this figure was 70-80 thousand (and we are talking about peak periods) in the middle of summer, when USD was also weakening amid growing cases of COVID-19 in the US. And if outbreaks were local in nature during the summer months, then at the moment, almost the entire territory of the States has become filled with COVID-19 cases. In this regard, doctors are making a warning, pointing out that hospitals no longer have enough beds and specialists, while infectious diseases experts warn that in winter, the daily increase in infected people can grow to two hundred thousand. Against the background of such trends, many States at the local level began to tighten quarantine restrictions. In particular, the Governor in New Mexico announced the temporary closure of all businesses that are not associated with the production or sale of essential goods. Similar measures have been taken by the authorities of the state of Oregon. Experts believe that most of the country's States will be forced to tighten quarantine sooner or later; otherwise, the medical system will simply not cope with the load. Such prospects put background pressure on the US dollar, especially amid slowing US inflation. It should be recalled that disappointing data on CPI growth in the US were published on Thursday. 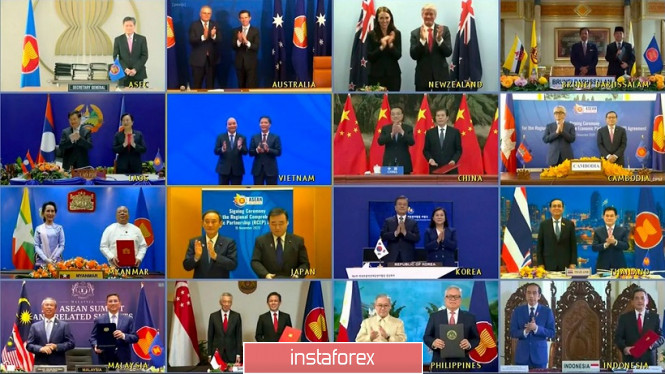
On another note, the Australian dollar received an additional reason yesterday to grow. It became known that the countries of Asia and the Pacific region signed an agreement on the creation of the world's largest free trade zone. This complex negotiations lasted more than 10 years: the negotiation process was blocked by India for a long time, which subsequently refused to participate in the agreement at all. India has been replaced by Australia, which is now also a member of the Regional Comprehensive Economic Partnership Agreement (RCEP). This agreement was signed by representatives of 15 countries, including China, Japan, South Korea and New Zealand and 10 more ASEAN members, which include, in particular, Singapore, Vietnam and Thailand. In the context of the AUD/USD pair, the RCEP agreement should be viewed through the prism of the complex political relations between Australia and China. After all, the deal implies the abolition of tariffs for at least 90% of goods in trade between the participating countries. The very fact of signing the agreement supported the Australian dollar, as it eased concerns about China's latest actions in relation to Canberra (the actual ban on coal imports, increased customs checks, increased tariffs on a number of goods, etc.). Thus, the current fundamental background suggests that the AUD/USD pair will retest the main resistance level of 0.7350 in the mid-term (the upper line of the Bollinger Bands indicator on the daily chart). In view of this, long positions can be opened either from current positions or when breaking the level of 0.7300. Simplified wave analysis and forecast for EUR/USD and GBP/JPY on November 16 2020-11-16 EUR/USD Analysis: The upward wave structure that is actual for the current day has been reporting since November 4. Over the past week, the price has been forming the correction part of the movement. It has not been completed yet. The final drop is missing. Forecast: Today, the price is expected to move sideways in the corridor between the opposite zones. After trying to put pressure on the resistance zone, you can wait for a downward vector. Confirmation is required when changing the course. A short-term puncture of the upper limit of resistance is possible. The support zone shows the expected lower limit of the daily range. Potential reversal zones Resistance: - 1.1850/1.1880 Support: - 1.1790/1.1760 Recommendations: In the context of the upcoming flat decline, trading transactions in the euro may be unprofitable. It is recommended to refrain from trading until the end of the correction and look for buy signals at the end of it. 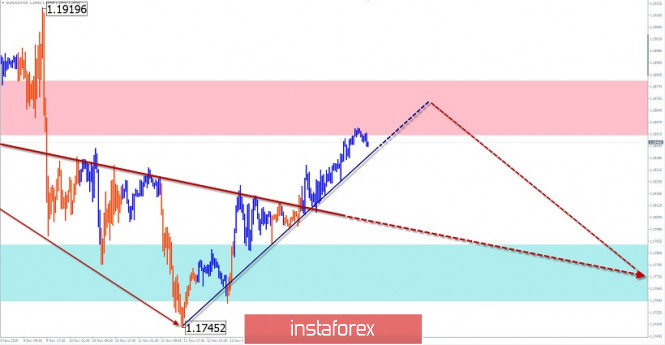
GBP/JPY Analysis: The direction of the short-term trend in the pair's market is set by the rising wave from September 23. From November 9, the price is adjusted, forming the beginning of a full correction. The structure of the movement has the wrong kind. Forecast: In the current day, the general sideways mood of the price movement is most likely. After an attempt to put pressure on the resistance zone, the pair is expected to turn and move to the support area. Going beyond the estimated boundaries of the corridor is unlikely today. Potential reversal zones Resistance: - 138.70/139.00 Support: - 137.50/137.20 Recommendations: Trading on the pair's market is possible within the intraday. In the first half of the day, purchases with a reduced lot can be successful. In the area of resistance, the pair's sales may become relevant. 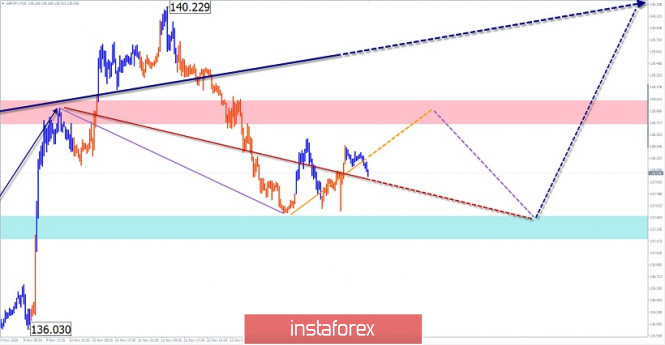
Explanation: In the simplified wave analysis (UVA), waves consist of 3 parts (A-B-C). The last incomplete wave is analyzed. The solid background of the arrows shows the formed structure, and the dotted one shows the expected movements. Note: The wave algorithm does not take into account the duration of the instrument's movements in time! Forex forecast 11/16/2020 on AUD/USD and NZD/USD from Sebastian Seliga 2020-11-16 Let's take a look at AUD/USD and NZD/USD forex paris technical picture after the macroeconomic data from China had been released. EUR/USD: US draws up new sanctions against China. The euro and the pound broke through monthly highs, but the upward potential is limited. 2020-11-16 The US dollar steadily lost ground last Friday amid news that consumer sentiment in the US is clearly deteriorating. And although experts believe that this should not affect consumption indicators, there is still a risk of a slowdown because of the decrease. The report indicated that consumer confidence in the United States declined, and this is mainly due to the results of the presidential election, after which a sharp deterioration in sentiment among supporters of the Republican Party was recorded.  The latest polls reveal that about 70% of Republicans do not believe that the presidential election was "free and fair", even though Joe Biden won a pretty impressive victory according to the electoral tally. The confidence of Republican voters in the system clearly declined, in which 78% are confident that the mailing of ballots provoked widespread election fraud, while about 72% believed that there was falsification of ballots. New infections of COVID-19 also continue to increase, so as a result, the preliminary index of consumer sentiment fell to 77.0 points in November, well below the predicted 81.5 points. As for the index of current economic conditions, only a slight change was recorded (from 85.9 points to 85.8 points), unlike the consumer expectations index which fell sharply from 79.2 points to 71.3 points. 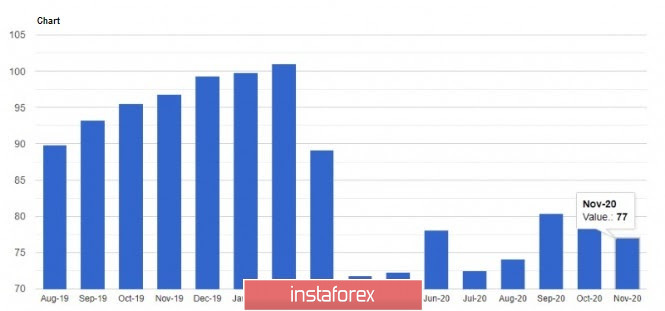 Manufacturing PMI recorded only slight changes as well, increasing by only 0.3% compared to the previous month. As for the basic PPI index, which does not take into account volatile categories, showed an increase of only 0.1%. In another note, incumbent president, Donald Trump, announced his intention to implement new sanctions against China, the main reason for which was the alleged violation of human rights in the Xinjiang Uyghur Autonomous Region of the PRC and Hong Kong, as well as for creating threats to the national security of the United States. It seems that the outgoing administration is trying to somehow spoil the term of the new US President Joe Biden, who will then have to sort it all out. As for the EUR / USD pair, its current technical picture shows that the level of 1.1870 is the pivot, and a breakout from which will trigger a strong bullish momentum towards 1.1915. But the upward movement will not stop there as the quote has a high chance of reaching the level of 1.1965, and then the 20th figure, which may complete the upward impulse. After that, the pair will hover in a side channel, and the pressure on the euro will return. However, it is unlikely that it will result in a serious breakout from 1.2000 nor a consolidation above this psychological level. If the pressure on the euro returns early this week, most likely, the bulls will try to protect 1.1800, on which the further growth of the pair depends. A breakout of this range is likely to increase pressure on the euro, and will probably push it to lows 1.1740 and 1.1660. 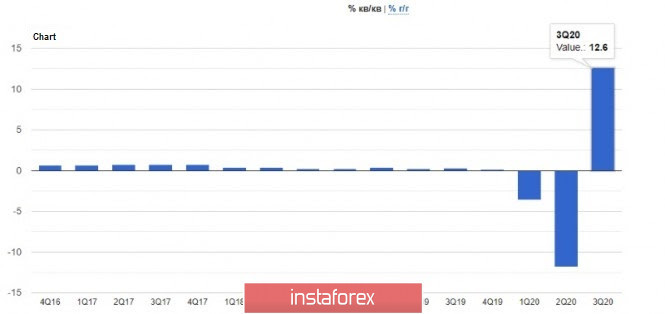 With regards to statistics, Eurostat published a report indicating that in the 3rd quarter of this year, the eurozone economy partially restored jobs, but employment growth, which accounts for most of the economic activity, leaves much to be desired. According to the data, the number of employees increased by 0.9% in the 3rd quarter, as compared to the 2nd quarter. The eurozone economy also grew 12.6% after falling 11.8% in the second quarter, and is revised downward from 12.7%. Meanwhile, the good situation in the world arena, where trade activity is gradually bouncing back, led to an increase in the trade surplus of the eurozone in September, which returned to pre-crisis levels thanks to export growth. According to the data, the foreign trade surplus of the euro area amounted to € 24.8 billion in September, against € 18.3 billion from last year. In particular, exports have jumped by 4.1%, while imports increased by only 2.7%. Exports though remained 7.9% lower than the record at the beginning of this year. On Friday, there were also speeches from representatives of the Federal Reserve System, which will continue today. One interesting statement was that of St. Louis Fed president, James Bullard, who believes that the economy has recovered much faster than expected. According to him, this happened all thanks to the Fed's policy, which is in excellent condition and does not require any intervention. Bullard said the Fed currently has no plans to raise rates, and the present pace of bond purchases is effective and acceptable. This tells us that so far, the central bank is in no hurry to change its monetary policy and resort to either easing it or expanding its bond purchase program. Bullard also noted that he sees no reason to change policy at this time, as, even with the rise in coronavirus incidence, a huge part of the economy continues to operate. John Williams, president of the New York Fed, also noted that the economic data of the US is much better than expected, however, this speaks only of a moderate economic recovery in the 4th quarter. The growth of COVID-19 infections remains a problem, which calls forecasts into question. But despite the fact that the economy is in a deep hole compared to its previous position, Williams sees growth prospects. Positive news about the vaccine has already boosted bond yields, and its rollout will help the economy recover even faster. Both the statements of Bullard and Williams point to the possibility that rates would increase if figures exceed forecasts. Most likely, this will occur in about three years, when inflation returns to the target level and exceeds it. GBP/USD. November 16. COT report. The deadline for negotiations on a trade deal has arrived. Boris Johnson may try to wind down negotiations 2020-11-16 GBP/USD – 1H. 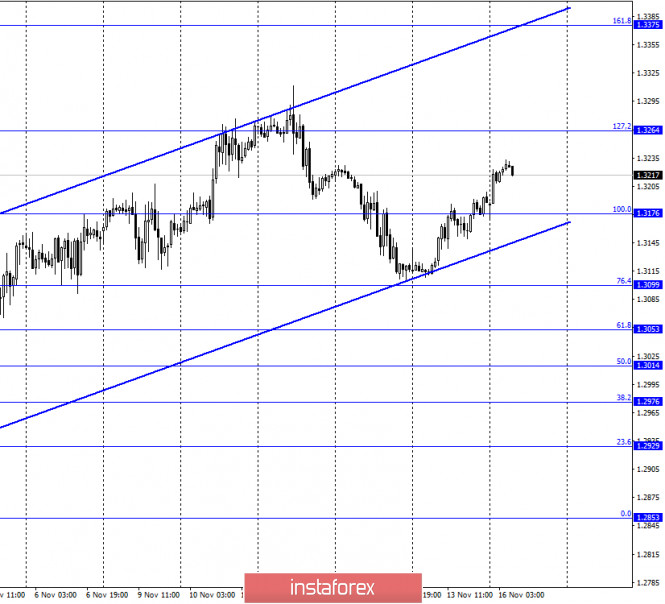
According to the hourly chart, the GBP/USD pair quotes continue to grow in the direction of the corrective level of 127.2% (1.3264) after rebounding from the lower border of the upward trend corridor, which keeps the current mood of traders "bullish". Thus, this week we can even count on an increase to the Fibo level of 161.8% (1.3375), which lies near the upper border of the corridor. Fixing the pair's rate under the corridor will work in favor of the US currency and the beginning of a long fall. Meanwhile, the British media is starting to sound the alarm again. The reason lies, of course, in Brexit and negotiations on a trade agreement. The fact is that the deadline for negotiations set by Boris Johnson a month earlier expired yesterday. The fact is that the transition period is still one and a half months away. The fact is that there is still no information indicating progress in the negotiations. Therefore, the chances of reaching an agreement and mutual understanding on all key issues continue to fade. The UK media is also wary of the actions of Boris Johnson, whose office was left this weekend by Dominic Cummings, who is called the "architect of Brexit". There is a high probability that Johnson will go to the principle and again try to complete negotiations with the EU, although this is not beneficial to anyone. Neither the EU nor the UK. However, Boris Johnson from the very beginning of his Premiership did not fear a "hard" Brexit at all and considered the main thing to complete the exit from the European Union as soon as possible. GBP/USD – 4H. 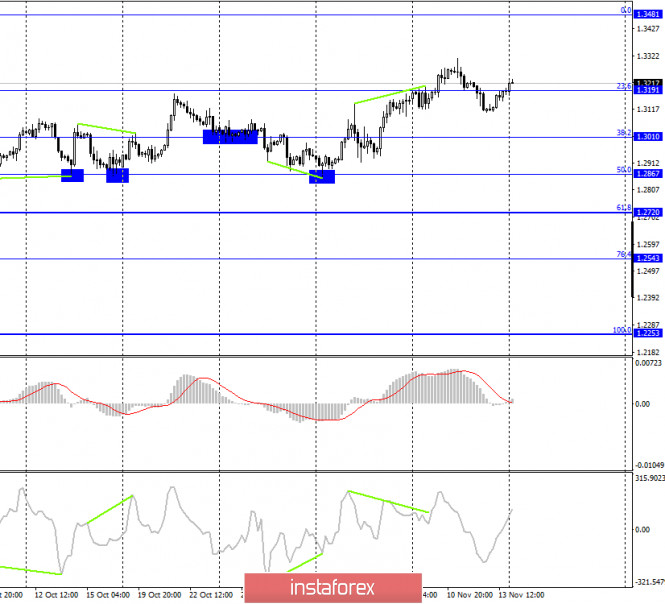
On the 4-hour chart, the GBP/USD pair performed a reversal in favor of the British and fixed above the corrective level of 23.6% (1.3191). Thus, the growth process can be continued towards the next Fibo level of 0.0% (1.3481). Today, the divergence is not observed in any indicator. Closing the pair's rate under the corrective level of 23.6% will work in favor of the US currency and resume falling towards the corrective level of 38.2% (1.3010). GBP/USD – Daily. 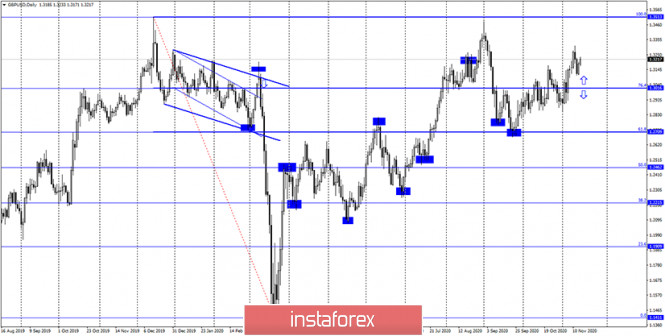
On the daily chart, the pair's quotes have consolidated above the corrective level of 76.4% (1.3016), which allows us to expect further growth in the direction of the next corrective level of 100.0% (1.3513). GBP/USD – Weekly. 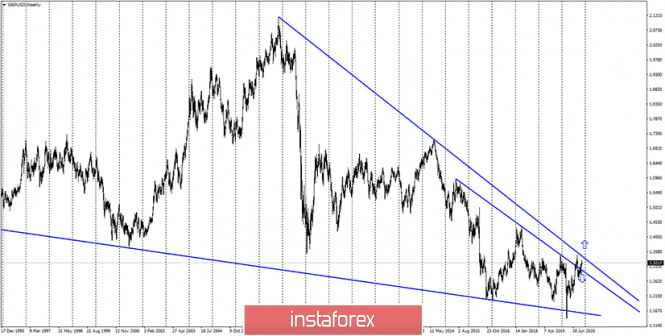
On the weekly chart, the pound/dollar pair closed under the lower downward trend line, thus, a false breakout of this line followed earlier. However, in recent weeks, the pair has made new attempts to gain a foothold over both trend lines. Overview of fundamentals: The Governor of the Bank of England gave a speech in the UK on Friday, but he only touched on economic issues superficially. Traders did not react to his speech. No more important news came from Britain. News calendar for the United States and Great Britain: On November 16, the news calendars of Great Britain and America do not contain any important entries, thus, the information background will be extremely weak today. And with it, the activity of traders. COT (Commitments of Traders) report: 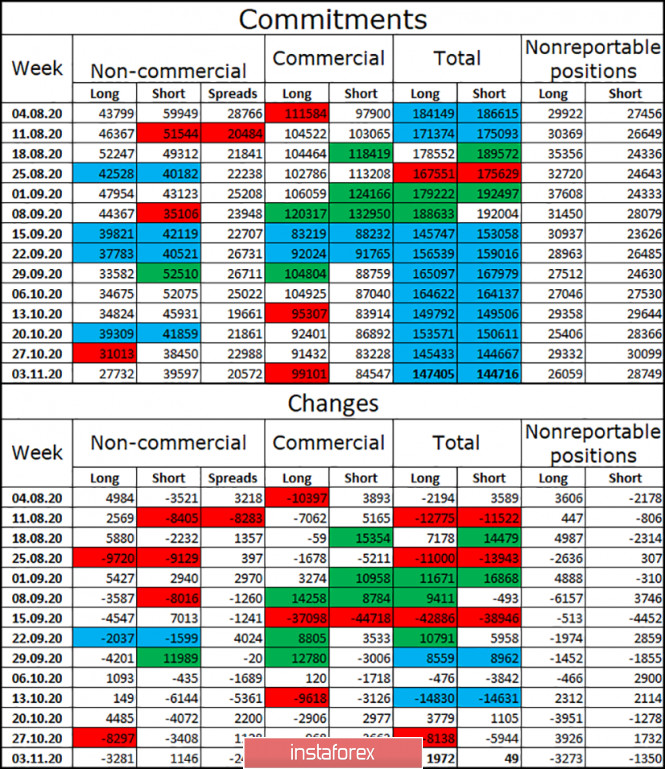
The latest COT report on the British pound showed that the mood of the "Non-commercial" category of traders became even more "bearish" during the reporting week. Speculators continued to get rid of long contracts, closing a total of 3,281 units. At the same time, they slightly increased the number of short contracts, opening 1,146. Thus, the mood of the "Non-commercial" category has become more "bearish". However, due to the US presidential election, the British pound rose strongly last week. This data was not included in the latest COT report, so I can't conclude how the mood of major traders changed after November 2. You need to wait for the next COT report and analyze it. According to the latest report, I can say that the chances of a fall in the British dollar are very high now. Forecast for GBP/USD and recommendations for traders: Today, I recommend selling the GBP/USD pair with targets of 1.3053 and 1.3010 if the closing is performed under the ascending corridor on the hourly chart. A rebound was made from the lower border of the ascending channel, so now you can stay in purchases with the goal of 1.3264. Terms: "Non-commercial" - major market players: banks, hedge funds, investment funds, private, large investors. "Commercial" - commercial enterprises, firms, banks, corporations, companies that buy currency not for speculative profit, but for current activities or export-import operations. "Non-reportable positions" - small traders who do not have a significant impact on the price. Trading plan for the EUR/USD pair on November 16. Is the coronavirus finally retreating? 2020-11-16 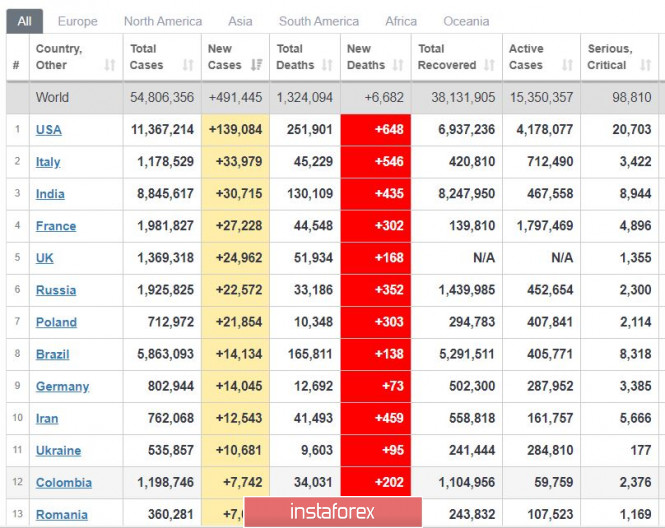
A noticeable decline is observed in worldwide COVID-19 infections, from 600 thousand to 490 thousand cases a day. However, this figure emerged on a weekend, which usually shows a decrease in incidence, and then climbs back again further in the week. Closer monitoring is needed before any conclusion is asserted. At the moment though, Europe is still near the highs, but some countries, France for example, have probably passed the peak. Some, like Austria, are under strict quarantine. With regards to the vaccine, Pfizer is due to obtain approval from authorities. If this happens, at least 50 million doses will be released by the end of this year. 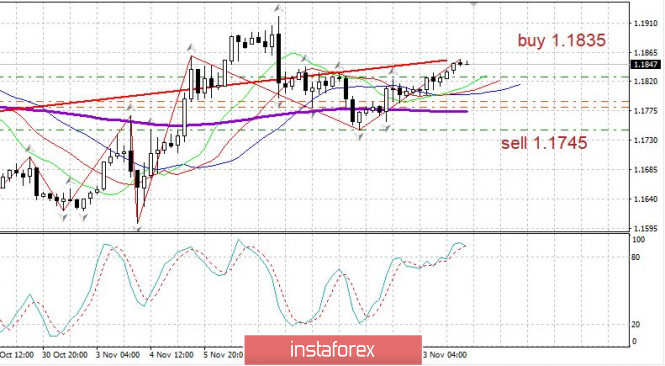
EUR/USD: The euro is growing, albeit extremely small and very slow. Maintain long positions at 1.1790 and 1.1825, but be prepared for possible rollbacks. Open short positions at 1.1745.
Author's today's articles: Sergey Belyaev  Born December 1, 1955. In 1993 graduated from Air Force Engineering Academy. In September 1999 started to study Forex markets. Since 2002 has been reading lectures on the technical analysis . Is fond of research work. Created a personal trading system based on the indicator analysis. Authored the book on technical analysis "Calculation of the next candlestick". At present the next book is being prepared for publishing "Indicator Analysis of Forex Market. Trading System Encyclopedia". Has created eleven courses on indicator analysis. Uses classical indicators. Works as a public lecturer. Held numerous seminars and workshops presented at international exhibitions of financial markets industry. Is known as one of the best specialists in the Russian Federation researching indicator analysis. Born December 1, 1955. In 1993 graduated from Air Force Engineering Academy. In September 1999 started to study Forex markets. Since 2002 has been reading lectures on the technical analysis . Is fond of research work. Created a personal trading system based on the indicator analysis. Authored the book on technical analysis "Calculation of the next candlestick". At present the next book is being prepared for publishing "Indicator Analysis of Forex Market. Trading System Encyclopedia". Has created eleven courses on indicator analysis. Uses classical indicators. Works as a public lecturer. Held numerous seminars and workshops presented at international exhibitions of financial markets industry. Is known as one of the best specialists in the Russian Federation researching indicator analysis. Sebastian Seliga  Sebastian Seliga was born on 13th Oсtober 1978 in Poland. He graduated in 2005 with MA in Social Psychology. He has worked for leading financial companies in Poland where he actively traded on NYSE, AMEX and NASDAQ exchanges. Sebastian started Forex trading in 2009 and mastered Elliott Wave Principle approach to the markets by developing and implementing his own trading strategies of Forex analysis. Since 2012, he has been writing analitical reviews based on EWP for blogs and for Forex websites and forums. He has developed several on-line projects devoted to Forex trading and investments. He is interested in slow cooking, stand-up comedy, guitar playing, reading and swimming. "Every battle is won before it is ever fought", Sun Tzu Sebastian Seliga was born on 13th Oсtober 1978 in Poland. He graduated in 2005 with MA in Social Psychology. He has worked for leading financial companies in Poland where he actively traded on NYSE, AMEX and NASDAQ exchanges. Sebastian started Forex trading in 2009 and mastered Elliott Wave Principle approach to the markets by developing and implementing his own trading strategies of Forex analysis. Since 2012, he has been writing analitical reviews based on EWP for blogs and for Forex websites and forums. He has developed several on-line projects devoted to Forex trading and investments. He is interested in slow cooking, stand-up comedy, guitar playing, reading and swimming. "Every battle is won before it is ever fought", Sun Tzu Maxim Magdalinin  In 2005 graduated from the Academy of the Ministry of Internal Affairs of the Republic of Belarus, law faculty. Worked as a lawyer for three years in one of the biggest country's company. Besides the trading, he develops trading systems, writes articles and analytical reviews. Works at stock and commodity markets explorations. On Forex since 2006. In 2005 graduated from the Academy of the Ministry of Internal Affairs of the Republic of Belarus, law faculty. Worked as a lawyer for three years in one of the biggest country's company. Besides the trading, he develops trading systems, writes articles and analytical reviews. Works at stock and commodity markets explorations. On Forex since 2006. l Kolesnikova  text text Mourad El Keddani  Was born in Oujda, Morocco. Currently lives in Belgium. In 2003 obtained B.S. in Experimental Sciences. In 2007 obtained a graduate diploma at Institut Marocain Specialise en Informatique Applique (IMSIA), specialty – Software Engineering Analyst. In 2007–2009 worked as teacher of computer services and trainer in a professional school specializing in computer technologies and accounting. In 2005 started Forex trading. Authored articles and analytical reviews on Forex market on Forex websites and forums. Since 2008 performs Forex market research, and develops and implements his own trading strategies of Forex analysis (especially in Forex Research & Analysis, Currency Forecast, and Recommendations and Analysis) that lies in: Numerical analysis: Probabilities, equations and techniques of applying Fibonacci levels. Classical analysis: Breakout strategy and trend indicators. Uses obtained skills to manage traders' accounts since 2009. In April 2009 was certified Financial Technician by the International Federation of Technical Analysts. Winner of several social work awards: Education Literacy and Non-Formal Education (in Literacy and Adult Education in The National Initiative for Human Development). Was born in Oujda, Morocco. Currently lives in Belgium. In 2003 obtained B.S. in Experimental Sciences. In 2007 obtained a graduate diploma at Institut Marocain Specialise en Informatique Applique (IMSIA), specialty – Software Engineering Analyst. In 2007–2009 worked as teacher of computer services and trainer in a professional school specializing in computer technologies and accounting. In 2005 started Forex trading. Authored articles and analytical reviews on Forex market on Forex websites and forums. Since 2008 performs Forex market research, and develops and implements his own trading strategies of Forex analysis (especially in Forex Research & Analysis, Currency Forecast, and Recommendations and Analysis) that lies in: Numerical analysis: Probabilities, equations and techniques of applying Fibonacci levels. Classical analysis: Breakout strategy and trend indicators. Uses obtained skills to manage traders' accounts since 2009. In April 2009 was certified Financial Technician by the International Federation of Technical Analysts. Winner of several social work awards: Education Literacy and Non-Formal Education (in Literacy and Adult Education in The National Initiative for Human Development).
Languages: Arabic, English, French and Dutch.
Interests: Algorithm, Graphics, Social work, Psychology and Philosophy. Irina Manzenko  Irina Manzenko Irina Manzenko Vyacheslav Ognev  Vyacheslav was born on August 24, 1971. In 1993, he graduated from Urals State University of Economics in the Russian city of Ekaterinburg holding a degree in Commerce and Economics of Trade. In 2007, he started concentrating on the Russian stock market, trading stocks on the RTS Stock Exchange and futures contracts on FORTS. Since 2008 he has been engaged in analyzing Forex market and trading currencies. He is an author of a simplified wave analysis method. He has also developed a trading strategy. At present, Vyacheslav is a co-author of training materials on two web portals dedicated to Forex trading education. Interests: fitness, F1 "Experience is the best of schoolmasters, only the school fees are heavy." - Thomas Carlyle Vyacheslav was born on August 24, 1971. In 1993, he graduated from Urals State University of Economics in the Russian city of Ekaterinburg holding a degree in Commerce and Economics of Trade. In 2007, he started concentrating on the Russian stock market, trading stocks on the RTS Stock Exchange and futures contracts on FORTS. Since 2008 he has been engaged in analyzing Forex market and trading currencies. He is an author of a simplified wave analysis method. He has also developed a trading strategy. At present, Vyacheslav is a co-author of training materials on two web portals dedicated to Forex trading education. Interests: fitness, F1 "Experience is the best of schoolmasters, only the school fees are heavy." - Thomas Carlyle Pavel Vlasov  No data No data Grigory Sokolov  Born 1 January, 1986. In 2008 graduated from Kiev Institute of Business and Technology with "Finance and Credit" as a major. Since 2008 has studied the behavior of various currency pairs and their correlation on Forex. In his works and trading practice he uses candlestick analysis and Fibonacci technique. Since 2009 has written analytical reviews and articles which are published on popular Internet resources. Interests: music, computers and cookery. "Out of five deadly sins of business and as a rule, the most widespread, excessive striving to get profit is the worst". P. Drucker Born 1 January, 1986. In 2008 graduated from Kiev Institute of Business and Technology with "Finance and Credit" as a major. Since 2008 has studied the behavior of various currency pairs and their correlation on Forex. In his works and trading practice he uses candlestick analysis and Fibonacci technique. Since 2009 has written analytical reviews and articles which are published on popular Internet resources. Interests: music, computers and cookery. "Out of five deadly sins of business and as a rule, the most widespread, excessive striving to get profit is the worst". P. Drucker Mihail Makarov  - -
Subscription's options management Theme's:
Fundamental analysis, Fractal analysis, Wave analysis, Technical analysis, Stock Markets
Author's :
A Zotova, Aleksey Almazov, Alexander Dneprovskiy, Alexandr Davidov, Alexandros Yfantis, Andrey Shevchenko, Arief Makmur, Dean Leo, Evgeny Klimov, Fedor Pavlov, Grigory Sokolov, I Belozerov, Igor Kovalyov, Irina Manzenko, Ivan Aleksandrov, l Kolesnikova, Maxim Magdalinin, Mihail Makarov, Mohamed Samy, Mourad El Keddani, Oleg Khmelevskiy, Oscar Ton, Pavel Vlasov, Petar Jacimovic, R Agafonov, S Doronina, Sebastian Seliga, Sergey Belyaev, Sergey Mityukov, Stanislav Polyanskiy, T Strelkova, Torben Melsted, V Isakov, Viktor Vasilevsky, Vladislav Tukhmenev, Vyacheslav Ognev, Yuriy Zaycev, Zhizhko Nadezhda
Edit data of subscription settings
Unsubscribe from the mailing list Sincerely,
Analysts Service | If you have any questions, you can make a phone call using one of the
InstaForex Toll free numbers right now:
|  | InstaForex Group is an international brand providing online trading services to the clients all over the world. InstaForex Group members include regulated companies in Europe, Russia and British Virgin Islands. This letter may contain personal information for access to your InstaForex trading account, so for the purpose of safety it is recommended to delete this data from the history. If you have received this letter by mistake, please contact InstaForex Customer Relations Department. |


No comments:
Post a Comment