| Trading recommendations of EUR/USD and GBP/USD pair on 11/16/20 2020-11-16 
The Euro showed low activity last Friday, which was aimed to strengthen it. So, in terms of the economic calendar, there were no reasons for the single currency to grow. The second estimate of Eurozone GDP for the third quarter reflected a slow down in the economic downturn from -14.8 to -4.4%, although it was predicted that GDP would coincide with the first estimate, which was -4.3. Thus, the euro's strengthening is clearly connected not with the flow of statistical news, but with something else. In view of this, there is speculation that investors are intimidated by the ongoing US presidential race, where incumbent president Mr. Trump managed to achieve a recount in Georgia. In terms of technical analysis, it is worth highlighting that there was an upward trend last Wednesday (Nov 11), when the pivot point 1.1745 was found, relative to which the European currency strengthened. As for last Friday's trade recommendation, things are doing well here. We suggested to take a closer look at the amplitude 1.1787/1.1823 and work on the breakdown of a particular border. As a result, a breakdown of the upper limit (1.1823) occurred, where a buy position was opened, which brought an income of about 25 points. 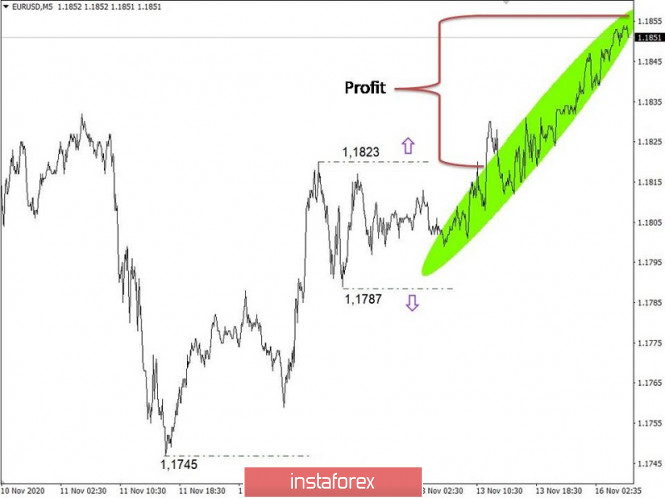
The pound showed an active upward interest last Friday, As a result, it managed to strengthen around 90 points. The most interesting thing is that there was no publication of UK statistics that time. There were no reasons for the pound to strengthen, and so, it is likely that speculative activity played a role, which led to growth. The lever for changing direction could be the same background for the United States regarding investors' fear, as described above. From the point of view of technical analysis, it can be seen at first glance that there was a sharp decline in the limits of 1.3105/13123, followed by an acceleration. Moreover, a round of speculative activity arose after the breakdown of the level of 1.3132, which led to a consistent growth in the pound's volume of positions. Speculative hype 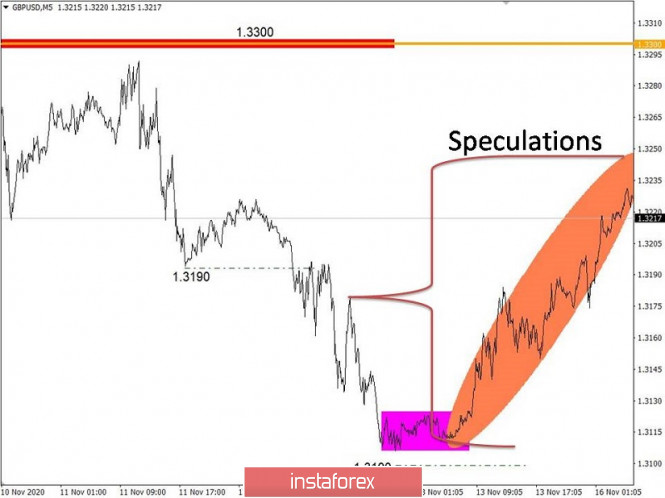
In terms of the economic calendar, we do not have statistics on Europe and the United States worthy of attention today. In case that speculators pay attention, it will only be the information flow in the US regarding Trump and Biden. From the point of view of technical analysis, we stand on the border of the balance of trade forces, which reflects the price level of 1.1850. Thus far, the subsequent course in the market will depend on whether the quote is held above or below the price level. The following scenarios can be considered as possible perspectives and entry points: - Buying a pair is considered at a price above the level of 1.1855, with the prospect of moving to 1.1900. - Selling a pair is considered at a price below the level of 1.1840, with the prospect of a moving to 1.1800. 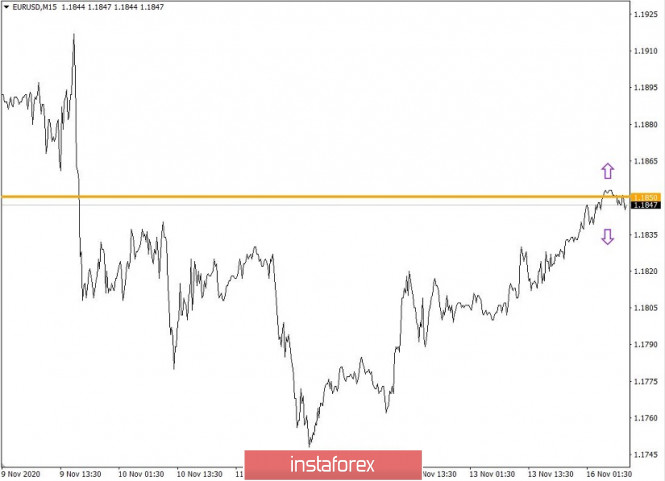
Today, no statistics are expected for the UK. Therefore, we will focus our special attention on technical analysis, as well as on the continuous information flow regarding hot topics such as COVID-19, Brexit, and conflict between Trump and Biden. From the point of view of technical analysis, it is noteworthy that pound's strengthening led to a variable resistance area of 1.3225/1.3235, which may affect the volume of buy positions. If the price continues to hold below this area, sellers will have a chance to decline, which may lead to an increase in the volume of positions for selling the pound and as a result, a decline towards the range of 1.3155-1.3125. An alternative scenario will be considered if the area of 1.3225/1.3235 breaks down in the upward direction, where holding the price above the level of 1.3240 in the four-hour (H4) time frame will lead to movement directed towards the November 11 high - 1.3300. 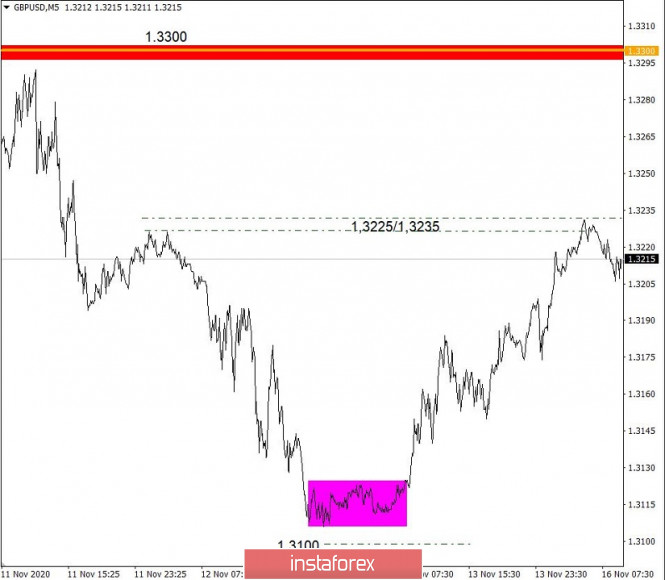
Analysis and forecast for EUR/USD on November 16, 2020 2020-11-16 At the end of last week, the main currency pair of the Forex market declined, losing 0.35%. It is worth noting that the EUR/USD pair was trading without a clear direction. The mood of market participants was still influenced by news about the results of the US presidential election, as well as disappointing data on the spread of the second wave of the COVID-19 pandemic. The most negative situation with the daily number of coronavirus infections remains in the United States of America, where more than one hundred thousand new cases of infection are detected daily. Of the European countries, the virus is most rampant in France and Italy. In several countries of the Old World, a nationwide quarantine is being introduced. As for the results of the US presidential election, Donald Trump and his supporters still do not recognize the results of the election, due to fraud. In general, the situation in the markets does not encourage risky operations, investors are cautious and more inclined to go to protective havens. If such sentiments persist, the US dollar will continue to enjoy a fairly high demand, and risky assets will lose their positions. As for the macroeconomic reports, this week is not scheduled for such important data that can significantly affect the balance of power and market sentiment. But there will be no shortage of speeches from monetary officials of the world's largest central banks. Weekly 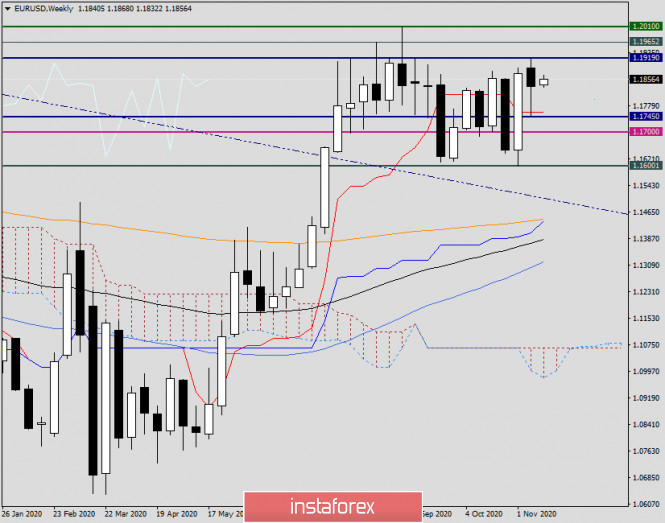
If you look at the weekly chart and the last candle, it is necessary to note a clear development of technical levels of 1.1745 and 1.1917. The first level, which can be considered not only technical but also historical, stopped the pressure of the bears and acted as strong support. And the mark of 1.1917 remained an insurmountable resistance and did not let the quote go higher. Regarding the candle itself, you should pay attention to its long lower shadow, which can signal a subsequent growth, especially since it is visible that bullish and bearish candles alternate. However, there are no clear dynamics for EUR/USD and trading takes place in the range of 1.1600-1.1900, the exit from which can determine the further direction of the price. Daily 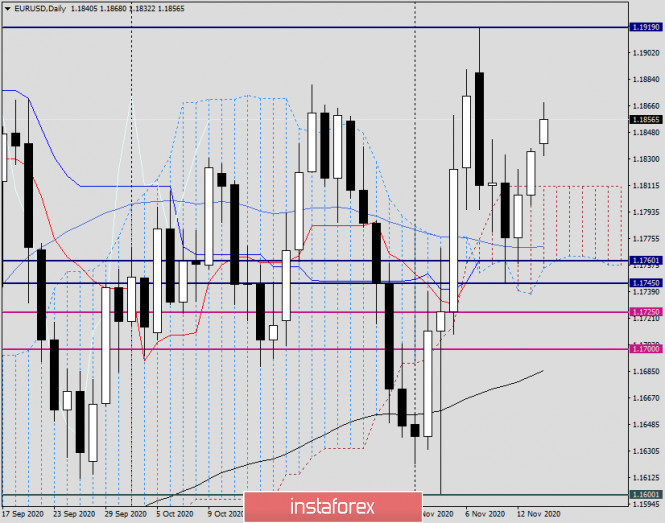
But on the daily EUR/USD chart, it looks quite bullish. This can be judged by the fact that the pair exits up from the Ichimoku indicator cloud. It should be noted that before this, the bears could not break through the 50 simple moving average and bring the quote down from the cloud, after which the course turned in a northerly direction. Today, at the time of writing, the euro/dollar is strengthening and trading near the strong technical level of 1.1860. If the growth continues, the main goal of the euro bulls will be the maximum trading values on November 9 at 1.1919. Only a true breakdown of this level will indicate the probability of further growth, the main goal of which will be the area of 1.2000-1.2010. Now for trading recommendations. Given the ambiguous nature of trading and frequent changes in market sentiment, there is still a possibility of positioning in both directions. It is better to consider purchases after pullbacks to the price zone of 1.1830-1.1800 and the appearance of bullish patterns of Japanese candles on the daily and smaller timeframes. If bearish signals appear in the area of 1.1880-1.1920 on the same charts, this will be the basis for opening short positions on EUR/USD. From today's events, it is worth paying attention to the speech of ECB President Christine Lagarde, which is scheduled for 14:00 (London time). From the US data, we can distinguish the index of activity in the manufacturing sector from the Federal Reserve of New York, which will be published at 14:30 London time. Analysis and forecast for GBP/USD on November 16, 2020 2020-11-16 At the auction on November 9-13, the pound/dollar currency pair showed growth, but it was quite modest. The desire of the British currency to strengthen was held back by the difficult epidemiological situation with the spread of COVID-19, both in the UK and in the United States of America. Considering this situation, risk sentiment was minimized and the growth of the pound was largely influenced by the technical picture. Weekly 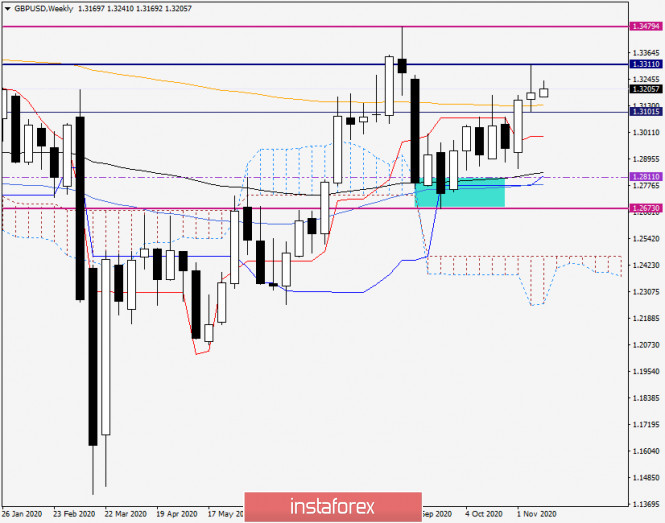
The prospect of further growth was seen after the end of the week before last, with the formation of a large bullish candle with a closing price above the 200 exponential moving average. As a matter of fact, this is exactly what happened, but the strong resistance of sellers in the area of 1.3300 limited the rate rise and did not allow the pair to go higher. As a result, the last weekly candle formed with a long upper shadow, which turned out to be much larger than the bullish body of the candle itself. Often, after the appearance of such candles, the exchange rate decreases, but the current market situation is far from unambiguous, both options for price movement should be considered. The GBP/USD pair is trading in the range of 1.3300-1.3100 at the moment, the exit from which can indicate the further direction of the quote. The census of the previous highs of 1.3311 and the closing of weekly trading above this mark signals the subsequent growth of the British currency. If the bears on the pound manage to rewrite the previous lows and close the weekly trading under the level of 1.3100, it will be time to trust the continuation of the downward scenario. Daily 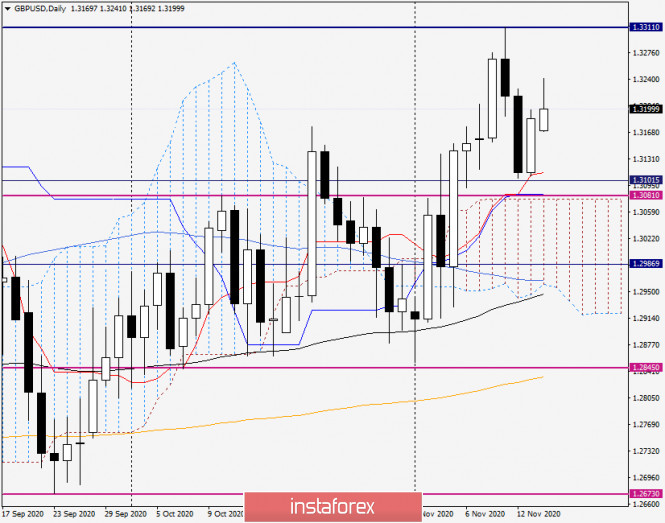
It can be viewed in this timeframe that the pair rolled back to 1.3105 upon rising to 1.3311. Finding support at this mark and the Tenkan line of the Ichimoku indicator, it turned back to the rise. In today's session, the British pound sterling is strengthening and currently trading near 1.3210. At the same time, the price rebound is clearly visible, which occurred from 1.3240, where strong resistance from sellers is apparently concentrated. The current situation for making trading decisions is by no means simple. In my own opinion, there is a possibility of positioning in both directions. The next purchases can be planned upon the decline in the price zone 1.3200-1.3175. It is recommended to look for opening long positions at more favorable prices following the decline to the area of 1.3150-1.3130. Sales will become relevant after the appearance in the price zone of 1.3250-1.3300 bearish models of Japanese candles on the daily, four-hour, and hourly charts. It is believed that before opening positions in both directions, it is better to enlist the support of confirming signals, which can be the corresponding candlestick analysis models. Of the events that this week may have an impact on the dynamics of the pound sterling, it is worth highlighting tomorrow's speech by the head of the Bank of England Andrew Bailey, as well as data on the UK consumer price index, which will be released on Wednesday, November 18. High gold prices are fueling the growth of gold mining companies. 2020-11-16 
The past week has been chaotic for all markets. While President-elect, Joe Biden, continued to plan for the transition, incumbent president, Donald Trump, continued to dispute the election results. However, the biggest news was the coronavirus vaccine, from which gold traded at $ 1,870, while silver fell 7% amid the positive news. Then, by the end of the week gold and silver rallied, following the reports of possible new quarantine restrictions, mainly due to rising coronavirus incidences in many countries. Analysts are confident that gold will continue to grow. Orchid Research even advised to buy setbacks in the asset, citing the post-election environment, which will be defined by more uncertainty, more stimulus and rising COVID-19 cases. Wells Fargo, a company that provides insurance and financial services in countries such as the United States, Canada and Puerto Rico, said last week that it expects gold to reach $ 2,100 an ounce by the end of the year, and then rise to $ 2300 in 2021. There are also talks of a preference for oil over gold, at least according to Goehring & Rozencwajg Associates. They said that "oil has never been cheaper compared to gold", and they see oil significantly outperforming gold in the next five years. The likelihood of such an event increases in parallel with the opening of new gold mining companies and the discovery of new deposits. On Thursday, Aurelia Metals announced the acquisition of the Dargues Gold Mine for AU $ 205 million (US $ 149 million). The deal includes AU $ 176 million, Aurelia shares for AU $ 24 million and a $ 5 million conditional payment. Dargues is projected to produce an average of 45,000-55,000 ounces of gold at a cumulative maintenance cost of A $ 1150-1350 over the next five years. The acquisition will be paid for with fully guaranteed capital raising. In 2020, Aurelia produced 92,000 ounces of gold at a total cost of $ 1,520. The company already operates the Peak and Hera mines in Australia. In the Kitco Roundtable podcast, Eredene Resource CEO, Peter Ackerley, said the move could be optimistic for the mining sector as a whole. Technical analysis of EUR/USD pair for this week (Nov 16-21,20) 2020-11-16 Trend analysis The price from the level of 1.1835 (closing of the last weekly candle) may start rising this week with the goal located at the resistance line of 1.1883 (white thick line). After testing this line, it is possible to further rise with the target at 1.1908 - the pullback level of 76.4% (blue dashed line). Upon reaching this level, the pair will continue further towards the goal of 1.2010 - the upper fractal (candle from 08/30/2020). 
Figure 1 (weekly chart). Comprehensive analysis: - indicator analysis - up; - Fibonacci levels - up; - volumes - up; - candlestick analysis - up; - trend analysis - down; - Bollinger lines - up; - monthly chart - up. Growth can be concluded based on comprehensive analysis. The overall result of the candlestick calculation of the EUR/USD pair on the weekly chart: the price is likely to have an upward trend this week, with no lower shadow in the weekly white candlestick (Monday - up) and no upper shadow (Friday - up). The first upper goal is the resistance line of 1.1883 (white thick line). If this line is tested, it is possible to rise with the goal at 1.1908 - the pullback level of 76.4% (blue dashed line). Upon reaching this level, the pair can further increase towards the goal of 1.2010 - the upper fractal. An alternative scenario: rising from the level of 1.1835 (closing of the last weekly candle) with the goal at the resistance line of 1.1883 (white thick line) can also be considered. After testing this line, the pair can decline towards the goal of 1.1802 - the pullback level of 38.2% (red dotted line). If this level is tested, further decline is likely with the goal of 1.1765 - the pullback level of 50.0% (red dashed line). Will gold take $5,000 high? 2020-11-16 
Experts on the precious metals market became more active, following the US presidential election. They are confident that the demand for gold will clearly rise due to the current politician tension and economic situation. If this scenario works out, gold will freshly shine, conquering new heights. It can be recalled that the price of the precious metal makes another surge during unfavorable periods, since a lot of investors adhere to it. Therefore, it is possible that we will witness a similar event at the turn of 2020-2021. Investors and traders are interested in gold due to its reliability as a defensive asset. Experts are confident that strong financial aid from the Fed and the US authorities will also affect the gold market, since a $ 2 trillion stimulus package is expected to be adopted when Democratic leader Mr. Biden comes to power. Moreover, experts from the precious metals market are convinced that a certain part of these funds will go into gold. In case this happens, gold's price will exceed $ 2000 per ounce. However, such a development of events is possible only on the annual planning range. Analysts say that such growth is unlikely in the short-term. Today, gold is trading near $1887- $1888, trying to leave this range. On the other hand, experts do not exclude periods of volatility, when the precious metal is most prone to declining. At such times, serious collapses are possible up to $1,750–$1,800 per 1 ounce. However, experts emphasize that these are most often short-term failures. A similar point of view is shared by the currency strategists of the Canadian bank, RBC. According to analysts' forecast, 1 ounce of gold will yield no more than $1942 in the fourth quarter of this year, and so, this metal is expected to break through the level of $ 2000 in the first quarter of next year. However, a correction may follow, due to which it will be at $ 1,911 per ounce in the second quarter of 2021. RBC is confident that gold will gain momentum in the short term. This will be strengthened by the growth of risk sentiment in the financial markets. Moreover, they are sure that the yellow metal is undergoing a strong transformation, which economists believe that it will not have a strong impact on gold's future pricing. The realistic forecasts of precious metals of market strategists have stirred the calculations of investor and billionaire Rob McEwen. He is confident that the price of gold will continue to rise to $ 5,000 per ounce; however, he does not consider this value as great. Therefore, R. McEwen said that social networks will play a key role in the price growth. Market participants, sharing with each other up-to-date information, will help gold to rise. In the wake of investor interest and subsequent large-scale purchases, the expert concluded that precious metal will soar to $5,000 per 1 ounce. According to R. McEwen, the price growth of gold is also facilitated by the growth of debt burden around the world, primarily in the United States. In such a situation, investors prefer to hedge their trades by investing in time-tested assets. The undisputed leader among such instruments is gold. According to analysts' observations, the more market participants invest in the main precious metal, the more its price increases, strengthening its already high attractiveness. Trading idea for the USD/JPY pair 2020-11-16  The recommended strategy last week was to work for an increase in the USD / JPY pair, all according to this scheme. 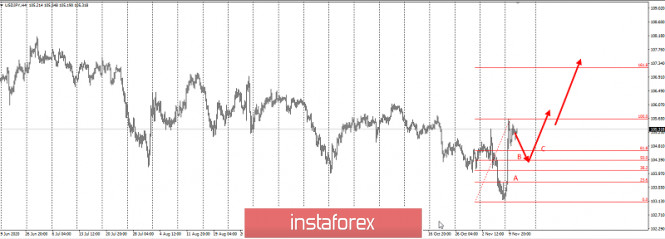 To date, the pair has rolled back by 50%, as was planned in the said strategy. 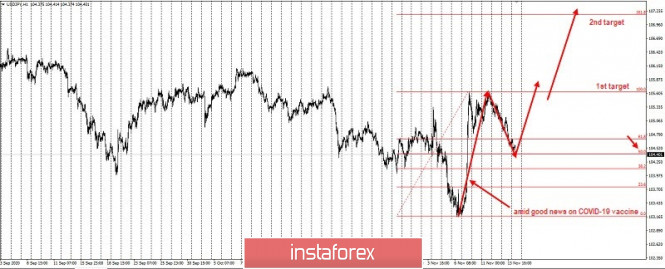 Now, since the quotes have formed a three-wave pattern (ABC), in which wave "A" is the bullish impulse amid good news on COVID-19 vaccine, long positions should again be set at the current prices, up to two take profit levels: First is at 105.7, or on the breakdown of the long initiative. The second is at 1.7, or 161.8% Fibonacci. This strategy is relevant until the quote breaks below the level of 103.4 The risk / profit ratio of such transactions are 1.5: 1. Of course, traders still need to manage and control the risks in order to avoid losing profit. As we all know, trading in this market is very precarious and uncertain, but also very profitable provided that we use the right approach. Price Action and Stop Hunting were used for the above strategy. Good luck! Technical recommendations for EUR/USD and GBP/USD on November 16 2020-11-16 EUR / USD 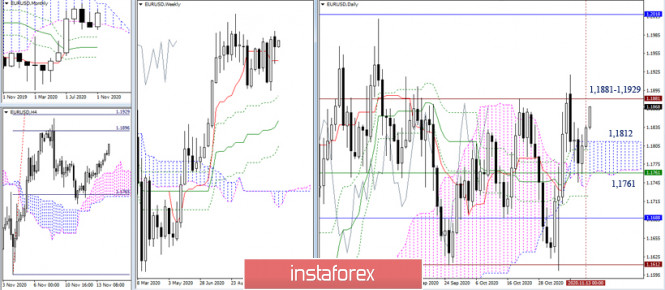 The bulls successfully entered the bullish zone, relative to the daily cloud (1.1812) and retained the weekly short-term (1.1761) after closing last week's trading. Now, if the main goal is broken, we can move towards the area of 1.1881 - 1.1929 (historical level + 100% target development for the breakdown of the H4 cloud), which makes it possible to make further plans. On the other hand, the support levels of 1.1812 (daily Senkou Span B) and 1.1761 (daily Kijun + daily Senkou Span A + weekly Tenkan) retained their locations and values. 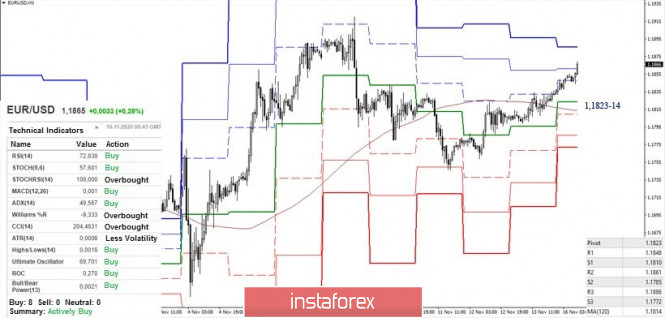 The preferences in the smaller time frames are currently on the bulls' side, who rose and are now testing the second resistance level of 1.1861. The third resistance is located at 1.1886, followed by our next value which is the high extremum (1.1920). In turn, the key support levels for this TF are now joining forces around 1.1823-14 (central pivot level + weekly long-term trend). A break through below which will change the current balance of power. Meanwhile, the support for classic pivot levels are located at 1.1810 - 1.1785 - 1.1772 today. GBP / USD 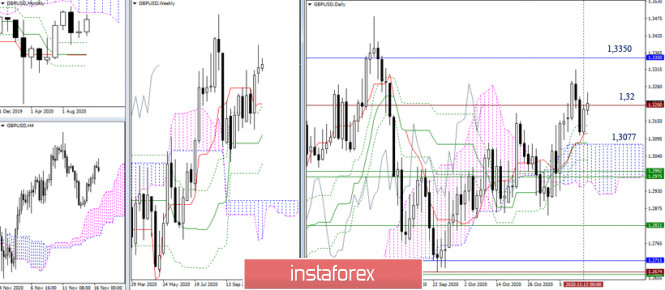 The pound continues to fight for the all-time level of 1.32. The next benchmark is the lower limit of the monthly cloud (1.3350). On the other hand, the nearest support, which is allowing the bulls to maintain prospects and defend the advantages, can be noted at 1.3077 - 1.3112 (upper limit of the daily cloud + daily cross). Further, the support area will be important, combining the weekly levels (1.2990-75) and the lower limit of the daily cloud. A consolidation below can significantly affect the distribution of forces and the bears' activity. 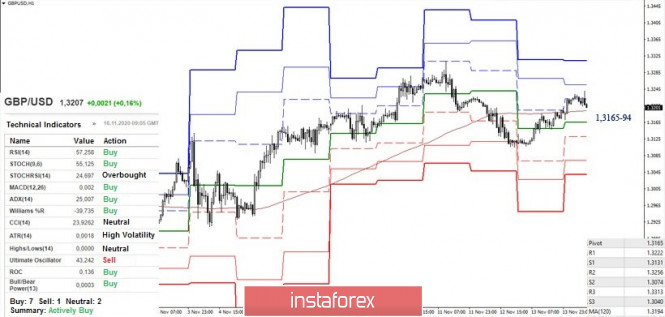 At the moment, the pair has returned to test the key levels of the smaller time frames of 1.3165-94 (central pivot level + weekly long-term trend). A consolidation above these levels will favor the bulls, while a consolidation below which will swing the balance towards the bears' advantage and strengthen bearish moods. The classic pivot levels are the main pivot points for movement within the day. Today, they are located at 1.3222 - 1.3256 - 1.3313 (resistance) and 1.3131 - 1.3074 - 1.3040 (support). Ichimoku Kinko Hyo (9.26.52), Pivot Points (classical), Moving Average (120) Analysis of Gold for November 16,.2020 - New downside cycle started on the Gold with ptoetnial for test of $1.850 and $1.820 2020-11-16 Bundesbank warns that German economy could stagnate or shrink in Q4 this year Bundesbank remarks in its latest monthly report - But economic hit from virus curbs to be less severe than in Q2
- Stabilising fiscal policy remains important next year
- Government has enough scope to significantly expand public stabilisation if needed
- It remains a challenge to calibrate measures to address health crisis while disrupting the economy as little as possible
Some token remarks there by the German central bank, as this is very much anticipated as we gauge the Q4 outlook for the euro area economy as a whole as well. If the tighter restrictions are extended beyond the end of this month, expect that to weigh more on the economic outlook and that should very well keep bunds underpinned. 
Further Development 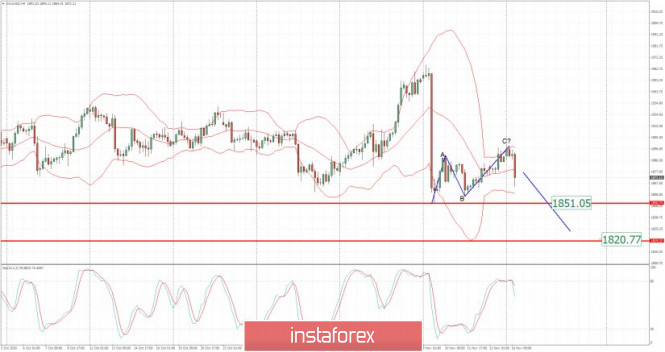
Analyzing the current trading chart of Gold, I found that there is completion of the ABC upside correction and that new downside wave started. 1-Day relative strength performance Finviz 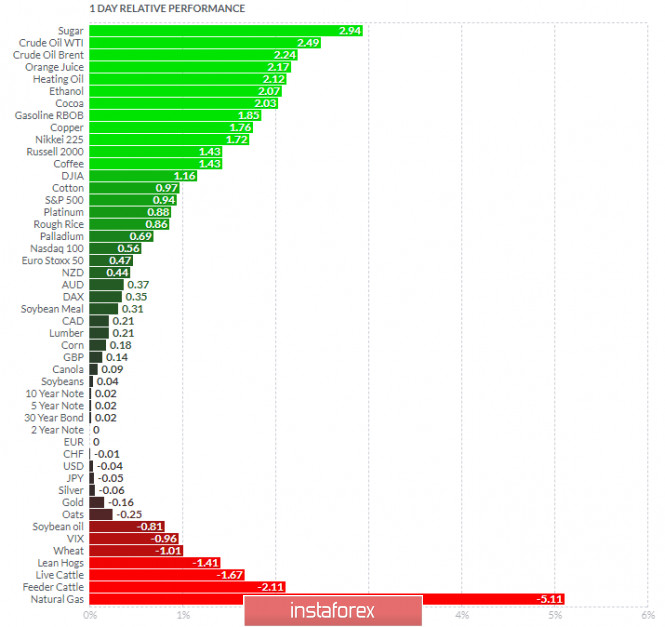
Based on the graph above I found that on the top of the list we got Sugar and Crude Oil today and on the bottom Natural gas and Lean Hogs. Gold is downside on the list.... Key Levels: Resistance: $1,900 Support levels: $1,850 and $1,820. EUR/USD analysis for November 16 2020 - Breakout of the rising channel and potential for another downside leg towards 1.1750 2020-11-16 It is getting terribly late and may be too late already for a Brexit deal, says EU official Let's see if we have a deal this week and if we have a deal at all This just adds to the current rhetoric that time is wasting away as we count down to yet another Brexit "deadline" at the end of this week, with some rough idea that it is more likely to be some time at the end of November instead. Further Development 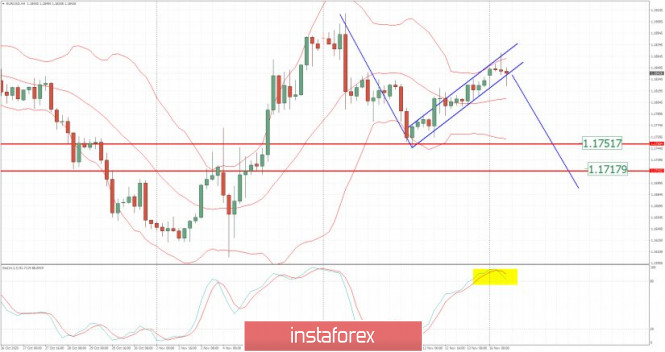
Analyzing the current trading chart of EUR/USD, I found that there is breakout oof the well defined upside channel, which is sign that buyers got exhausted and that sellers are taking control. My advice is to watch for selling opportunities on the rallies with the downside targets at 1,1750 and 1,1715. 1-Day relative strength performance Finviz 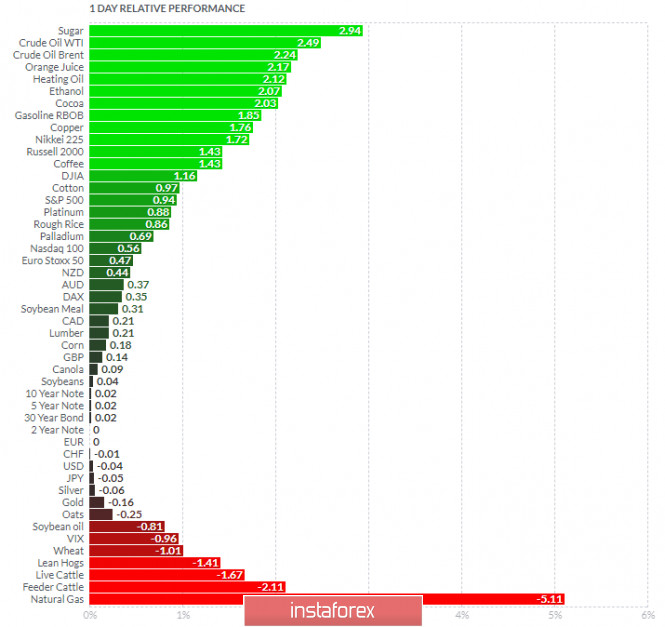
Based on the graph above I found that on the top of the list we got Sugar and Crude Oil today and on the bottom Natural gas and Lean Hogs. Key Levels: Resistance: $1,1870 Support levels: 1,1750 and 1,1715
Author's today's articles: Vladislav Tukhmenev  Vladislav graduated from Moscow State University of Technologiy and Management. He entered the forex market in early 2008. Vladislav is a professional trader, analyst, and manager. He applies a whole gamut of analysis – technical, graphical, mathematical, fundamental, and candlestick analysis. Moreover, he forecasts the market movements using his own methods based on the chaos theory. Vladimir took part in development of trading systems devoted to fractal analysis. In his free time, Vladimir blogs about exchange markets. Hobbies: active leisure, sporting shooting, cars, design, and marketing. "I do not dream only of becoming the best in my field. I also dream about those who I will take with me along the way up." Vladislav graduated from Moscow State University of Technologiy and Management. He entered the forex market in early 2008. Vladislav is a professional trader, analyst, and manager. He applies a whole gamut of analysis – technical, graphical, mathematical, fundamental, and candlestick analysis. Moreover, he forecasts the market movements using his own methods based on the chaos theory. Vladimir took part in development of trading systems devoted to fractal analysis. In his free time, Vladimir blogs about exchange markets. Hobbies: active leisure, sporting shooting, cars, design, and marketing. "I do not dream only of becoming the best in my field. I also dream about those who I will take with me along the way up." Ivan Aleksandrov  Ivan Aleksandrov Ivan Aleksandrov Andrey Shevchenko  Andrey Shevchenko Andrey Shevchenko Sergey Belyaev  Born December 1, 1955. In 1993 graduated from Air Force Engineering Academy. In September 1999 started to study Forex markets. Since 2002 has been reading lectures on the technical analysis . Is fond of research work. Created a personal trading system based on the indicator analysis. Authored the book on technical analysis "Calculation of the next candlestick". At present the next book is being prepared for publishing "Indicator Analysis of Forex Market. Trading System Encyclopedia". Has created eleven courses on indicator analysis. Uses classical indicators. Works as a public lecturer. Held numerous seminars and workshops presented at international exhibitions of financial markets industry. Is known as one of the best specialists in the Russian Federation researching indicator analysis. Born December 1, 1955. In 1993 graduated from Air Force Engineering Academy. In September 1999 started to study Forex markets. Since 2002 has been reading lectures on the technical analysis . Is fond of research work. Created a personal trading system based on the indicator analysis. Authored the book on technical analysis "Calculation of the next candlestick". At present the next book is being prepared for publishing "Indicator Analysis of Forex Market. Trading System Encyclopedia". Has created eleven courses on indicator analysis. Uses classical indicators. Works as a public lecturer. Held numerous seminars and workshops presented at international exhibitions of financial markets industry. Is known as one of the best specialists in the Russian Federation researching indicator analysis. l Kolesnikova  text text Zhizhko Nadezhda  Graduated from Irkutsk State University. Having acquainted with Forex market in 2008, followed the courses in the International Academy of Stock Exchange Trading. The agenda was so exiting that she moved to St. Petersburg in order to get professional education. Obtained a diploma of the retraining course on the discipline Exchange market and stock market issues, defended the graduation paper with distinction on the subject "Modern technical indicators as the basis of the trading system". At the moment obtains a master degree in International Banking Institute on specialty Financial markets and investments. Apart from trading is occupied with development of trading systems and formalization of the working strategies using Ichimoku indicator. At the moment is working on the book dedicated to the peculiarities of Ichimoku indicator and its operating methods. Interests: yoga, literature, travelling and photograph. "You can only get smarter by playing a smarter opponent" Basics of Chess play, 1883 "Successful people change by themselves, the others are changed by life" Jim Rohn Graduated from Irkutsk State University. Having acquainted with Forex market in 2008, followed the courses in the International Academy of Stock Exchange Trading. The agenda was so exiting that she moved to St. Petersburg in order to get professional education. Obtained a diploma of the retraining course on the discipline Exchange market and stock market issues, defended the graduation paper with distinction on the subject "Modern technical indicators as the basis of the trading system". At the moment obtains a master degree in International Banking Institute on specialty Financial markets and investments. Apart from trading is occupied with development of trading systems and formalization of the working strategies using Ichimoku indicator. At the moment is working on the book dedicated to the peculiarities of Ichimoku indicator and its operating methods. Interests: yoga, literature, travelling and photograph. "You can only get smarter by playing a smarter opponent" Basics of Chess play, 1883 "Successful people change by themselves, the others are changed by life" Jim Rohn Petar Jacimovic  Petar was born on July 08, 1989 in Serbia. Graduated from Economy University and after has worked as a currency analyst for large private investors. Petar has been involved in the world of finance since 2007. In this trading he specializes in Volume Price Action (volume background, multi Fibonacci zones, trend channels, supply and demand). He also writes the market analytical reviews for Forex forums and websites. Moreover Petar is forex teacher and has wide experience in tutoring and conducting webinars. Interests : finance, travelling, sports, music "The key to success is hard work" Petar was born on July 08, 1989 in Serbia. Graduated from Economy University and after has worked as a currency analyst for large private investors. Petar has been involved in the world of finance since 2007. In this trading he specializes in Volume Price Action (volume background, multi Fibonacci zones, trend channels, supply and demand). He also writes the market analytical reviews for Forex forums and websites. Moreover Petar is forex teacher and has wide experience in tutoring and conducting webinars. Interests : finance, travelling, sports, music "The key to success is hard work"
Subscription's options management Theme's:
Fundamental analysis, Fractal analysis, Wave analysis, Technical analysis, Stock Markets
Author's :
A Zotova, Aleksey Almazov, Alexander Dneprovskiy, Alexandr Davidov, Alexandros Yfantis, Andrey Shevchenko, Arief Makmur, Dean Leo, Evgeny Klimov, Fedor Pavlov, Grigory Sokolov, I Belozerov, Igor Kovalyov, Irina Manzenko, Ivan Aleksandrov, l Kolesnikova, Maxim Magdalinin, Mihail Makarov, Mohamed Samy, Mourad El Keddani, Oleg Khmelevskiy, Oscar Ton, Pavel Vlasov, Petar Jacimovic, R Agafonov, S Doronina, Sebastian Seliga, Sergey Belyaev, Sergey Mityukov, Stanislav Polyanskiy, T Strelkova, Torben Melsted, V Isakov, Viktor Vasilevsky, Vladislav Tukhmenev, Vyacheslav Ognev, Yuriy Zaycev, Zhizhko Nadezhda
Edit data of subscription settings
Unsubscribe from the mailing list Sincerely,
Analysts Service | If you have any questions, you can make a phone call using one of the
InstaForex Toll free numbers right now:
|  |  InstaForex Group is an international brand providing online trading services to the clients all over the world. InstaForex Group members include regulated companies in Europe, Russia and British Virgin Islands. This letter may contain personal information for access to your InstaForex trading account, so for the purpose of safety it is recommended to delete this data from the history. If you have received this letter by mistake, please contact InstaForex Customer Relations Department. |


 Vladislav graduated from Moscow State University of Technologiy and Management. He entered the forex market in early 2008. Vladislav is a professional trader, analyst, and manager. He applies a whole gamut of analysis – technical, graphical, mathematical, fundamental, and candlestick analysis. Moreover, he forecasts the market movements using his own methods based on the chaos theory. Vladimir took part in development of trading systems devoted to fractal analysis. In his free time, Vladimir blogs about exchange markets. Hobbies: active leisure, sporting shooting, cars, design, and marketing. "I do not dream only of becoming the best in my field. I also dream about those who I will take with me along the way up."
  Ivan Aleksandrov
  Andrey Shevchenko
  Born December 1, 1955. In 1993 graduated from Air Force Engineering Academy. In September 1999 started to study Forex markets. Since 2002 has been reading lectures on the technical analysis . Is fond of research work. Created a personal trading system based on the indicator analysis. Authored the book on technical analysis "Calculation of the next candlestick". At present the next book is being prepared for publishing "Indicator Analysis of Forex Market. Trading System Encyclopedia". Has created eleven courses on indicator analysis. Uses classical indicators. Works as a public lecturer. Held numerous seminars and workshops presented at international exhibitions of financial markets industry. Is known as one of the best specialists in the Russian Federation researching indicator analysis.
  text
text  Graduated from Irkutsk State University. Having acquainted with Forex market in 2008, followed the courses in the International Academy of Stock Exchange Trading. The agenda was so exiting that she moved to St. Petersburg in order to get professional education. Obtained a diploma of the retraining course on the discipline Exchange market and stock market issues, defended the graduation paper with distinction on the subject "Modern technical indicators as the basis of the trading system". At the moment obtains a master degree in International Banking Institute on specialty Financial markets and investments. Apart from trading is occupied with development of trading systems and formalization of the working strategies using Ichimoku indicator. At the moment is working on the book dedicated to the peculiarities of Ichimoku indicator and its operating methods. Interests: yoga, literature, travelling and photograph. "You can only get smarter by playing a smarter opponent" Basics of Chess play, 1883 "Successful people change by themselves, the others are changed by life" Jim Rohn
  Petar was born on July 08, 1989 in Serbia. Graduated from Economy University and after has worked as a currency analyst for large private investors. Petar has been involved in the world of finance since 2007. In this trading he specializes in Volume Price Action (volume background, multi Fibonacci zones, trend channels, supply and demand). He also writes the market analytical reviews for Forex forums and websites. Moreover Petar is forex teacher and has wide experience in tutoring and conducting webinars. Interests : finance, travelling, sports, music "The key to success is hard work"
No comments:
Post a Comment