| EUR/USD: plan for the European session on November 10. COT reports. Euro under pressure as eurozone situations worsens due to the coronavirus 2020-11-10 To open long positions on EUR/USD, you need: The situation was rather calm yesterday morning, and we did not see any signals to enter the market, but then the situation became completely different in the afternoon. Let's take a look at the 5-minute chart and break down the trades. An unsuccessful attempt to go beyond 1.1915 with a false breakout there, resulted in the euro being sold. I advised you to sell the euro in this scenario. A short pause at 1.1854 and its breakdown pulled down EUR/USD to a low of 1.1797, from where I recommended opening long positions immediately on a rebound. Unfortunately, we did not wait for an entry point into short positions from 1.185, because after the price went beyond this range, it reversed and this level was not tested. 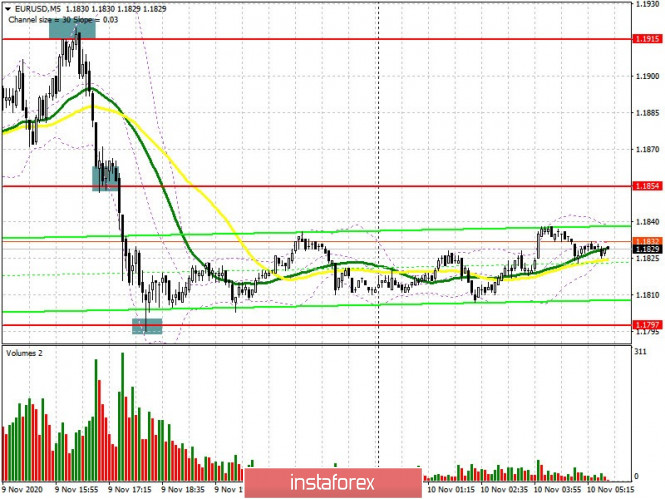 Buyers of the euro will also be focused on protecting the 1.1797 support, which was updated in yesterday's US session. It will be quite difficult for the bulls to do this, considering today's fundamental report on the economy of Germany and the eurozone. Therefore, forming a false breakout there will be a signal to open long positions in hopes to bring back the bullish trend that we saw last week. An equally important goal for the bulls is to go beyond and settle above the resistance of 1.1860, this is where the moving averages are, which are already playing on the side of the bears. Being able to settle in this range produces a signal for opening long positions, in hopes to recover to a high of 1.1915 and its update in the 1.1964 area, where I recommend taking profits. It is possible to sustain the downward correction if bulls are not active at the 1.1797 level. Therefore, in this scenario, I recommend opening new long positions, but only after support at 1.1743 has been updated, or for a rebound from the 1.1701 level, counting on a rebound of 15-20 points within the day. To open short positions on EUR/USD, you need: Sellers need to form a false breakout in the resistance area of 1.1860, which will be a signal to open short positions, in hopes to end the bull market and form a downward correction. This can be done if we receive weak data on the index of business activity in the euro area, which will be released in the first half of the day. The first target in such a scenario will be the low of 1.1797, which we failed to break through yesterday. However, you can only sell from this range and test this area from the bottom up. In this case, the price would fall towards 1.1743, and support at 1.1701 will be the next target for the middle of the week, which is where I recommend taking profits. If bears are not active at the resistance area of 1.1860, it is best to refrain from selling until yesterday's high at 1.1915 has been tested, or open short positions immediately on a rebound from the resistance at 1.1964, counting on a correction of 15-20 points within the day. The Commitment of Traders (COT) report for November 3 recorded a reduction in long positions and an increase in short positions. Despite this, buyers of risky assets believe in the continuation of the bull market, although they prefer to proceed with caution. Thus, long non-commercial positions fell from 217,443 to 208,237, while short non-commercial positions rose from 61,888 to 67,888. The total non-commercial net position fell to 140,349, from 155,555 a week earlier. However, the bullish sentiment on the euro remains rather high in the medium term, especially after the victory of Joe Biden, who intends to endow the US economy with the next largest monetary aid package worth more than $2 trillion. 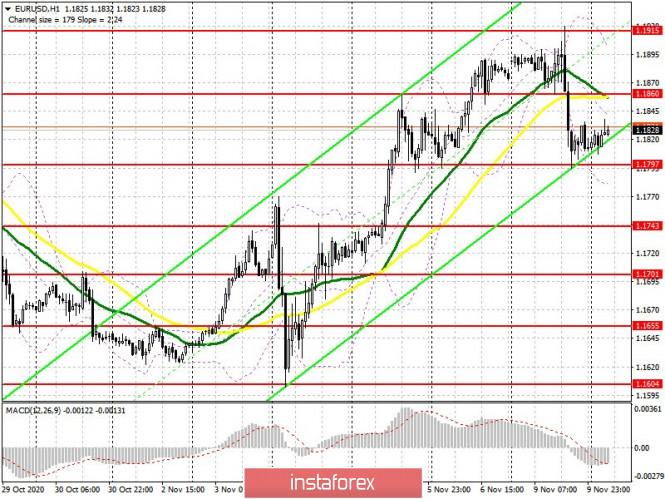 Indicator signals: Moving averages Trading is carried out below 30 and 50 moving averages, which indicates the likelihood of further downward correction of the euro. Note: The period and prices of moving averages are considered by the author on the H1 chart and differs from the general definition of the classic daily moving averages on the D1 daily chart. Bollinger Bands In case of a decline, support will be provided by the lower border of the indicator at 1.1785. Growth will be limited by the upper level of the indicator around 1.1900. Description of indicators - Moving average (moving average, determines the current trend by smoothing out volatility and noise). Period 50. It is marked in yellow on the chart.
- Moving average (moving average, determines the current trend by smoothing out volatility and noise). Period 30. It is marked in green on the chart.
- MACD indicator (Moving Average Convergence/Divergence — convergence/divergence of moving averages) Quick EMA period 12. Slow EMA period to 26. SMA period 9
- Bollinger Bands (Bollinger Bands). Period 20
- Non-commercial speculative traders, such as individual traders, hedge funds, and large institutions that use the futures market for speculative purposes and meet certain requirements.
- Long non-commercial positions represent the total long open position of non-commercial traders.
- Short non-commercial positions represent the total short open position of non-commercial traders.
- Total non-commercial net position is the difference between short and long positions of non-commercial traders.
GBP/USD: plan for the European session on November 10. COT reports. Pound buyers set for new highs, await breakout of 1.3205 2020-11-10 To open long positions on GBP/USD, you need: The bulls' unsuccessful attempt to stay above support at 1.3154, which was tested at the beginning of the US session, caused the pair to fall below this range. If you look at the 5-minute chart, you will see how the breakout and being able to settle below 1.3154, and also testing this level from the bottom up, had produced a signal to open short positions. The movement was around 30 points. 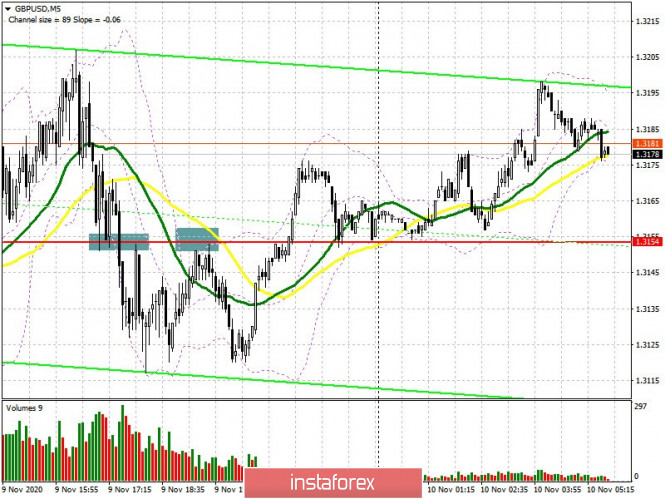 Take note that the technical picture has practically not changed, except for the appearance of two new resistances. We can count on the pound's succeeding growth in the short term as long as it keeps moving above the 1.3154 level. Testing the 1.3154 area from top to bottom and forming a false breakout on it in the first half of the day will be a signal to open long positions. But this will only happen if we receive a good report on the UK labor market. The rate of unemployment is of particular importance, where growth is expected. In case a false breakout is formed at 1.3154, GBP/USD will aim for a high of 1.3205, being able to settle above will open a direct path to the 1.3261 area, and the next goal will be resistance at 1.3315, which is where I recommend taking profit. However, this scenario will only be realized if we receive good news on Brexit. If the pair returns to the area below 1.3154, similar to yesterday, it is best to postpone long positions until the 1.3094 low has been updated, or buy GBP/USD immediately to rebound from support at 1.3034, counting on a correction of 20-30 points within the day. To open short positions on GBP/USD, you need: Sellers need to regain the 1.3154 level again, since being able to settle below it will increase the pressure on the pair and could also bring back the bear market. The initial goal is to test the 1.3094 level, which the bears failed to reach yesterday. However, we can only speak of a larger downward trend if we settle below this range, which will create a new signal to sell the pound and lead to updating support at 1.3034. The sellers' main target for the middle of this week will be the 1.2967 area, where I recommend taking profits. An equally important task for the bears is to protect resistance at 1.3205 in the first half of the day. Forming a false breakout there along with weak data on the UK labor market will be a signal to sell the pound. In the absence of activity at this level, it is best to postpone short positions and wait until the 1.3261 high has been tested, where you can sell the pound immediately on a rebound. Also, a rather interesting area for opening short positions is the high of 1.3315, from which we expect a correction of 20-30 points within the day. The Commitment of Traders (COT) report for November 3 showed a reduction in long positions and a slight increase in short ones. Long non-commercial positions fell from 31,799 to 27,701. At the same time, short non-profit positions only rose to 38,928, from 38,459. As a result, the negative non-commercial net position was 11,227, against 6,660 a week earlier, which indicates that sellers of the British pound remain in control and have a minimal advantage in the current situation. 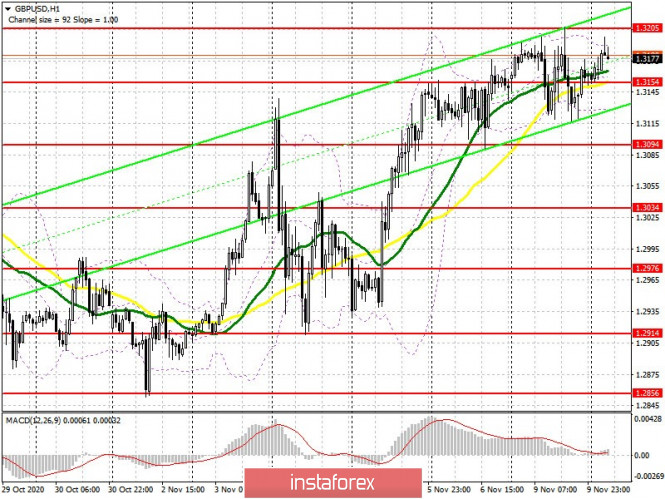 Indicator signals: Moving averages Trading is carried out in the area of 30 and 50 moving averages, which indicates the equality of buyers and sellers. Note: The period and prices of moving averages are considered by the author on the H1 chart and differs from the general definition of the classic daily moving averages on the D1 daily chart. Bollinger Bands A breakout of the upper border at 1.3188 will lead to a new wave of growth in the pound. A break of the lower border of the indicator around 1.3130 will increase the pressure by the pound. Description of indicators - Moving average (moving average, determines the current trend by smoothing out volatility and noise). Period 50. It is marked in yellow on the chart.
- Moving average (moving average, determines the current trend by smoothing out volatility and noise). Period 30. It is marked in green on the chart.
- MACD indicator (Moving Average Convergence/Divergence — convergence/divergence of moving averages) Quick EMA period 12. Slow EMA period to 26. SMA period 9
- Bollinger Bands (Bollinger Bands). Period 20
- Non-commercial speculative traders, such as individual traders, hedge funds, and large institutions that use the futures market for speculative purposes and meet certain requirements.
- Long non-commercial positions represent the total long open position of non-commercial traders.
- Short non-commercial positions represent the total short open position of non-commercial traders.
- Total non-commercial net position is the difference between short and long positions of non-commercial traders.
Elliott wave analysis of EUR/JPY for November 10, 2020 2020-11-10 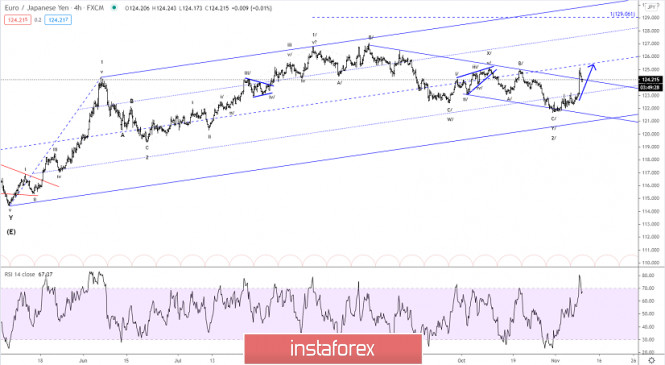
EUR/JPY has finally rallied and broken clearly above resistance at 123.18 confirming that wave 2/ completed the test of 121.59. Wave 3/ now is in motion for a rally above the peak of wave 1/ at 127.02. It may rise higher towards at least 129.38. Short-term support is now seen at 123.67 and strong support is seen at 123.18, but we doubt that the ongoing minor correction will be able to correct that far. R3: 125.83 R2: 125.00 R1: 124.31 Pivot: 124.00 S1: 123.67 S2: 123.18 S3: 122.59 Trading recommendation: We are long EUR from 122.25 and we will move our stop higher to 122.95 Elliott wave analysis of GBP/JPY for November 10, 2020 2020-11-10 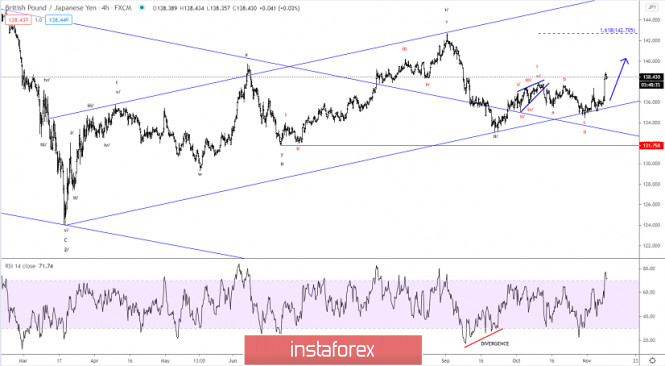 GBP/JPY has finally rallied and broken resistance at 137.87 with behavior indicating that red wave iii now is in motion for a rally towards at least 142.72 and likely a lot higher. Short-term support is now seen at 137.87 which ideally will be able to protect the downside for the next push higher to 139.82 on the way higher to 142.72. If support at 137.82 is broken, we could see the ongoing minor correction dip closer to 136.68 before taking off again. R3: 140.59 R2: 139.82 R1: 138.94 Pivot: 138.38 S1: 137.87 S2: 137.32 S3: 136.68 Trading recommendation: We are long GBP from 135.45 and we will move our stop higher to 136.00 Analytics and trading signals for beginners. How to trade EUR/USD on November 10? Plan for opening and closing trades on Tuesday 2020-11-10 Hourly chart of the EUR/USD pair 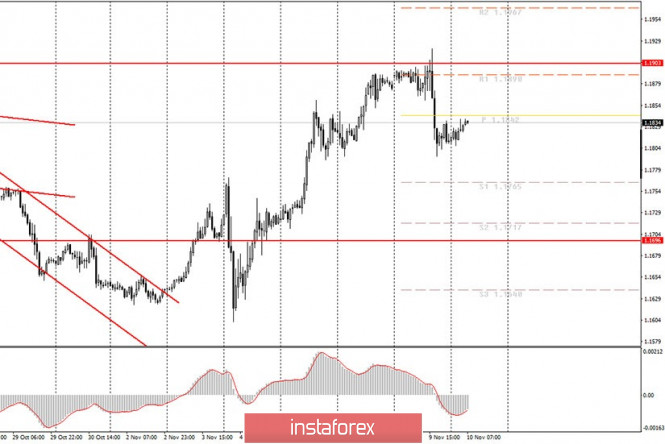 The EUR/USD pair started a new round of upward correction last night, as we expected. The correction is weak. The MACD indicator started discharging to the zero level and this is the most important thing. We can expect a strong signal to appear in a few hours. Unfortunately, there is still no trendline or trend channel that novice traders could use. Therefore, we conclude that a short-term downward trend is solely based on the price rebound from the 1.1903 level, which did not let the price rise above itself. Based on these considerations, we consider the most probable scenario for the development of events - a further downward movement to the lower border of the 1.1696 horizontal channel. You are advised to return to buy positions in the current conditions after confidently overcoming the 1.1903 level. The first trading day of the week was quite volatile and interesting. The euro/dollar fell during the US session. We predicted this scenario, as the markets should have started to calm down after the election week in the United States. Consequently, the pressure from the dollar should have subsided. And then there's the news from the United States: American company Pfizer has conducted successful clinical trials on a vaccine against the coronavirus and announced a 90% effectiveness of the drug. This is great news for America and the world. Thus, this could partly be a reason why the dollar strengthened. There might be even less news today compared to Monday. At least there is nothing interesting in the macroeconomic calendar. Therefore, we advise you to keep track of news concerning the US political sphere throughout the day. Take note that Joe Biden won the presidential elections, and Donald Trump is going to challenge the results in almost all states in which he lost. It is unclear how this story with the court proceedings will end. However, Trump can create a lot of problems for both America and the greenback. Of course, in his understanding, he longs for the good of the United States, but the markets can regard the president's actions in a completely different way. Thus, news that could potentially worsen the political crisis in America could negatively affect the US dollar. In this case, the euro/dollar pair may start to grow again. Possible scenarios for November 10: 1) Buying the EUR/USD pair ceased to be relevant after the price failed to go beyond the 1.1903 level. Rebounding from this level - and the price fell to 1.1696. Therefore, you can only buy the euro/dollar pair when the downward trend has clearly ended, which is not expected in the near future, or when we overcome the 1.1903 level. 2) Trading for a fall is more relevant at this time, since the price rebounded from 1.1903. So now novice traders are advised to wait until the upward correction has ended and then - a new sell signal from the MACD indicator, which can be rejected with targets at 1.1765 and 1.1717. Unfortunately, there are still no trend lines or channels that support a particular trend at this time. On the chart: Support and Resistance Levels are the Levels that serve as targets when buying or selling the pair. You can place Take Profit near these levels. Red lines are the channels or trend lines that display the current trend and show in which direction it is better to trade now. Up/down arrows show where you should sell or buy after reaching or breaking through particular levels. The MACD indicator (14,22,3) consists of a histogram and a signal line. When they cross, this is a signal to enter the market. It is recommended to use this indicator in combination with trend lines (channels and trend lines). Important announcements and economic reports that you can always find in the news calendar can seriously influence the trajectory of a currency pair. Therefore, at the time of their release, we recommended trading as carefully as possible or exit the market in order to avoid a sharp price reversal. Beginners on Forex should remember that not every single trade has to be profitable. The development of a clear strategy and money management are the key to success in trading over a long period of time. AUD/USD. Beijing threatens Canberra through media 2020-11-10 The AUD/USD pair failed to consolidate within the 73rd figure. Yesterday's strengthening of the US dollar, as well as the ongoing conflict between Canberra and Beijing, did not allow the Australian one to stay on the reached highs. This suggests that the prospects for the growth of the AUD/USD pair primarily depend on the condition of the US dollar, which, in turn, is trading amid a conflicting fundamental background. This is further complicated by the fact that the "Aussie" is at the borders of a wide price range of 0.70-0.73. The last time the indicated currency pair tried to reach 0.73 was at the end of August this year. However, buyers only managed to consolidate in this price area for a few days, followed by a decline. Looking at the wider time range, we see that the pair traded above the level of 0.73 for the last time in 2018 (up to and including September). Since then, the bulls of the AUD/USD pair failed not only to rise to the 0.74 price level, but also to consolidate within the level of 0.73. This "historical digression" suggests that the buyers of the pair are now facing a difficult task: they are located near the limits of quite strong resistance levels, while the fundamental background does not contribute to the impulse growth of the AUD. As mentioned above, the upward prospects for the AUD/USD pair depend only on the weakness of the US currency, which is not in a hurry to give up its positions without rising.  The US dollar is currently trading amid conflicting fundamental backgrounds. On the one hand, there are political events in the US, where Trump expressed his intention to prolong the election by recounting votes. On the other hand, there is positive news regarding COVID-19. One of the vaccines under development showed a good result in the third phase of trials, which surprised the markets yesterday. The dollar rose, together with the stock and oil market. But as a rule, such emotional fundamental factors are only temporary. Therefore, some dollar pairs (in particular USD/JPY and USD/CAD) are showing a price pullback today. In this regard, the Australian dollar showed an "early" result: The AUD/USD pair returned to the level of 0.72 yesterday from the reached high at 0.7341. An additional pressure on the pair was the publication in the Chinese English-language edition "China Daily". Here, the author of the article warns that Australia must make a choice as soon as possible: either Canberra stays away from the conflict between the US and China, or the Australian economy will suffer continuously. It should be noted that the publication of the resonant article was preceded by joint naval exercises of Australia, India and the United States. This is the first such exercise in the past 13 years. According to some experts, this publication is a warning on the part of Beijing. China Daily is an influential and largest (circulation of almost 700 thousand) newspaper, which is oriented "for export". Therefore, such material can be viewed through the spectrum of recent events, including those of sanctions. You should recall that steel mills in China received an official verbal notification of the termination of imports of Australian coal in early October, which led to a price decline for marine coking coal. According to the specialized media, Mongolia replaced Australia as the leading supplier of coking coal to China. Moreover, an anonymous Chinese source told the Reuters news agency that imports of some Australian goods have now virtually ceased and the same could happen with other products. It is rumored that China will discourage imports of Australian cotton, wine, beef and barley. At the same time, wheat, copper concentrate and iron ore are also in question. Media reports said that this is not an official ban, but technical barriers. For example, new import tariffs or new sanitary standards. By the way, there are already the first "victims" of this Chinese policy. It became known recently that several tons of Australian lobsters rotted at Chinese customs. However, China does not officially admit that it is in a state of trade war with Australia. All customs barriers are explained either by technical reasons – the workload of port warehouses or by regulatory innovations (new sanitary rules, etc.). The true reasons for such trends are announced informally, including through the Chinese media. Therefore, the Australian-Chinese conflict exerts background pressure on the AUD only: the Australian dollar is not able to organize its own offensive, but it may well dominate the AUD/USD pair if the US currency weakens. 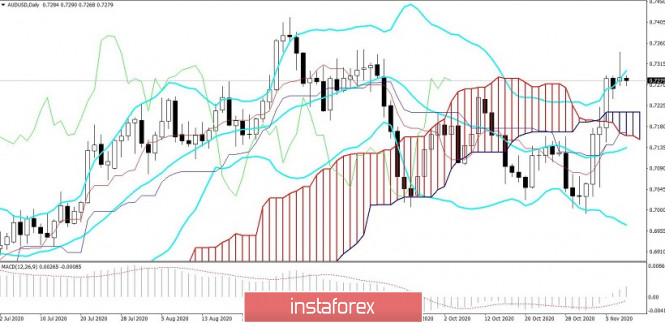 All this suggests that the pair retains the likelihood of retesting the resistance level of 0.7350 (two-month price high). If this price area is reached, it is suggested to close the purchase, simultaneously considering the option of short positions with the goal of 0.7210 (the upper limit of the Kumo cloud on the daily chart). Indicator Analysis. Daily review for the GBP/USD currency pair 11/10/20 2020-11-10 The pair was supposed to continue moving up on Monday, but the news that the American pharmaceutical giant Pfizer and the German company BioNTech announced that their COVID-19 vaccine proved 90% effective outplayed the day's work and instead of the daily white candle, they received a side channel. Today, it is possible to go upward according to economic calendar news and it is expected at 7.00 UTC (pound), 12.00 and 15.00 UTC (dollar). Trend analysis (Fig. 1). Today, the market will try to continue moving up from the level of 1.3165 (the closing of yesterday's daily candle) with the goal of 1.3251-the historical resistance level (blue dotted line). If this level is reached, it will continue going up with the target 1.3373 resistance line (black bold line). 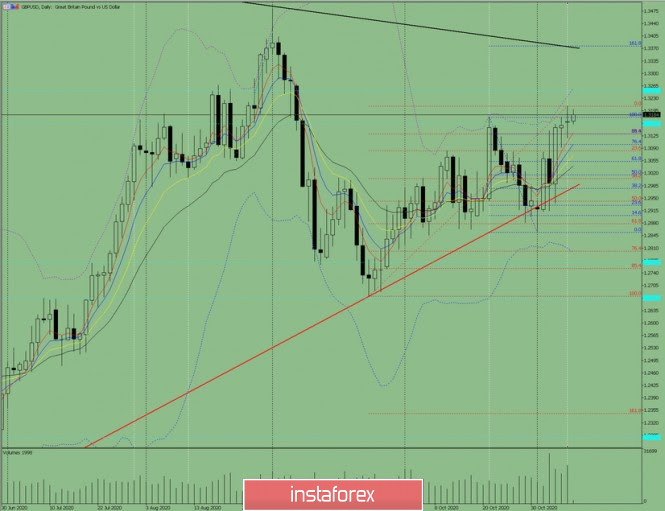 Figure 1 (daily chart). Complex Analysis: General conclusion: Today, the price from the level of 1.3165 (the closing of yesterday's daily candle) will try to continue moving up with the goal of 1.3251 - the historical resistance level (blue dotted line). If this level is reached, it will continue going up with the target 1.3373 resistance line (black bold line). Unlikely scenario: downward movement with a target of 1.3206 – upper fractal (candle from 09.11.2020). If this level is reached, it will go down with the goal of 1.3130 – a pullback level of 14.6% (red dotted line). Technical Analysis of GBP/USD for November 10, 2020 2020-11-10 Technical Market Outlook: The GBP/USD pair has been seen rallying towards the level of 1.3182, which is the key technical resistance for the price. Moreover, the level of 1.3196 is the target level for 1:1 Fibonacci projection of the last wave up and the level of 1.3172 is the 61% Fibonacci retracement of the last wave down on the daily time frame, so some kind of market reaction is expected here: continuation or reversal. If the up move is being continued, then the next target is seen at the level of 1.3258, if there is a reversal - the key technical support is located at the level of 1.2916. Weekly Pivot Points: WR3 - 1.3631 WR2 - 1.3400 WR1 - 1.3312 Weekly Pivot - 1.3083 WS1 - 1.2991 WS2 - 1.2762 WS3 - 1.2666 Trading Recommendations: The GBP/USD pair is in the down trend on the monthly time frame, but the recent bounce from the low at 1.1411 made in the middle of March 2020 looks very strong and might be a reversal swing. In order to confirm the trend change, the bulls have to break through the technical resistance seen at the level of 1.3518. All the local corrections should be used to enter a buy orders as long as the level of 1.2674 is not broken. 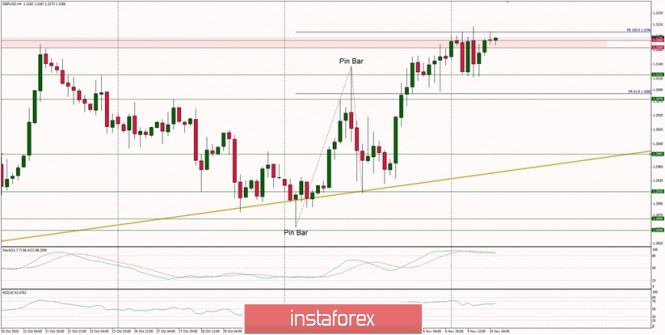
Technical Analysis of EUR/USD for November 10, 2020 2020-11-10 Technical Market Outlook: The EUR/USD pair has tested the key technical resistance located at the level of 1.1908 - 1.1914. The rally was capped at the level of 1.1920 (swing high) and the price reversed after the Bearish Engulfing candlestick pattern was made at H4 time frame chart. The market is currently trading around the level of 1.1822, but there was a low made at the level of 1.1795 already. The local support for intraday traders is seen at the levels of 1.1789 and 1.1803, but if one of this level is violated, then the road towards the next support located at the level of 1.1695 is open. Please notice the market is coming off the overbought conditions, so the pull-back lower should continue. Weekly Pivot Points: WR3 - 1.2308 WR2 - 1.2092 WR1 - 1.2015 Weekly Pivot - 1.1812 WS1 - 1.1717 WS2 - 1.1522 WS3 - 1.1441 Trading Recommendations: Since the middle of March 2020 the main trend is on EUR/USD pair has been up, which can be confirmed by almost 10 weekly up candles on the weekly time frame chart and 4 monthly up candles on the monthly time frame chart. The recent correction towards the level of 1.1612 seems to be completed and now market is ready for another wave up. This means any local corrections should be used to buy the dips until the key technical support is broken. The key long-term technical support is seen at the level of 1.1445. The key long-term technical resistance is seen at the level of 1.2555. 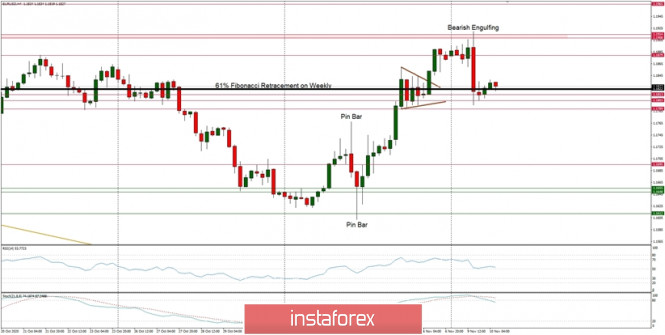
Trading plan for EUR/USD and GBP/USD for 11/10/2020 2020-11-10 The United States continues to please us with stability. For many days, Mr. Trump is just blabbering about election fraud and is filing more and more lawsuits in various courts to achieve a recount of votes and the analysis of all cases of fraud. On the other hand, Mr. Biden announced his unconditional victory and demands to immediately begin the process of transferring power to him. And this is despite the fact that the counting of votes is still ongoing. The main argument of the Democrats is that even if there will be a recount of votes in individual States, Mr. J. Biden still gets more electoral votes than D. Trump. The overall result is still unchanged. It is not surprising that people around the world have less and less confidence in politicians and state institutions. Nevertheless, the suspense of the issue with the results of the US presidential election is gradually beginning to agitate. The markets are somewhat undecided, and investors have no idea where to run or what to do. This is clearly seen in the currency market, which shows no action; although, the single European currency showed a clear downward trend yesterday. This is related to the fact that the United States has successfully tested a coronavirus vaccine. However, this is hard to believe, since we did not see a widespread strengthening of the dollar. Therefore, the strange surge in activity on the single European currency is more like an early speculation. Nevertheless, such a scenario only shows us once again that both the pound and the single European currency are fairly overbought, and the market is just waiting for a reason to adjust. 
Since the single European currency has slightly weakened, it is logical to expect a similar activity from the pound. The UK data on the labor market have been published, but it lacks response. The unemployment rate rose from 4.5% to 4.8%, which is quite significant. The employment declined by 164 thousand, so unemployment continues to grow steadily. Although we were pleased with applications for unemployment benefits, the total number of which declined by 29.8 thousand, with a forecasted growth by 36 thousand. As we can see, the situation in the labor market continues to deteriorate, but the pound is more likely to show an upward trend. Unfortunately, the market is still dominated by the US presidential elections. Employment Change (UK): 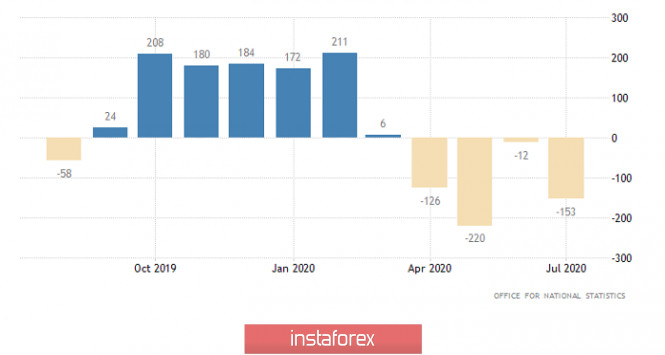
The US data on open vacancies is still being published today, the total number of which may decline from 6,493 thousand to 6,200 thousand. However, this is not surprising, as unemployment in the United States is steadily declining, which means that open vacancies should be increasing. But if the market still continues to focus exclusively on the issues related to the earlier presidential elections, then this data will not affect anything. Job Openings (United States): 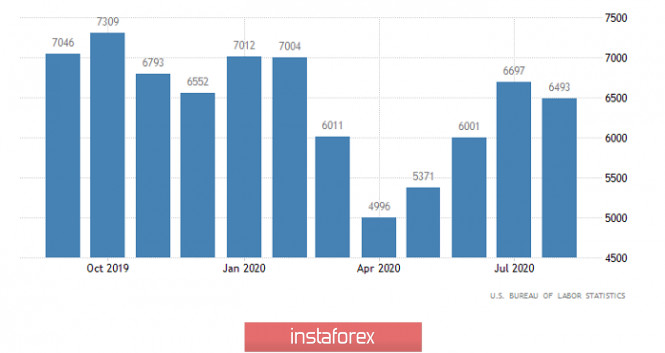
The EUR/USD pair found a volatile pivot point within the level of 1.1800 after a sharp decline, which was followed by a stop and a 30-point pullback. We can assume that if the price consolidates below 1.1790, there will be another round of short positions, which will direct the quote towards 1.1750-1.1700. Otherwise, we are waiting for a side turn within the limits of the current pullback. 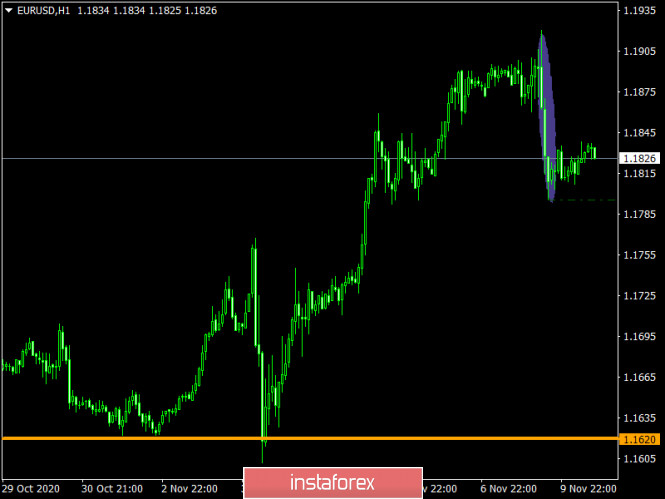
The GBP/USD pair has been moving in the side channel 1.3120/1.3300 for several days in a row, consistently working out the set boundaries. We can assume that the variable amplitude will soon come to its logical conclusion, which will be reflected by a sharp surge in market's activity. The most optimal trading tactic is considered to be the method of breaking the established boundaries. 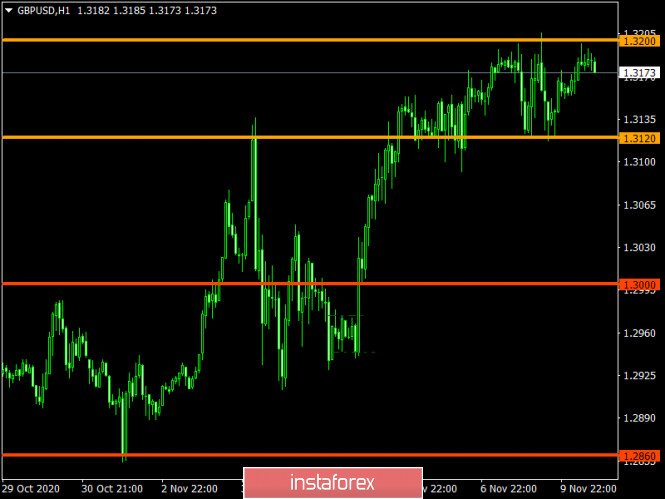
GBP/USD. November 10. COT report. Traders continue to believe in the possibility of a trade deal between the European Union and the UK 2020-11-10 GBP/USD – 1H. 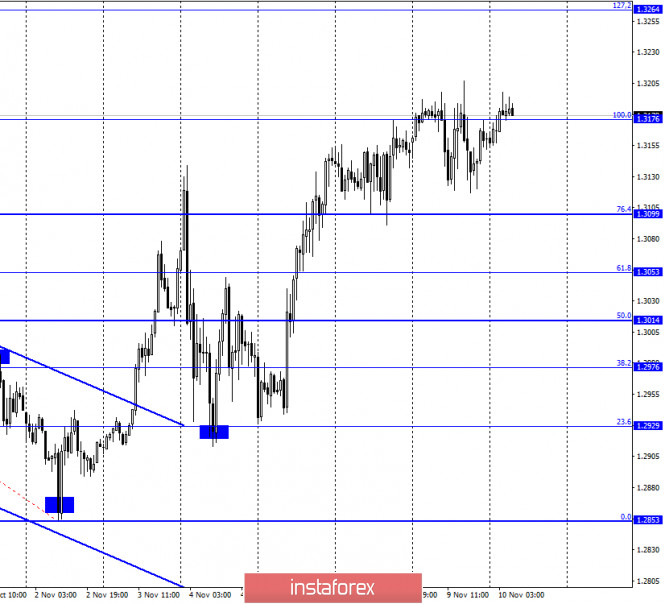
According to the hourly chart, the GBP/USD pair quotes made two attempts to start falling on Monday, but both failed. As a result, the pair returned to the corrective level of 100.0% (1.3176). However, over the past day, three closures were made above this level at once, and none of them led to further growth. Thus, the situation is now difficult with the British. There is not much news from the UK at this time either. A new round of negotiations on a trade agreement has begun in London, however, there is still little chance of reaching an agreement, as Michel Barnier and other participants in the negotiation process have repeatedly stated. It is also unclear how long the negotiations will continue, as the time is gradually approaching December 31, which is just over 1.5 months away. However, you need not only to have time to conclude a deal within this period but also to ratify it in the European Parliament and the British Parliament. In general, I believe that there is almost no chance to make it. It is all the more strange to see the growth of the British at this time. Yesterday, even the European performed a fall, and the pound, which has more reasons to fall, showed amazing resilience. Traders may still believe in reaching an agreement between London and Brussels, however, these are just hopes and dreams. The reality can be much harsher. Boris Johnson also hopes for an agreement with the European Union, an agreement with America. GBP/USD – 4H. 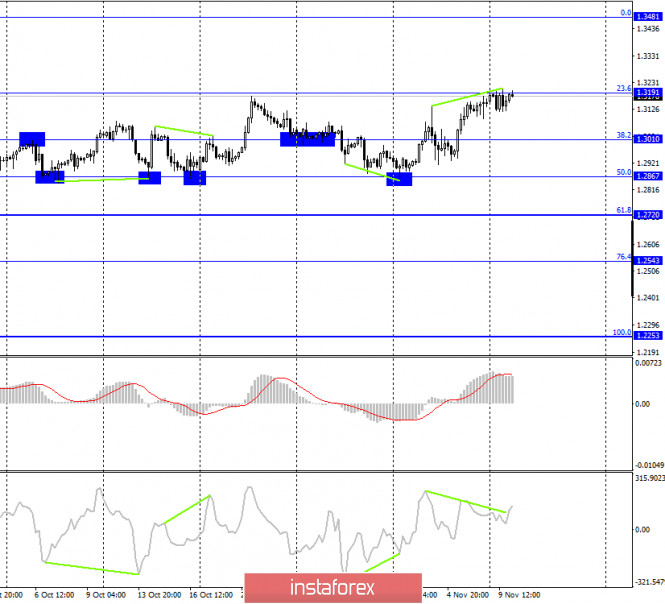
On the 4-hour chart, the GBP/USD pair performed an increase to the corrective level of 23.6% (1.3191). The rebound of quotes from this Fibo level will allow traders to count on a reversal in favor of the US currency and a slight fall in the direction of the Fibo level of 38.2% (1.3010). The looming bearish divergence in the CCI indicator increases the probability of quotes rebounding from the level of 23.6%. Fixing the pair's rate above the level of 23.6% will increase the chances of further growth towards the next Fibo level of 0.0% (1.3481). GBP/USD – Daily. 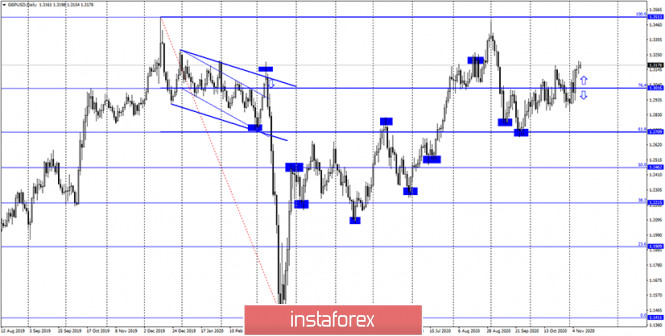
On the daily chart, the pair's quotes have consolidated above the corrective level of 76.4% (1.3016), which now allows us to expect further growth in the direction of the next corrective level of 100.0% (1.3513). GBP/USD – Weekly. 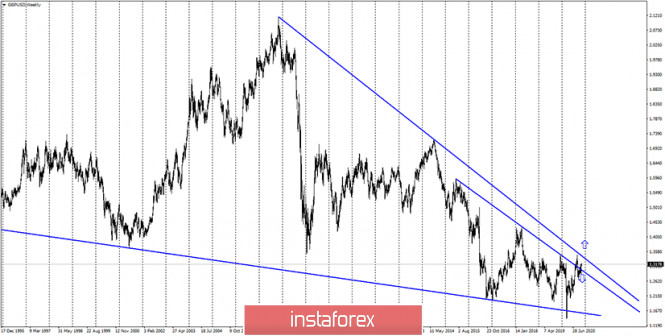
On the weekly chart, the pound/dollar pair closed under the lower downward trend line, thus, a false breakout of this line followed earlier. However, in recent weeks, the pair has made new attempts to gain a foothold over both trend lines. Overview of fundamentals: On Monday, the Governor of the Bank of England, Andrew Bailey, gave a speech in the UK, however, he did not tell traders anything important or interesting. News calendar for the United States and the United Kingdom: UK - change in the number of applications for unemployment benefits (07:00 GMT). UK - unemployment rate (07:00 GMT). UK - change in average earnings (07:00 GMT). On November 10, the news calendar contains a fairly important report on unemployment in the UK. However, in general, traders are not paying much attention to economic reports right now. COT (Commitments of Traders) report: 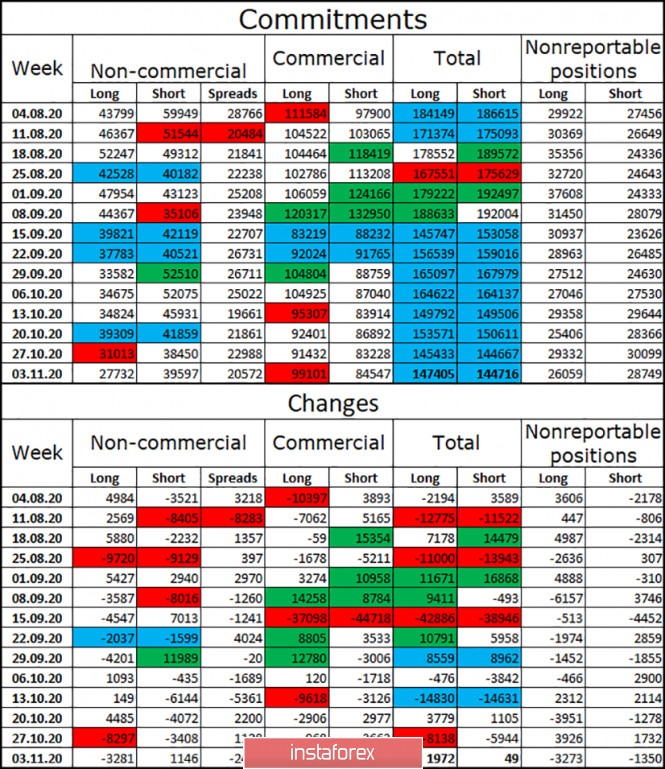
The latest COT report on the British pound showed that the mood of the "Non-commercial" category of traders became even more "bearish" during the reporting week. Speculators continued to get rid of long contracts, closing a total of 3,281 units. At the same time, they slightly increased the number of short contracts, opening 1,146. Thus, the mood of the "Non-commercial" category has become more "bearish". However, due to the US presidential election, the British pound rose strongly last week. This data was not included in the latest COT report, so I can't conclude how the mood of major traders changed after November 2. You need to wait for the next COT report and analyze it. According to the latest report, I can say that the chances of a fall in the British dollar are very high now. Forecast for GBP/USD and recommendations for traders: Today, I recommend selling the GBP/USD pair with targets of 1.3099 and 1.3010, if the rebound from the Fibo level of 23.6% (1.3191) on the 4-hour chart is performed, especially with the formation of a "bearish" divergence. I recommend buying the British dollar with a target of 1.3264 if the close above the level of 1.3191 is completed. Terms: "Non-commercial" - large market players: banks, hedge funds, investment funds, private, large investors. "Commercial" - commercial enterprises, firms, banks, corporations, companies that buy currency not for speculative profit, but for current activities or export-import operations. "Non-reportable positions" - small traders who do not have a significant impact on the price. EUR/USD and GBP/USD: EU unleashes a trade war with the US. Pound traders seem to have forgotten the risks of having a Brexit without a trade deal. 2020-11-10 The US Federal Reserve published its financial stability report yesterday, which once again showed an uncertain future amid the persistent coronavirus pandemic. From the report, it is clear that if the pandemic remains uncontrolled and continues longer than projected, economic recovery will be seriously affected. However though, quite a lot also depends on how quickly the COVID-19 vaccine will spread. 
Against this background, pressure on the European currency returned, which in turn led to the decline of the EUR / USD pair in the market. Since demand for the euro largely depends on the dynamics of economic recovery, a slowdown in growth unequivocally decreases its appeal on traders. To add to that, economic problems have already begun in the eurozone, and this may be confirmed by today's data on business sentiment in Germany and the eurozone. A rather large drop is expected in the indicator for November this year, which will severely affect all outlook as well. And if the lockdown in Europe lasts more than one month, there is a high chance that GDP will have a larger-than-expected slowdown or contraction this 4th quarter. Meanwhile, back to the COVID-19 pandemic, Pfizer Inc. and its partner, BioNTech SE, announced a breakthrough in their development of a vaccine, after successfully completing a third test. According to them, the vaccine may be available earlier than expected, and may be approved for widespread use, thanks to the remarkable results of the research. Pfizer said it plans to request an approval for sale by the end of November, if the data prove its safety. On to other news, a rather important step was taken by the European Union yesterday, when it announced that it intends to impose duties on Boeing planes and other US goods. In fact, the trade differences between the US and the EU have subsided a bit during the outbreak of the coronavirus, as well as after Donald Trump's administration switched to a trade war with China. But since the World Trade Organization has sided with the EU and allowed it to impose duties, the EU is expected to introduce such to the US today. 
To add to that, back in 2019, the United States received a similar permit, thus, it introduced duties on European goods, including Airbus SE aircraft, which to $ 7.5 billion. Now, for the EU's duties to the US, all Boeing models will be subject to a 15% duty, while 25% will be imposed on agricultural raw materials and processed agricultural products. With regards to statistics, the Conference Board published a report on employment trends yesterday, revealing a good increase in the index for October, but also indicated a slowdown in job creation. The data said the index rose to 97.58 points against 96.33 in September, which is in line with the labor market report from the US Department of Labor last Friday. Its report said jobs increased by 638,000 in October, and the unemployment rate dropped to 6.9%. As for the technical picture of the EUR / USD pair, a sharp drop below the level of 1.1860 will indicate a rather negative dynamics for the pair in the near future. Much will depend on the reports regarding the European economy today, because if they disappoint, there is a high chance that the quote will break below the support level of 1.1800. Such a scenario will lead to a bear market, which would push the euro to the lows of 1.1740 and 1.1660. In addition, the bullish trend will only resume after the bulls gain control of the resistance level of 1.1860, as only such could lead to a return to the monthly highs of 1.1915, as well as to a movement towards 1.1970. GBP / USD It seems that the British pound intends to climb up in the markets amid the publication of reports regarding the state of the UK labor market. Apparently, traders are already fed up relying on the news over Brexit, therefore, they intend to concentrate on the new lockdowns and the coronavirus pandemic. These factors are the ones that will set the tone of the Bank of England's decision on interest rates, because if the situation with the pandemic does not improve, there is a high chance that the Central Bank would set key rates into negative levels, which will put a lot of pressure on the British pound. And, having a Brexit without a trade deal will only add to this vinaigrette of bad news and data. 
In any case, the upward potential of the pound will be limited if the UK and the EU fail to reach a trade agreement. The COT reports for the past weeks already indicate sharp reductions in the volume of long positions and an increase in short ones, which suggests that tensions are already increasing over the Brexit issue. Longs have already fallen from 31,799 to 27,701, while shorts rose from 38,459 to 38,928. This led to the net position dropping to -11,227, from -6,660 a week earlier, which means that the bears have retained their control and advantage in the market. As for the technical picture of GBP / USD pair, the further direction of the pound will depend today on the data for the UK labor market, because if they turn out to be worse than the forecasts of economists, the pound will immediately undergo a strong downward correction. A breakout from the support level of 1.3155 will most likely trigger large sell-offs in the GBP / USD pair, mainly because many count on the renewal of support at 1.3094. If the bears manage to break below this range, the quote will test the lows 1.3030 and 1.2970. But if the bulls manage to bring the pound to the 32nd figure, the quote has a chance to move up to the highs of 1.3260 and 1.3340. EUR/USD. November 10. COT report. Donald Trump is going to run for President in 2024 2020-11-10 EUR/USD – 1H. 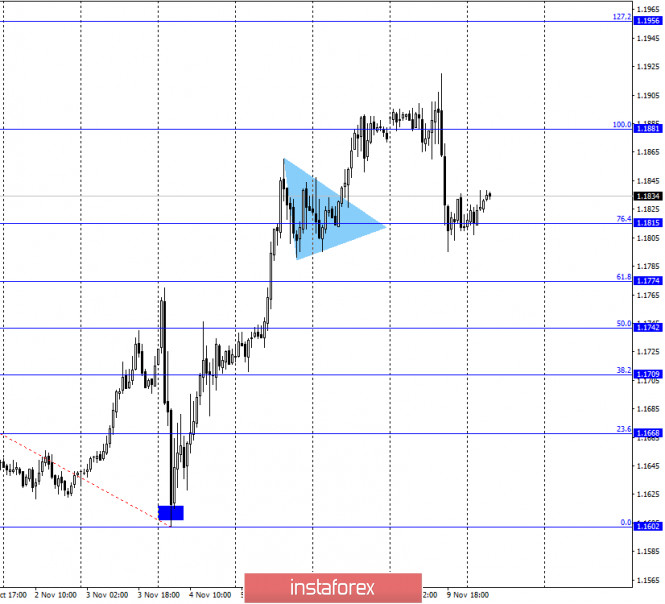
On November 9, the EUR/USD pair performed a sharp reversal in favor of the US currency and fell to the corrective level of 76.4% (1.1815). The rebound of quotes from this level will allow traders to count on a reversal in favor of the EU currency and the resumption of growth in the direction of the corrective level of 100.0% (1.1881). Closing the pair's rate at 76.4% will increase the chances of a further fall towards the next Fibo level of 61.8% (1.1774). In recent days, the Internet has been flooded with information that Donald Trump is not going to admit defeat in the election and will sue almost all the states in which he lost. However, the latest information says that many courts have already rejected Trump's claims, and the campaign team and Trump's entourage advise the President to admit defeat in the election. But Trump wouldn't be Trump if he didn't start making discouraging decisions. First, the President dismissed the head of the Pentagon, Mark Esper. The conflict with Esper began during the mass riots in the United States on racial grounds. Then Trump wanted to suppress riots and rallies with the help of the US army, but the Pentagon refused to take such a step. Second, Trump has already announced his intention to run for President of the United States in 2024. Can this desire be regarded as an admission of defeat in the 2020 elections? Many journalists think so. One way or another, so far Trump is only threatening, but not making any really serious steps towards reviewing the results of the vote. Perhaps because he has no evidence of fraud? EUR/USD – 4H. 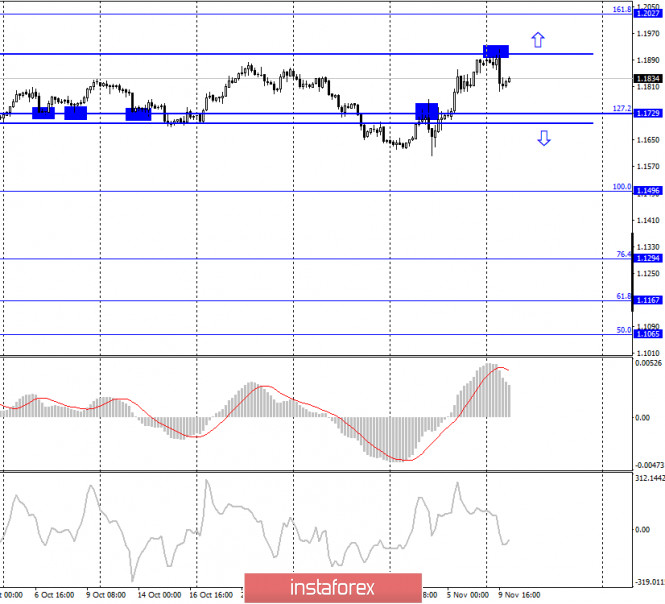
On the 4-hour chart, the pair's quotes rose to the upper border of the sideways trend corridor and rebounded from it. Thus, a reversal was made in favor of the US dollar and a fall began in the direction of the corrective level of 127.2% (1.1729) and the lower border of the side corridor. Closing the pair's rate above the side corridor will allow bull traders to expect further growth in the direction of the Fibo level of 161.8% (1.2027). EUR/USD – Daily. 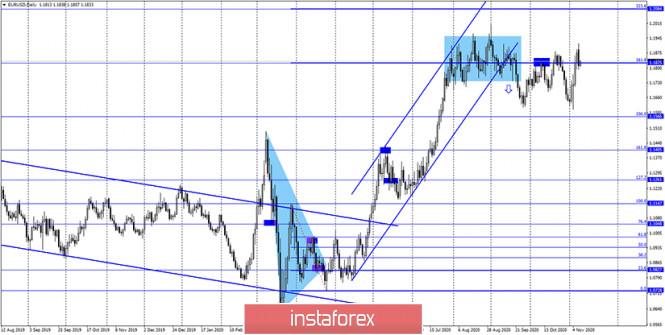
On the daily chart, the quotes of the EUR/USD pair consolidated above the corrective level of 261.8% (1.1825). However, this level remains weak, and now we need to pay more attention to the lower charts, which respond more quickly to changes in the market. EUR/USD – Weekly. 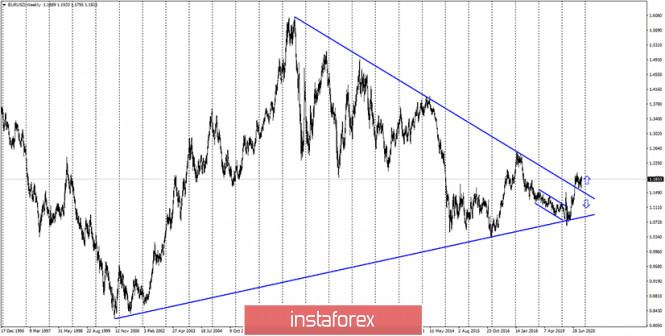
On the weekly chart, the EUR/USD pair performed a consolidation above the "narrowing triangle", which preserves the prospects for further growth of the pair, but in the long term. In the short term, a drop is preferable. Overview of fundamentals: On November 9, the European Union and America did not have a single economic report. Christine Lagarde, the ECB President, spoke, but she did not tell traders anything interesting. Thus, the information background was practically absent on this day. News calendar for the United States and the European Union: EU - business sentiment index from the ZEW Institute (10:00 GMT). On November 10, there is even less news on the calendar of the European Union and America. Just one index of business sentiment, which is unlikely to attract the attention of traders. COT (Commitments of Traders) report: 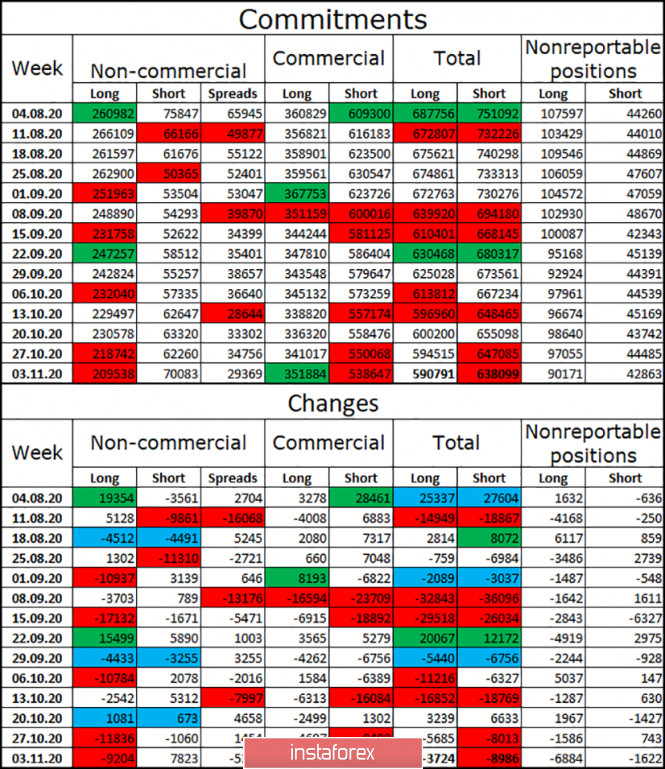
The latest COT report was quite informative. The most important category of "Non-commercial" traders got rid of another 9 thousand long contracts during the reporting week (-12 thousand a week earlier), so speculators continue to get rid of purchases of the euro currency. At the same time, they are also increasing short-contracts, the total number of which has increased by 7.8 thousand. Thus, the strengthening of the "bearish" mood is evident. Based on this, I could conclude that the European currency will fall further, but last week's trading may change the mood of major traders dramatically. The euro has grown by 250 points over the past week, but this growth is not taken into account in the COT report. Only the next report will show how big traders traded after November 2. Forecast for EUR/USD and recommendations for traders: Today, I recommend selling the euro currency with targets of 1.1774 and 1.1742, if the pair closes at the level of 76.4% (1.1815) on the hourly chart. Purchases of the pair will now be possible with targets of 1.1956 and 1.2027 if the quotes perform a consolidation above the side corridor on the 4-hour chart. Terms: "Non-commercial" - major market players: banks, hedge funds, investment funds, private, large investors. "Commercial" - commercial enterprises, firms, banks, corporations, companies that buy currency not for speculative profit, but for current activities or export-import operations. "Non-reportable positions" - small traders who do not have a significant impact on the price. Simplified wave analysis and forecast for EUR/USD, AUD/USD, and GBP/JPY on November 10 2020-11-10 EUR/USD Analysis: The main trend direction of the European currency since March is set by an upward wave. Its last section started on November 4. Since the end of last week, the price has been forming an intermediate correction. After its completion, the price growth will continue. Forecast: Most of the current day should be expected to be flat. A downward vector is expected at the European session, up to the support zone. A reversal and re-ascent to the resistance area are likely by the end of the day. Potential reversal zones Resistance: - 1.1860/1.1890 Support: - 1.1780/1.1750 Recommendations: With the euro's dominant bullish trend, sales are very risky. In the area of settlement support, we recommend tracking the instrument's purchase signals. 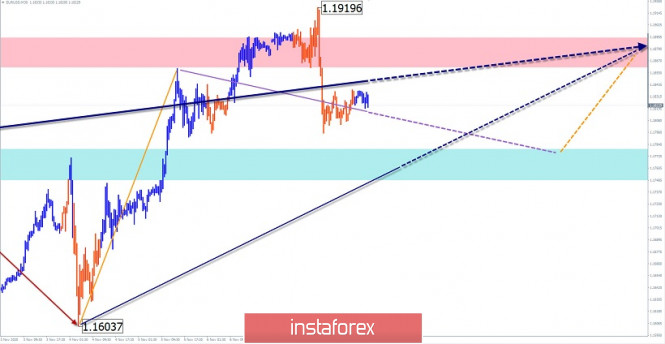
AUD/USD Analysis: The last upward wave of the Australian dollar from September 25 is moving in the direction of the dominant trend. Its structure shows a clear zigzag (A-B-C). The price has reached the lower limit of a strong potential reversal zone. Forecast: Price movements of the pair are expected today in the range between the opposite zones. In the first half of the day, a downward vector is likely. By the end of the day, you can expect activation and a repeated rise in the price to the resistance area. Potential reversal zones Resistance: - 0.7320/0.7350 Support: - 0.7250/0.7220 Recommendations: Trading today is only possible within the intra-session style, with a reduced lot. Purchasing is a priority. 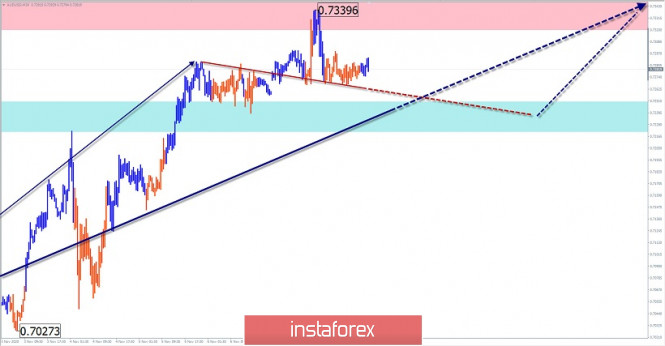
GBP/JPY Analysis: The dominant direction in the pound-yen pair's market since March is set by an upward trend. The latest wave on a short-term scale has been reporting since September 23. At the moment, it does not go beyond the correction part (B). The price has reached the upper limit of a wide large-scale resistance zone. Forecast: The most likely scenario of movement in the current day will be a corrective decline in the area of calculated support. Before the reversal, pressure may be applied to the resistance zone, with a puncture of its upper border. Potential reversal zones Resistance: - 138.80/139.10 Support: - 137.70/137.40 Recommendations: Today, trading is only possible within the intraday. Sales of the instrument are more promising. 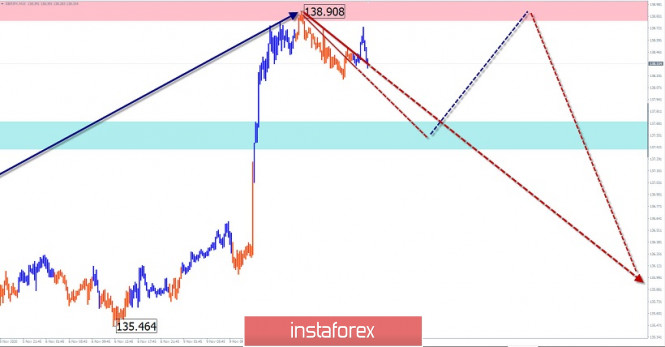
Explanation: In the simplified wave analysis (UVA), waves consist of 3 parts (A-B-C). The last incomplete wave is analyzed. The solid background of the arrows shows the formed structure, and the dotted background shows the expected movements. Note: The wave algorithm does not take into account the duration of the instrument's movements in time! Forex forecast 11/10/2020 on SP500, DowJones, NASDAQ and GOLD 2020-11-10 Let's take a look at the American indices today as the last days were very busy in the USA. Today's analysis include SP500, NASDAQ, Dow Jones and Gold. Trading plan for the EUR/USD pair on November 10. A slight decrease in COVID-19 incidence. Possible growth in the US dollar. 2020-11-10 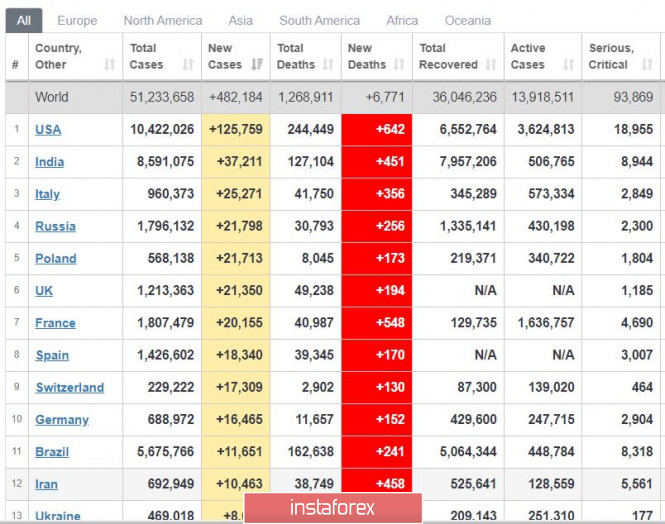
A slight decrease in (worldwide) COVID-19 incidence was recorded yesterday - from 620 thousand to 480 thousand a day. One of the major declines was seen in France, as new infections there dropped to 20 thousand a day. As for Europe, everything remains very tense. Another good news is that Pfizer announced yesterday that its Phase 3 coronavirus vaccine test was successful, that is, the vaccine showed a 90% chance of protection against infection. If the remaining tests turn out successful as well, it is likely that the authorities will give permission to the company to release the vaccine. 
The yen and the franc underwent a sharp reversal yesterday, which could indicate an upcoming growth in the US dollar. However, there is a chance that it is just a rebalancing in the market associated with the strong movements over the results of the US elections. 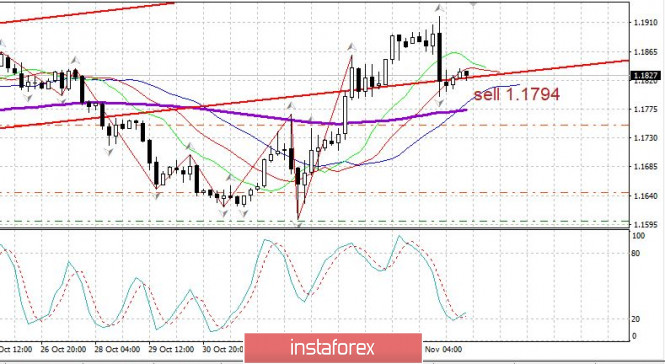
EUR/USD: Open long positions from 1.1750. Open short positions from 1.1794. Trading idea for gold 2020-11-10  Yesterday, news broke that Pfizer has developed a COVID-19 vaccine with "amazing levels of efficacy." Markets immediately reacted to this event by rising sharply in terms of quotes. For example, the US dollar grew very rapidly as investors immediately flocked back to the currency. As a result, gold collapsed by an incredible 10,000 pips! 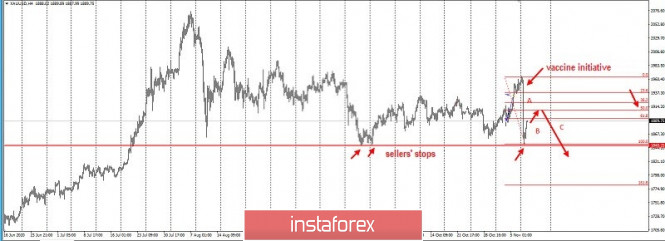 In fact, the quotes have formed an ABC pattern, in which wave "A" is the downward initiative from yesterday. Following this, the best action now is to open short positions, starting from the 61.8 and 50 Fibonacci retracement levels. The main target will be the level of 1848. The risk/profit ratio of such a transaction is 1:1. But of course, there is still the need to manage and control the risks in order to avoid losing profit. As we all know, trading in this market is very precarious and uncertain, but also very profitable provided that we use the right strategies. Price Action and Stop Hunting were used for the trading idea. To add to that, the plan is in relation to the strategy presented last November 3. Good luck!
Author's today's articles: Maxim Magdalinin  In 2005 graduated from the Academy of the Ministry of Internal Affairs of the Republic of Belarus, law faculty. Worked as a lawyer for three years in one of the biggest country's company. Besides the trading, he develops trading systems, writes articles and analytical reviews. Works at stock and commodity markets explorations. On Forex since 2006. In 2005 graduated from the Academy of the Ministry of Internal Affairs of the Republic of Belarus, law faculty. Worked as a lawyer for three years in one of the biggest country's company. Besides the trading, he develops trading systems, writes articles and analytical reviews. Works at stock and commodity markets explorations. On Forex since 2006. Torben Melsted  Born in November 1962. Graduated from CBS, got Diploma in Finance. Began trading on Forex in 1986 and since that time held various positions such as advising clients, hedging client flows on FX and commodity markets. Also worked for major corporations as Financial Risk Manager. Uses Elliott wave analysis in combination with classic technical analysis, and has been using a Calmar Ratio of 5.0 for over 3 years. Has his own blog, where he uses Elliott wave and technical analysis on all financial markets. Born in November 1962. Graduated from CBS, got Diploma in Finance. Began trading on Forex in 1986 and since that time held various positions such as advising clients, hedging client flows on FX and commodity markets. Also worked for major corporations as Financial Risk Manager. Uses Elliott wave analysis in combination with classic technical analysis, and has been using a Calmar Ratio of 5.0 for over 3 years. Has his own blog, where he uses Elliott wave and technical analysis on all financial markets. Stanislav Polyanskiy  Graduated from Odessa State Economic University. On Forex since 2006. Writes analytical reviews about international financial markets for more than 3 years. Worked as a currency analyst in different finance companies for a long time including the biggest companies of Russia and Ukraine. Graduated from Odessa State Economic University. On Forex since 2006. Writes analytical reviews about international financial markets for more than 3 years. Worked as a currency analyst in different finance companies for a long time including the biggest companies of Russia and Ukraine. Irina Manzenko  Irina Manzenko Irina Manzenko Sergey Belyaev  Born December 1, 1955. In 1993 graduated from Air Force Engineering Academy. In September 1999 started to study Forex markets. Since 2002 has been reading lectures on the technical analysis . Is fond of research work. Created a personal trading system based on the indicator analysis. Authored the book on technical analysis "Calculation of the next candlestick". At present the next book is being prepared for publishing "Indicator Analysis of Forex Market. Trading System Encyclopedia". Has created eleven courses on indicator analysis. Uses classical indicators. Works as a public lecturer. Held numerous seminars and workshops presented at international exhibitions of financial markets industry. Is known as one of the best specialists in the Russian Federation researching indicator analysis. Born December 1, 1955. In 1993 graduated from Air Force Engineering Academy. In September 1999 started to study Forex markets. Since 2002 has been reading lectures on the technical analysis . Is fond of research work. Created a personal trading system based on the indicator analysis. Authored the book on technical analysis "Calculation of the next candlestick". At present the next book is being prepared for publishing "Indicator Analysis of Forex Market. Trading System Encyclopedia". Has created eleven courses on indicator analysis. Uses classical indicators. Works as a public lecturer. Held numerous seminars and workshops presented at international exhibitions of financial markets industry. Is known as one of the best specialists in the Russian Federation researching indicator analysis. Sebastian Seliga  Sebastian Seliga was born on 13th Oсtober 1978 in Poland. He graduated in 2005 with MA in Social Psychology. He has worked for leading financial companies in Poland where he actively traded on NYSE, AMEX and NASDAQ exchanges. Sebastian started Forex trading in 2009 and mastered Elliott Wave Principle approach to the markets by developing and implementing his own trading strategies of Forex analysis. Since 2012, he has been writing analitical reviews based on EWP for blogs and for Forex websites and forums. He has developed several on-line projects devoted to Forex trading and investments. He is interested in slow cooking, stand-up comedy, guitar playing, reading and swimming. "Every battle is won before it is ever fought", Sun Tzu Sebastian Seliga was born on 13th Oсtober 1978 in Poland. He graduated in 2005 with MA in Social Psychology. He has worked for leading financial companies in Poland where he actively traded on NYSE, AMEX and NASDAQ exchanges. Sebastian started Forex trading in 2009 and mastered Elliott Wave Principle approach to the markets by developing and implementing his own trading strategies of Forex analysis. Since 2012, he has been writing analitical reviews based on EWP for blogs and for Forex websites and forums. He has developed several on-line projects devoted to Forex trading and investments. He is interested in slow cooking, stand-up comedy, guitar playing, reading and swimming. "Every battle is won before it is ever fought", Sun Tzu Alexandr Davidov  No data No data Grigory Sokolov  Born 1 January, 1986. In 2008 graduated from Kiev Institute of Business and Technology with "Finance and Credit" as a major. Since 2008 has studied the behavior of various currency pairs and their correlation on Forex. In his works and trading practice he uses candlestick analysis and Fibonacci technique. Since 2009 has written analytical reviews and articles which are published on popular Internet resources. Interests: music, computers and cookery. "Out of five deadly sins of business and as a rule, the most widespread, excessive striving to get profit is the worst". P. Drucker Born 1 January, 1986. In 2008 graduated from Kiev Institute of Business and Technology with "Finance and Credit" as a major. Since 2008 has studied the behavior of various currency pairs and their correlation on Forex. In his works and trading practice he uses candlestick analysis and Fibonacci technique. Since 2009 has written analytical reviews and articles which are published on popular Internet resources. Interests: music, computers and cookery. "Out of five deadly sins of business and as a rule, the most widespread, excessive striving to get profit is the worst". P. Drucker Pavel Vlasov  No data No data Vyacheslav Ognev  Vyacheslav was born on August 24, 1971. In 1993, he graduated from Urals State University of Economics in the Russian city of Ekaterinburg holding a degree in Commerce and Economics of Trade. In 2007, he started concentrating on the Russian stock market, trading stocks on the RTS Stock Exchange and futures contracts on FORTS. Since 2008 he has been engaged in analyzing Forex market and trading currencies. He is an author of a simplified wave analysis method. He has also developed a trading strategy. At present, Vyacheslav is a co-author of training materials on two web portals dedicated to Forex trading education. Interests: fitness, F1 "Experience is the best of schoolmasters, only the school fees are heavy." - Thomas Carlyle Vyacheslav was born on August 24, 1971. In 1993, he graduated from Urals State University of Economics in the Russian city of Ekaterinburg holding a degree in Commerce and Economics of Trade. In 2007, he started concentrating on the Russian stock market, trading stocks on the RTS Stock Exchange and futures contracts on FORTS. Since 2008 he has been engaged in analyzing Forex market and trading currencies. He is an author of a simplified wave analysis method. He has also developed a trading strategy. At present, Vyacheslav is a co-author of training materials on two web portals dedicated to Forex trading education. Interests: fitness, F1 "Experience is the best of schoolmasters, only the school fees are heavy." - Thomas Carlyle Mihail Makarov  - - Andrey Shevchenko  Andrey Shevchenko Andrey Shevchenko
Subscription's options management Theme's:
Fundamental analysis, Fractal analysis, Wave analysis, Technical analysis, Stock Markets
Author's :
A Zotova, Aleksey Almazov, Alexander Dneprovskiy, Alexandr Davidov, Alexandros Yfantis, Andrey Shevchenko, Arief Makmur, Dean Leo, Evgeny Klimov, Fedor Pavlov, Grigory Sokolov, I Belozerov, Igor Kovalyov, Irina Manzenko, Ivan Aleksandrov, l Kolesnikova, Maxim Magdalinin, Mihail Makarov, Mohamed Samy, Mourad El Keddani, Oleg Khmelevskiy, Oscar Ton, Pavel Vlasov, Petar Jacimovic, R Agafonov, S Doronina, Sebastian Seliga, Sergey Belyaev, Sergey Mityukov, Stanislav Polyanskiy, T Strelkova, Torben Melsted, V Isakov, Viktor Vasilevsky, Vladislav Tukhmenev, Vyacheslav Ognev, Yuriy Zaycev, Zhizhko Nadezhda
Edit data of subscription settings
Unsubscribe from the mailing list Sincerely,
Analysts Service | If you have any questions, you can make a phone call using one of the
InstaForex Toll free numbers right now:
|  | InstaForex Group is an international brand providing online trading services to the clients all over the world. InstaForex Group members include regulated companies in Europe, Russia and British Virgin Islands. This letter may contain personal information for access to your InstaForex trading account, so for the purpose of safety it is recommended to delete this data from the history. If you have received this letter by mistake, please contact InstaForex Customer Relations Department. |


No comments:
Post a Comment