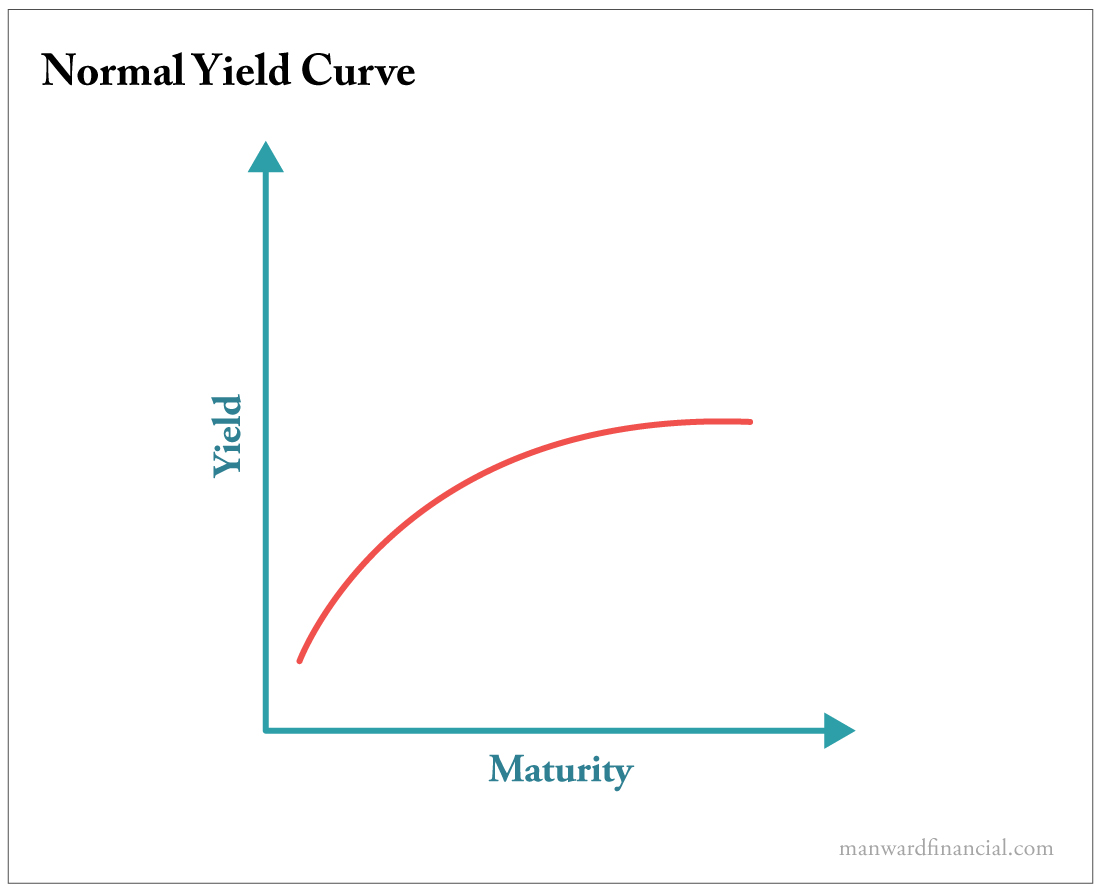
 | | Anthony Summers | A lot of folks view the stock market as an economic indicator. They figure if stocks are doing well, the economy must also be thriving. And if stocks are doing poorly? Well then, batten down the hatches... because the economy is in trouble. I get the logic. But the truth is, these days, a healthy economy has little to do with soaring stocks... and vice versa. [The "Next Major American Index": Forget the Outdated Dow, S&P and Nasdaq... See This New Index Now ] ] According to this flawed perspective, the remarkable rally in stocks since October is proof that the economy is on a clear path to success. That would be nice. But as we've shown you again and again, it's simply not true. While the mainstream has been quick to write off a recession in 2023... we're not quite as optimistic. For a whole host of reasons. So if you want better insight into the real state of the economy, look no further than the nation's bond market... specifically, bond yields. As a general rule, long-term bonds offer higher interest rates than short-term bonds. The reason is simple... The longer it takes for a bond to mature and for the investor to recoup their principal, the greater the chances of the investor missing out on better returns in other areas of the market. Long-term bonds need to be attractive enough to pull investors from higher-returning assets like stocks. That's why they offer higher yields. And when you plot bond yields and maturities on a graph, you should see an upward-curving line known as the yield curve. This simple line graph holds the power to shape the world's view of the economy. Why? Because when it veers from that upward-sloping curve... something has gone wrong. A Wake-Up Call? When the difference (or spread) between long-term and short-term bond yields turns negative, it is referred to as a yield curve inversion. It's an event that turns a lot of heads, because it's proven to be a strong economic indicator. Take a look at the chart below, which shows the spread between 10-year and 2-year Treasury yields. You can see how accurately the yield curve inversions - the spots where the line dips below zero - have predicted previous recessions (shaded in gray). 
View larger image In the past, our economy has typically entered a contraction phase within 18 months of the yield curve inverting. And the latest inversion began about a year ago. Uh oh. Also take a look at just how large the spread is right now. It hasn't been this wide since the 1980s. Investors are worried... and here's how we know. Short-term interest rates have spiked thanks to the Fed's fight with inflation. Yet long-term bonds remain in high demand. Remember that bond prices and bond yields move inversely to each other. High demand for long-term bonds pushes their prices higher... effectively lowering their yields. And this happens only if... well... investors are searching for a safe refuge. In short, money talks. The yield curve says something is wrong in the economy. There is much more to the story than headline economic figures suggest. Investors need to pay attention... and be prepared. I have plenty more to say about what I really think is going on in this market... so stay tuned. Trade wisely, Anthony Want more content like this? | | | | | Anthony Summers Anthony Summers is the Director of Strategic Trading for Manward Press and is a contributor to Manward Financial Digest, Manward Trading Tactics and Manward Letter. He is a former senior analyst for The Oxford Club, where he closely worked with some of our nation's sharpest financial minds for nearly a decade. Anthony is a self-styled "conservatively aggressive trader" and has earned a reputation for developing unique trading strategies that focus on low-risk, high-return opportunities in both stock and options markets. | | | | 


No comments:
Post a Comment