 | | Bryan Bottarelli
Head Trade Tactician
Monument Traders Alliance | If you want to make fast profits... consistently... day after day... year after year... no matter which direction stocks are moving... There's only ONE chart pattern you need to know. It generates tens of millions in profit opportunities... And the gains can come in 15 minutes. Sometimes even quicker. [Alexander Green Is Going ALL-IN! Discover Where He's Investing $100K+ Right Now.] This pattern gets formed hundreds of times every single trading day. And I'm willing to bet you've never used it. But today... I'm going to reveal to you what it is... how to find it... and how you can start profiting off it - starting immediately. Best of all... it's the simplest chart pattern you'll ever see. All those complex chart patterns... like RSI, MACD, Fibonacci retracements... Sure, they work sometimes. But they're so complicated that it's impossible to keep them straight. What I'm about to show you is much easier to understand. You don't need 10 flashing screens. You don't need hundreds of indicators. This single chart pattern is much simpler to identify. And much, much more profitable. For instance, it just led me to a 54% gain on Roku (ROKU) in 4 minutes and a 121% gain on Walmart (WMT) in just over an hour... That's right... Walmart, the bluest of blue chip stocks. This simple chart pattern could have doubled your money - within one hour of being formed. Yep, this chart pattern works on everything. Tech stocks. Blue chip stocks. Even gold, biotechs and everything in between. Name a stock... any stock... and you can use this simple chart pattern to get the chance to make instant profits. It's called the "W" pattern. And it looks like this... 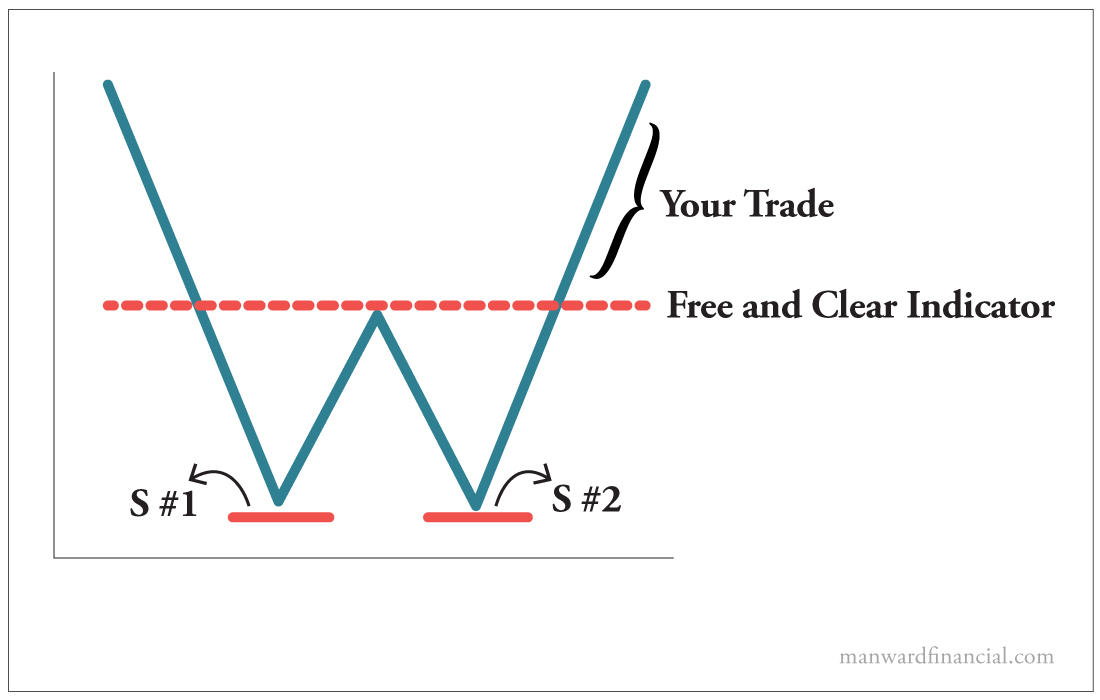
View larger image Here's how it works... You have the bears, who push the stock down to the first support level (S #1). At this point, the bulls support it, and the stock bounces higher. The bears push it down again... and the bulls support the stock again at the same level (S #2). When the bulls trigger this second bounce, that's when the "W" is formed. Now, this doesn't tell you anything unless the bulls are able to push the stock past what I call the "free and clear indicator." Once the bulls do that, then you know they are in control. And that's when you make your trade. Let's look at a real-life example... 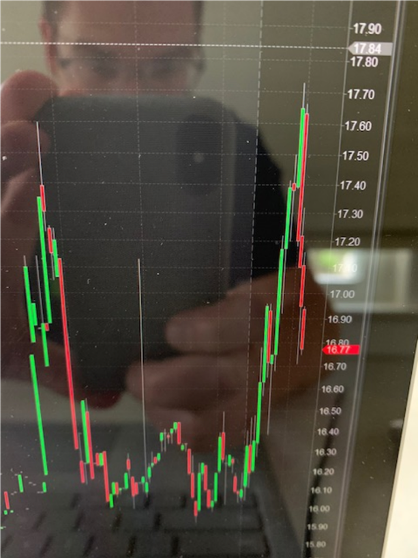 I found a "W" formation on a company called Workhorse Group (WKHS). It was such a perfect "W," I took a screenshot to share with you. (You can even see my reflection in the background.) The stock was trading at $17.60 at the top left corner of the "W." The bears pushed it down to the $16 level, but the bulls supported it, and the stock bounced up to $16.40. The bears came back and again pushed it down... but the stock got support from the bulls at the same $16 level and then bounced back up. There are your two confirmed support points. As soon as the stock crossed the $16.40 level (the middle of the "W"), that meant you'd hit the "free and clear indicator" to make your trade. The "W" was confirmed, and the bulls were in charge. And you can see once the stock got past $16.50, it kept going - all the way up to $17.70. The result? A 33% gain in 15 minutes. Mastering this one, single chart pattern can help you make a fortune in trading profits - day after day. Yes, it's really that simple. Yours in smart speculation, Bryan Action Plan: If you want to see how you can take this chart pattern to the next level, our friends at Monument Traders Alliance have something special to share with you this week. They are going to debut their new software live on Wednesday, December 7, at 2 p.m. ET. They're calling this trading tool "the defining achievement of their careers"... and it could give you an unfair advantage in your trades. Click here to sign up for FREE. Want more content like this? | | | | | Bryan Bottarelli | Head Trade Tactician Bryan Bottarelli started his career trading stock options on the floor of the Chicago Board Options Exchange (CBOE). As a so-called "play tactician," Bryan uses his hands-on knowledge of floor trading to shape opportunities and chart formations into elegant, powerful and profitable recommendations. Along the way, Bryan has developed a cumulative track record that could impress even the most successful hedge fund manager. He now spends his days moderating one of the most elite trading research forums ever created, The War Room. | | | | 


No comments:
Post a Comment