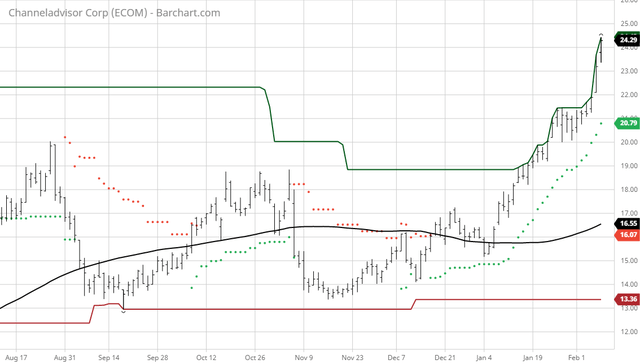
The Barchart Chart of the Day belongs to the software applications company ChannelAdvisor (NYSE:ECOM). I found the stock by using Barchart's powerful screening tools to find the stocks with the highest Weighted Alpha and technical buy signals. After I sorted for the most frequent number of new highs in the last month, I used the Flipchart feature to review the charts for consistent prices appreciation. Since the Trend Spotter signaled a buy on 12/17 the stock gained 46.73% . ChannelAdvisor Corporation provides software-as-a-service (SAAS) solutions in the United States and internationally. The company's SaaS, a cloud platform that helps brands and retailers to improve their online performance by expanding sales channels, connecting with consumers around the world, optimizing their operations for peak performance, and providing actionable analytics to improve competitiveness. Its suite of solutions include various modules, including Marketplaces module that connects customers to third-party marketplaces; and Digital Marketing module, which connects customers to compare shopping Websites that allow customers to advertise products on search engines. The company also offers Where to Buy solution that allows brands to provide their Web visitors or digital marketing audiences with information about the authorized resellers that carry their products and the availability of those products; and Product Intelligence, a solution that provides brands with insights about online assortment, product coverage gaps, pricing trends, and adherence by their retailers to content guidelines. Its customers include online businesses of brands and retailers, as well as advertising agencies that use its solutions on behalf of their clients. The company was founded in 2001 and is headquartered in Morrisville, North Carolina. 
Barchart's Opinion Trading systems are listed below. Please note that the Barchart Opinion indicators are updated live during the session every 10 minutes and can therefore change during the day as the market fluctuates. The indicator numbers shown below therefore may not match what you see live on the Barchart.com website when you read this report. Barchart technical indicators: - 100% technical buy signals
- 151.82+ Weighted Alpha
- 154.77% gain in the last year
- Trend Spotter buy signal
- Above its 20, 50 and 100 day moving averages
- 15 new highs and up 40.51% in the last month
- Relative Strength Index 84.49%
- Technical support level at 22.30
- Recently traded at 24.30 with a 50 day moving average of 17.57
Fundamental factors: - Market Cap $673 million
- P/E 34.20
- Revenue expected to grow 9.80% this year and another 5.00% next year
- Earnings estimated to increase 126.80% this year and continue to compound at an annual rate of 8.00% for the next 5 years
- Wall Street analysts issued 2 strong buy, 1 buy and 5 hold recommendations on the stock
- The individual investors following he stock on Motley Fool voted 17 to 2 that the stock will beat the market
- 3,890 investors are monitoring the stock on Seeking Alpha
The Barchart Chart of the Day highlights stocks that are experiencing exceptional current price appreciation. They are not intended to be buy recommendations as these stock are extremely volatile and speculative. Should you decide to add one of these stocks to your investment portfolio it is highly suggested you follow a predetermined diversification and moving stop loss discipline that is consistent with your personal investment risk tolerance and reevaluate your stop losses at least on a weekly basis. | 


No comments:
Post a Comment