| Trading recommendations for starters on GBP/USD and EUR/USD for December 22, 2020 2020-12-22 
GBP/USD: Previous day's review The pound managed to show activity of more than 300 points yesterday, which is considered a rare phenomenon in the market. Such high activity was due to the information flow, as significant statistics were not published in the UK, just like in the United States. In particular, speculators were initially worried about the disagreements between the parties regarding the Brexit trade negotiations, where there were no results over the weekend. The pound reacted with a sharp decline by more than 300 points. During the US trading session, alternative information appeared, which said that the UK was ready to make concessions on the key issue of the trade deal. This was a positive signal for the British currency, and as a result of which, it was possible to observe the process of rate recovery. What happened on the trading chart? The pound sterling started the trading week with a price gap, just due to the negative news on Brexit's trade negotiations. This was followed by an inertial decline towards the level of 1.3188, where there was a stop. But due to the positive information flow on Brexit, the quote rose to the level of 1.3495, which ended the trading day. 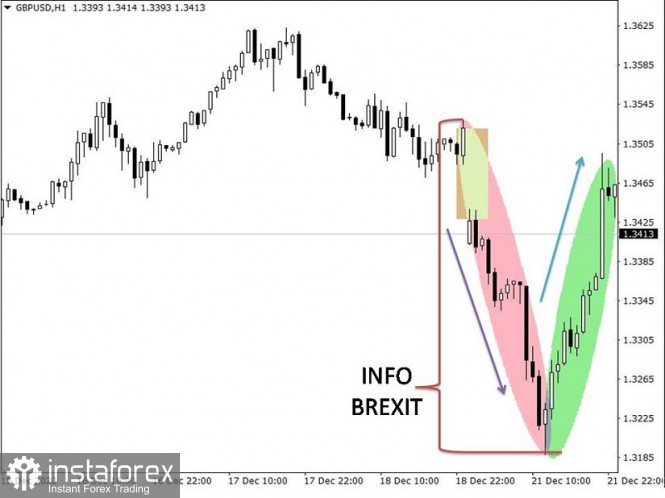
EUR/USD: Previous day's review The Euro showed similar dynamics yesterday. As a result, the quote initially sharply declined, and then recovered to its previous levels. The speculative hype around the trade negotiations between England and Brussels (Brexit) was the main driver for the high volatility. Significant statistics were not published in Europe and the United States. What happened on the trading chart? The trading week began with a downward price gap of 30 points, where an inertial outgoing move was set in the direction of 1.2130. The coordinate 1.2130 coincides with the deceleration area of December 16, thus traders considered the point of possible pivot. The reversal move of the quote returned the euro to Friday levels, which can be seen in the chart below. 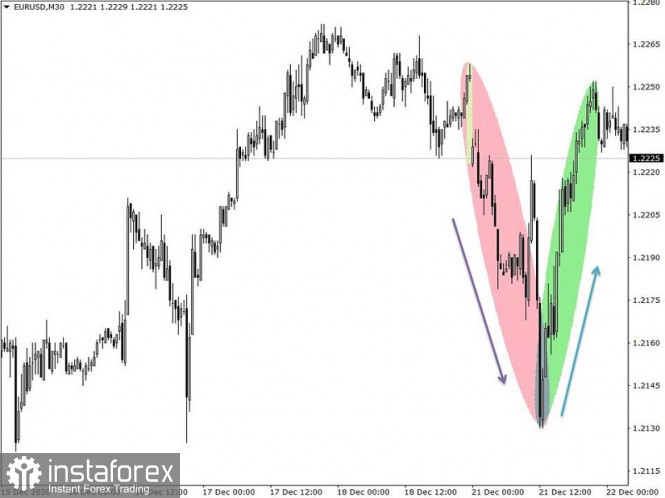
Trading recommendation for GBP/USD on December 22 The final data on the UK GDP for the third quarter was published today, where the pace of economic decline slowed down from -21.5% to -8.6%, against the forecasted slowdown to -9.6%, which is quite good. The market did not react to the UK data. In the afternoon, the final indicator of US GDP for the third quarter will be published, where the pace of economic decline is expected to slow down from -9.0% to -2.9%. The result of the expectation coincides with the preliminary estimate, which means that if the forecast also coincides, then there will be no market reaction. The main impulse for speculative activity is still the information flow associated with the Brexit trade negotiations. - Positive news around Brexit leads to the pound's strengthening.
- Negative news around Brexit leads to the pound's weakening.
The main tactic is following the information flow about the negotiation process, which has proven itself from the best side for a long time. 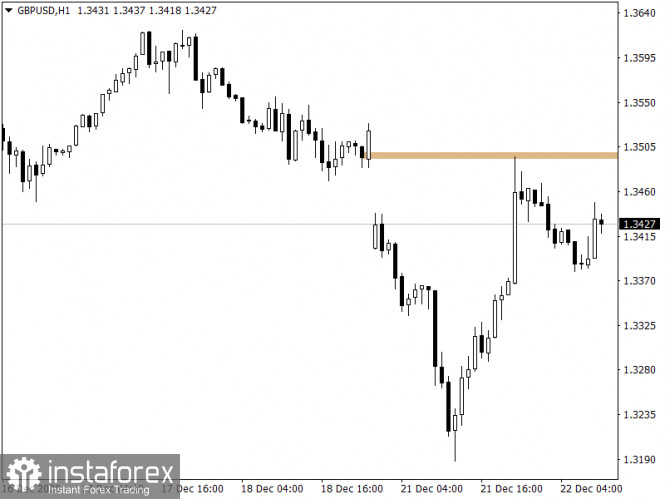
Trading recommendation for EUR/USD on December 22 US data is the only one to be published today for the economic calendar, which may not affect the dynamics of quotes. USA 13:30 Universal time - GDP Q3 In terms of the technical analysis, it is noteworthy that there was another convergence with the local high (1.2272) of the medium-term upward trend, considering that the price returned to Friday levels. It can be assumed that the quote will temporarily be tied to an amplitude of 1.2180/1.2275, where the best trading tactic will be the method of breaking through one or another amplitude border. - Buying a currency pair at a price above the level of 1.2280, with the prospect of moving to 1.2250 is recommended. - Selling a currency pair at a price below the level of 1.2175, with the prospect of moving to 1.2130 is recommended. 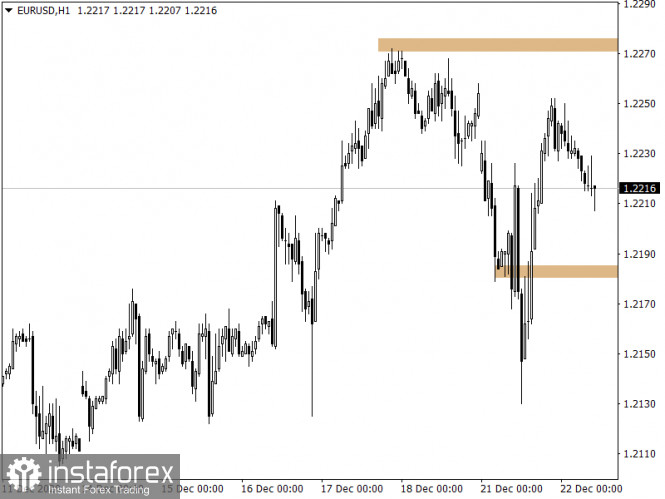
Technical analysis of AUD/USD for December 22, 2020 2020-12-22 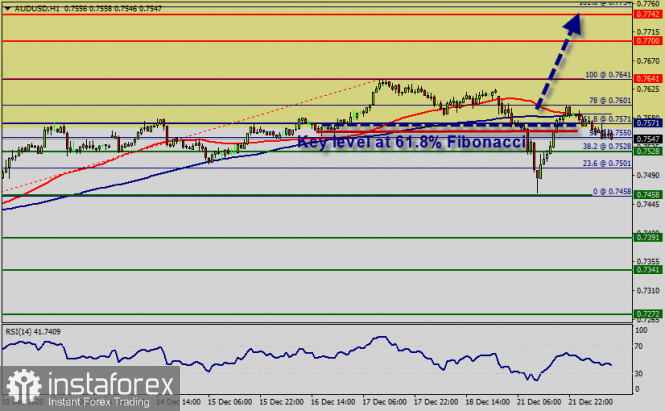 Forex Analysis - Reviews - The AUD/USD pair broke resistance which turned to strong support at the level of 0.7571 yesterday. The level of 0.7571 is expected to act as major support today. Be careful! right now the price try to break the price of 0.7571 (0.7543 currently price). The AUD/USD pair is showing signs of strength following a breakout of the highest level of 0.7641. We expect the AUD/USD pair to continue moving in a bullish trend from the support levels of 0.7571 and 0.7601. Currently, the price is moving in a bullish channel. This is confirmed by the RSI indicator signaling that we are still in the bullish trending market. Consequently, the first support is set at the level of 0.7571 (horizontal blue line). Therefore, strong support will be found at the level of 0.7571 providing a clear signal to buy with a target seen at 0.7700. If the trend breaks the minor resistance at 0.7700, the pair will move upwards continuing the bullish trend development to the level 0.7742 in order to test the daily resistance 2. On the H1 chart. the level of 0.7571 coincides with 61.8% of Fibonacci, which is expected to act as minor support today. Since the trend is above the 61.8% of Fibonacci level, the market is still in an uptrend. But, major support is seen at the level of 0.7525. Furthermore, the trend is still showing strength above the moving average (100). Thus, the market is indicating a bullish opportunity above the above-mentioned support levels, for that the bullish outlook remains the same as long as the 100 EMA is headed to the upside. On the other hand, if the AUD/USD pair fails to break through the resistance level of 0.7700 this week, the market will decline further to 0.7571 with a view to test the weekly pivot point. The pair is expected to drop lower towards at least 0.7525 . Also, it should be noted that the weekly pivot point will act as good support.
Trading idea for the EUR/USD and GBP/USD pairs 2020-12-22  Recently, almost all world currencies are rising against the dollar. And if we refer to the Price Action and Stop Hunting strategies, the possible transactions that we could take on them are very similar. Yesterday, the euro traded at 1.21240, so as a result, a "double bottom" has formed, which is a great target for future short positions in EUR / USD, and could lead to two scenarios: 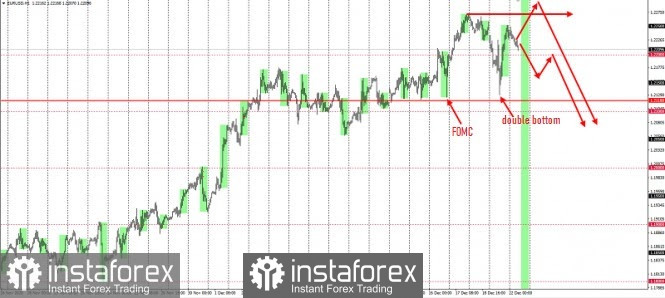 The GBP / USD pair has a similar picture, but the only difference is that its key level is 1.32. Such is clearly indicated by the wave patterns (ABC) formed in the chart, which shows that a decline could happen according to the scenario below: 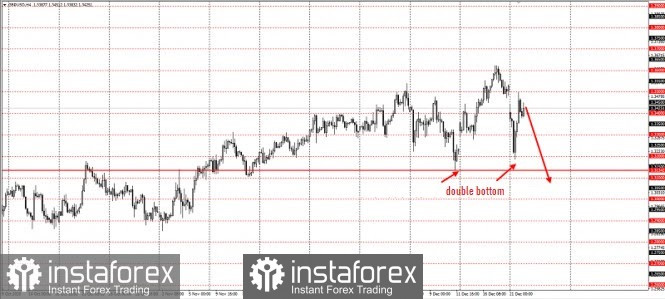 As you can see, both currency pairs are now very similar, so it is best to trade in only one of them or divide the risks between them. This is because in both EUR/USD and GBP/USD, the same idea of strengthening the dollar is being worked on. Good luck! Trading plan for the EUR/USD pair on December 22. Progress in the COVID-19 situation. The euro keeps on growing in the market. 2020-12-22 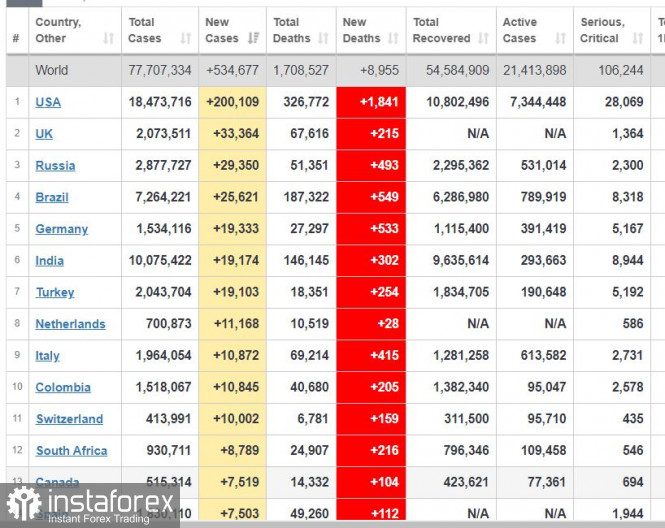
There seems to be progress on the COVID-19 situation, as global incidence remained below 550 thousand yesterday. However, the situation in the UK is deteriorating due to the new strain of the virus. Neighboring countries are closing transport links, while Germany has imposed a hard lockdown. Nonetheless, vaccinations are actively underway in both the US and the UK. In the EU, vaccinations will begin immediately after Christmas, in particular, from December 27. The vaccine developed by Moderna has also been approved, and many are awaiting AstraZeneca's vaccine. But most likely, it will come out in January next year. 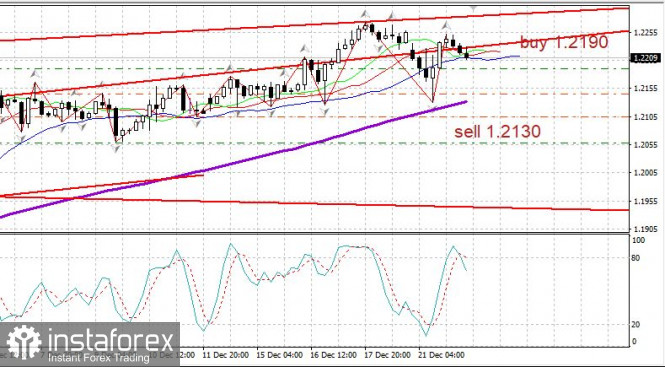
EUR / USD: the euro remains trading upward, albeit at a slow pace. Open long positions from 1.2190 to 1.2145. Open short positions from 1.2130. Analysis and forecast for GBP/USD on December 22, 2020 2020-12-22 United Kingdom In Isolation As it has already become known, after the COVID-19 mutation and the discovery of a new strain of the infection in the United Kingdom, continental Europe interrupted all transport links with the UK, effectively isolating the British Isles. It is very characteristic that a new strain of coronavirus infection, called VUI, was discovered just before the UK left the European Union. In my opinion, this is quite a significant coincidence. Perhaps this is the last time Brussels tried to reason with London about the future and very disappointing prospects of the United Kingdom and push the British authorities to sign a trade agreement. However, knowing the proud and stubborn nature of the British, there is very little chance that they will make any concessions, which means that the UK will leave the European Union without a trade agreement. In this case, further trade relations between the parting parties will be regulated according to the rules of the World Trade Organization (WTO), with all the ensuing consequences regarding duties, tariffs, and other conditions. If you go back to the fact that more than forty European countries have fenced off from the UK, interrupting all transport links with it, then you can not call it anything but isolation. Another characteristic point that confirms this opinion is that a new strain of COVID-19 has also been detected in some European countries, in particular in the Netherlands, Belgium, Denmark, and Italy. However, no one is going to isolate these states and interrupt transport links with them, although the strain is the same. By and large, the British began to feel all the "delights" of a hard Brexit now, before the Christmas holidays. And what about British Prime Minister Boris Johnson, who was an ardent supporter of the UK's exit from the EU without any deal? He seems to be seriously worried, but he's trying to put on a good face when he's playing badly. Johnson warns the British about the imminent and very significant increase in prices and suggests that they stock up on everything they need right now. As for the Christmas holidays, they are hopelessly spoiled by the introduction of new strict restrictions. And the fact that by the end of the outgoing year the authorities promise to start mass vaccination is little consolation, from the moment of vaccination, at least 1.5-2 months must pass for about 70-75% of citizens to be vaccinated. Only in this case can we expect that the COVID-19 outbreak will come to an end and the situation will stabilize. Daily 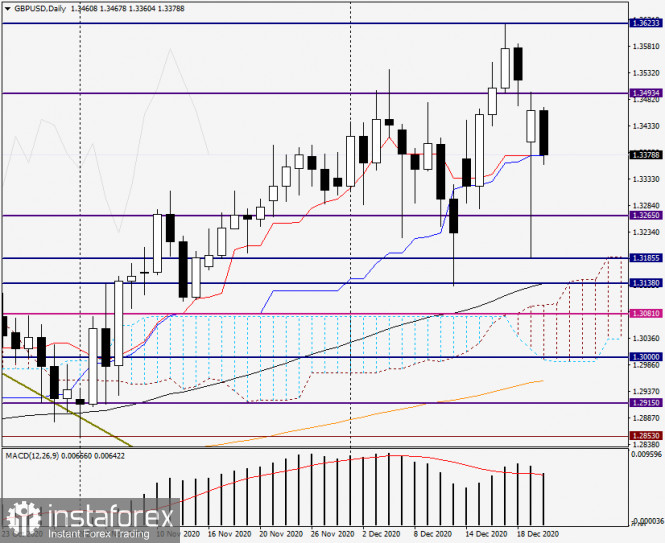
Despite the fact that Monday's trading opened for the GBP/USD currency pair with a significant bearish gap, after which the fall of the British currency continued, the bulls on the pound found the strength and opportunities to change the situation, and in the root. As a result, a white candle with a huge lower shadow and a closing price of 1.3461 appeared on the daily chart. It is difficult to guess what this optimism is based on. Perhaps market participants are hoping that a Brexit deal will be reached at the very last moment. On the technical side, yesterday's lows at 1.3185 represent a very strong support, a possible breakdown of which will finally bring down the British currency. Today's trading on the pound/dollar pair, at the time of writing, is taking place in a negative way. The pair shows a moderate decline, but after reaching the Tenkan and Kijun lines of the Ichimoku indicator, it began to bounce up and is ready to repeat yesterday's scenario. UK GDP data for the third quarter has already been published, which exceeded forecasts both year-on-year and month-on-month. The next step is similar statistics from the United States, which will be published at 13:30 UTC. Perhaps the US GDP reports for the third quarter will finally put all the dots in today's trading on GBP/USD. On the trading recommendations, the current situation seems quite difficult. You can see for yourself what is happening, and this is far from the limit. I believe that the volatility in trading the British currency will only increase. The appearance of bearish candlestick patterns in the price zone of 1.3490-1.3530 on lower time frames will indicate a high probability of a decline, and the opening of short positions on the pound/dollar pair. If the pair gains a foothold above the psychological level of 1.3500, and even more so breaks the mark of 1.3528, it is worth looking for an opportunity to buy the British pound sterling. Successful bidding! Analysis and forecast for AUD/USD on December 22, 2020 2020-12-22 Before moving on to the technical picture of the AUD/USD currency pair, it is necessary to pay attention to the publication of reports on retail sales in Australia, which were published tonight. It was forecasted that retail sales would show a negative trend of minus 0.6%, however, the actual figure significantly exceeded expectations and showed an increase of 7%. Naturally, such a significant divergence from the forecast value in the direction of improvement should have served the Australian dollar well and sent the quote up, but this, oddly enough, did not happen. Moreover, at the time of writing, the AUD/USD currency pair is trading with a fairly pronounced decline. In my opinion, the threat of the new COVID-19 strain revealed has overshadowed the excellent Australian retail sales data and discouraged investors from taking risks. Let's start analyzing the price charts and first turn our attention to the weekly timeframe: Weekly 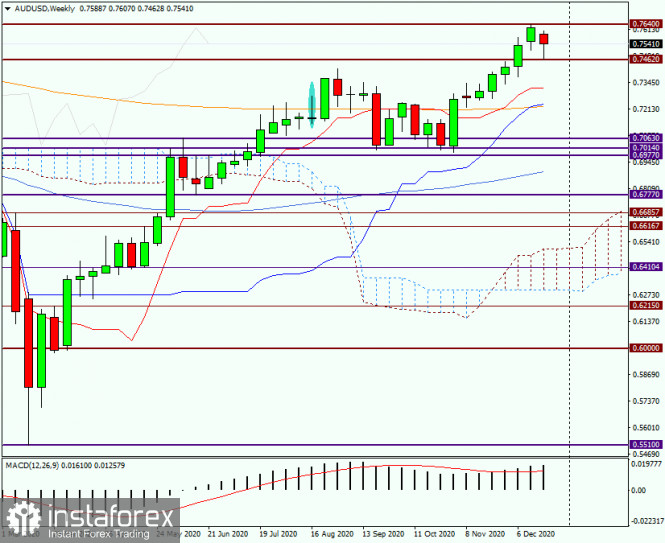
Last trading week, the AUD/USD currency pair ended with growth, and this week became the fifth in a row that the "Aussie" is strengthening. It would seem that nothing should have foreshadowed a change in sentiment, and the pair could (and can) continue to grow. However, information about the new strain of COVID-19, which is 70% more dangerous and contagious than the previous one, did its job and trading for the pair opened with a price gap down. But as can be clearly seen on the chart, after falling to the area of 0.7460, the pair has found strong support and is turning up. At the moment, the weekly candlestick already has a fairly long lower shadow, which signals that the bottom has been reached and a reversal in the north direction. On the other hand, the week has just started and all the main events are still ahead. So far, we can only assume that the breakdown of strong resistance of sellers at 0.7640 and the closing of weekly trading above this mark will confirm the further bullish scenario for this currency pair. If this fails to succeed, the future prospects for the price movement of the "Aussie" will look very vague, and here's why. Daily 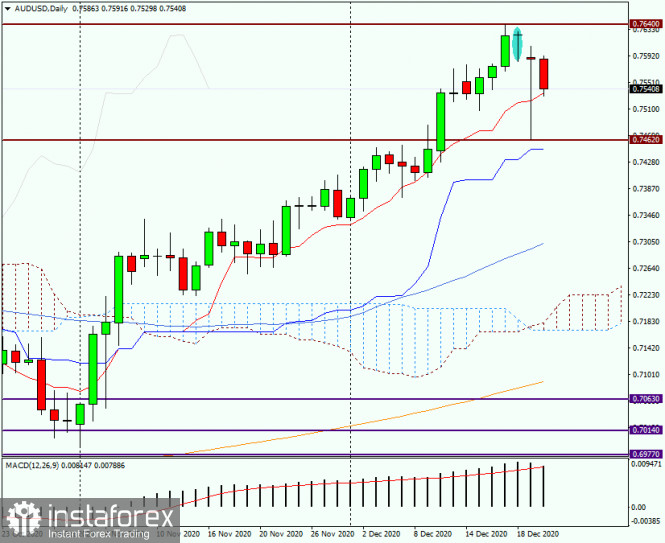
On the daily chart of AUD/USD, Japanese candlestick reversal signals began to appear. This applies to the Friday candlestick made in the form of "The Hanged Man" or "The Hanging Man." This model is quite strong and is often worked out by bidders. This assumption was confirmed yesterday, and the pair fell to 0.7462. However, there were large buyers of the Australian currency and almost all the decline was leveled. Today, at the moment of writing, the pair is kept from further decline by the red Tenkan line of the Ichimoku indicator. If the bulls on the instrument fail to keep the quote above the Tenkan and trading ends under this line, the near-term bearish prospects will become stronger. If today's candle has a long lower shadow, and trading closes significantly above the Tenkan, it will count on the subsequent growth of the quote and consider options for opening long positions. At the end of this article, AUD/USD is trading near 0.7545. If the bulls on the "Aussie" can raise the quote above 0.7600 and gain a foothold above this mark, you can try to buy based on the breakout of the resistance of 0.7640. It is less risky to wait for the breakdown of this mark and consider opening long positions on the Australian dollar on a pullback to it. Successful bidding! Technical recommendations for EUR/USD and GBP/USD on 12/22/20 2020-12-22 EUR/USD 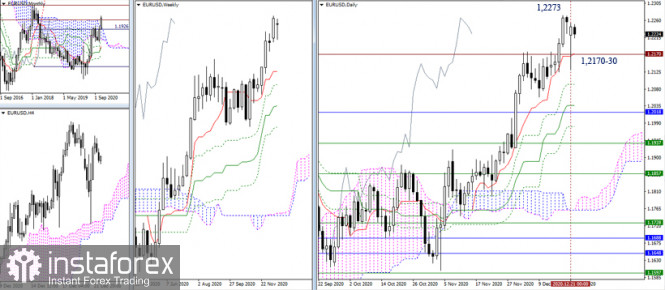 Yesterday's movement confirmed the hard struggle and the presence of someone's advantage in dominance of the current upward trend. Despite the impressive decline, the bulls managed to return and close the downward gap of the week's opening. So, the movement is underway again on the support of 1.2170 (historical level + daily Tenkan). Now, updating last week's high (1.2273) and consolidating above which will restore the upward trend. The task is not easy, but quite possible. Another option is also likely in the current conditions. The pair may take a wait-and see-attitude soon and consolidate, which will lead to the formation of some variation of the weekly trend. If the bears still manage to break through the long lower shadow of yesterday's daily candle and consolidate below the support level of 1.2170 and the low 1.2130, then it will be possible to return to the option of continuing bearish mood. 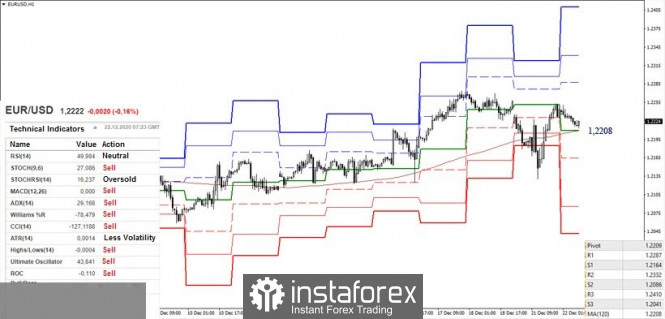 There is currently no clear predominance of forces on one-hour chart. However, the pair is above the key levels of the smaller time frames, which are now joining forces in the area of 1.2208 (central pivot level + weekly long-term trend) and acting as supports, so the bulls still have some predominance. The upward targets are 1.2273 (high) and 1.2287 - 1.2332 - 1.2410 (resistances of classic pivot levels). The loss of key level (1.2208) and consolidation below will swing the favor towards the bears. The possible downward targets are 1.2164 (S1) - 1.2130 (low) - 1.2086 (S2) - 1.2041 (S3). GBP/USD 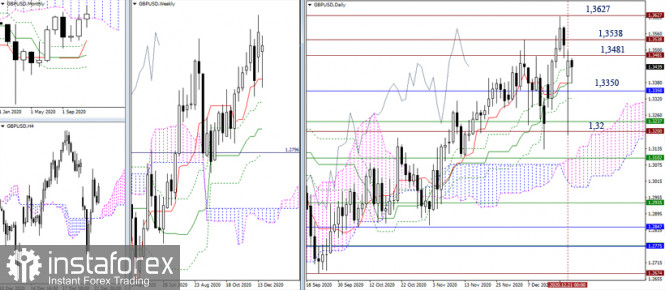 The historic level of 1.32, which has long served as resistance, is now helping bulls and acting as support. The pair returned to the monthly Ichimoku cloud (1.3350). As a result, the previously noted resistances 1.3481 - 1.3538 - 1.3627 are separated from the recovery of the upward trend, which led to the emergence of new bullish prospects. As for the bears, everything still rests on the support levels of 1.3350 and 1.32. Now, there is a high possibility that the situation will be delayed, resulting in some wait-and-see position. 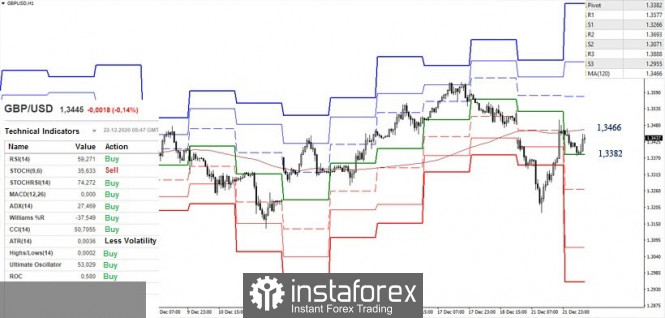 The pair in the smaller time frame is between the key levels of 1.3382 (central pivot level) and 1.3466 (weekly long-term trend). In case of formation of uncertainty and persistence of instability, it is possible to move to the attraction zone. To reliably change the situation, it is necessary to go beyond the limits of the last movement – the high (1.3624) and the low (1.3187). Today, the resistances of the classic pivot levels are located at 1.3577 - 1.3693 - 1.3888, while the support levels are at 1.3266 - 1.3071 - 1.2955. Ichimoku Kinko Hyo (9.26.52), Pivot Points (classical), Moving Average (120) EUR/USD analysis for December 22 2020 - Potetnial for upside continuation and ttest of 1.2325 2020-12-22 BOE's Haldane: U 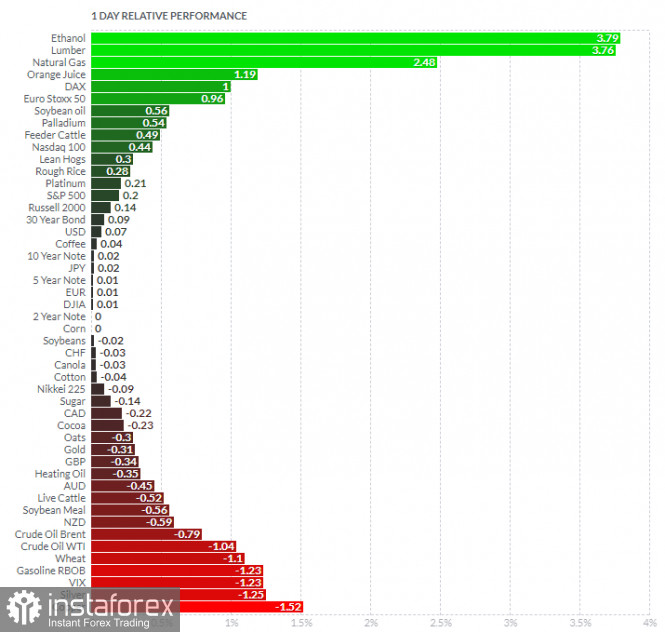 K economy still in a deep hole BOE chief economist, Andy Haldane, remarks to Guardian newspaper - UK jobs support should end only when virus crisis is over
- Economy still in a hole, and the hole is still deep
- Hopeful of a rapid bounce in activity thanks to the vaccine
As mentioned previously, the BOE has their hands tied by the Brexit saga at this point in time. While further easing measures are imminent, they still have to time it correctly. Further Development 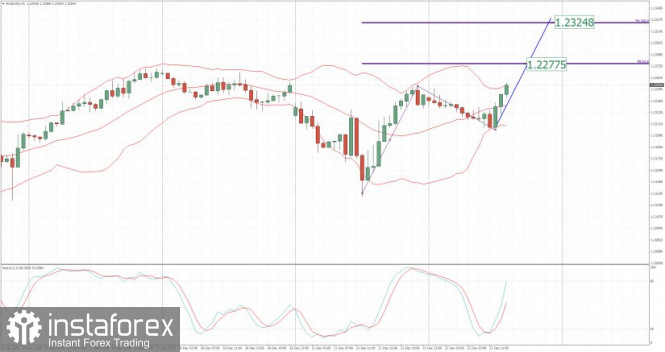
Analyzing the current trading chart of EUR, I found that the sellers got exhausted today and that buying continuation is on the way. My advice is to watch for buying opportunities on the intraday pullbacks with the upside targets at 1,2275 and 1,2325 (Fibonacci projections). 1-Day relative strength performance Finviz Based on the graph above I found that on the top of the list we got Ethanol and Lumber today and on the bottom VIX and Copper. Key Levels: Resistance: 1,2277 Support levels: 1,2205 and 1,2130 Analysis of Gold for December 22,.2020 - Selling climax in the background and potential for the rally towards $1.905 2020-12-22 Germany January GfK consumer confidence -7.3 vs -7.6 expected Prior -6.7; revised to -6.8 German consumer morale eases for a third consecutive month into January as tighter restrictions weigh on sentiment, reducing income expectations and increasing the propensity among households to save more into the new year. The headline reading is the lowest since July with GfK noting that: "At present, the savings indicator is the main factor driving the third decline in a row in the consumer climate." Further Development 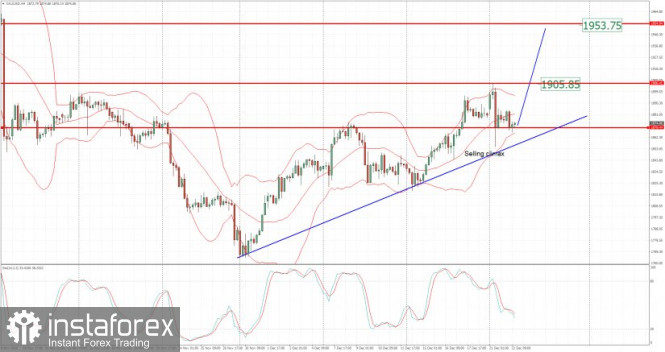
Analyzing the current trading chart of Gold, I found that there was the selling climax from yesterday and successful test on lower volume, which is sign for the further rise. My advice is to wattch for buying opportunities with the upside targets at $1,905 and $1,953. Additionally, there is the rising trendline, which is still active.... 1-Day relative strength performance Finviz 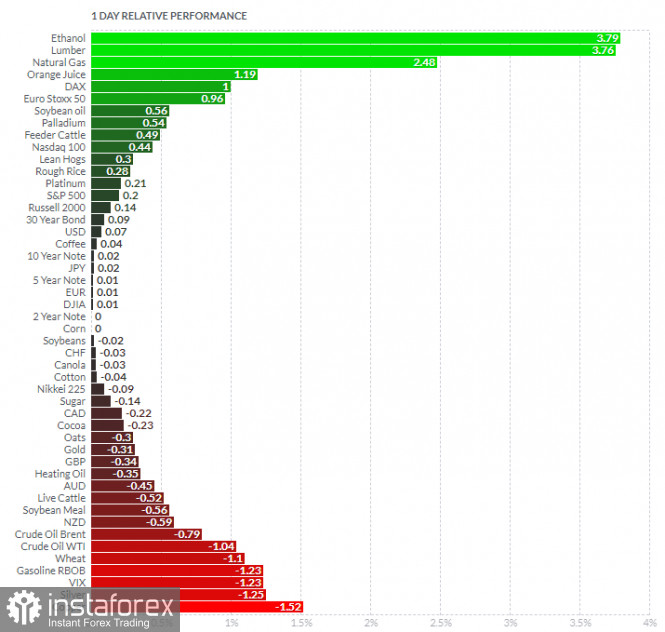
Based on the graph above I found that on the top of the list we got Ethanol and Lumber today and on the bottom VIX and Copper. Key Levels: Resistance: $1,905 and $1,953. Support level: $1,855
Author's today's articles: Vladislav Tukhmenev  Vladislav graduated from Moscow State University of Technologiy and Management. He entered the forex market in early 2008. Vladislav is a professional trader, analyst, and manager. He applies a whole gamut of analysis – technical, graphical, mathematical, fundamental, and candlestick analysis. Moreover, he forecasts the market movements using his own methods based on the chaos theory. Vladimir took part in development of trading systems devoted to fractal analysis. In his free time, Vladimir blogs about exchange markets. Hobbies: active leisure, sporting shooting, cars, design, and marketing. "I do not dream only of becoming the best in my field. I also dream about those who I will take with me along the way up." Vladislav graduated from Moscow State University of Technologiy and Management. He entered the forex market in early 2008. Vladislav is a professional trader, analyst, and manager. He applies a whole gamut of analysis – technical, graphical, mathematical, fundamental, and candlestick analysis. Moreover, he forecasts the market movements using his own methods based on the chaos theory. Vladimir took part in development of trading systems devoted to fractal analysis. In his free time, Vladimir blogs about exchange markets. Hobbies: active leisure, sporting shooting, cars, design, and marketing. "I do not dream only of becoming the best in my field. I also dream about those who I will take with me along the way up." Mourad El Keddani  Was born in Oujda, Morocco. Currently lives in Belgium. In 2003 obtained B.S. in Experimental Sciences. In 2007 obtained a graduate diploma at Institut Marocain Specialise en Informatique Applique (IMSIA), specialty – Software Engineering Analyst. In 2007–2009 worked as teacher of computer services and trainer in a professional school specializing in computer technologies and accounting. In 2005 started Forex trading. Authored articles and analytical reviews on Forex market on Forex websites and forums. Since 2008 performs Forex market research, and develops and implements his own trading strategies of Forex analysis (especially in Forex Research & Analysis, Currency Forecast, and Recommendations and Analysis) that lies in: Numerical analysis: Probabilities, equations and techniques of applying Fibonacci levels. Classical analysis: Breakout strategy and trend indicators. Uses obtained skills to manage traders' accounts since 2009. In April 2009 was certified Financial Technician by the International Federation of Technical Analysts. Winner of several social work awards: Education Literacy and Non-Formal Education (in Literacy and Adult Education in The National Initiative for Human Development). Was born in Oujda, Morocco. Currently lives in Belgium. In 2003 obtained B.S. in Experimental Sciences. In 2007 obtained a graduate diploma at Institut Marocain Specialise en Informatique Applique (IMSIA), specialty – Software Engineering Analyst. In 2007–2009 worked as teacher of computer services and trainer in a professional school specializing in computer technologies and accounting. In 2005 started Forex trading. Authored articles and analytical reviews on Forex market on Forex websites and forums. Since 2008 performs Forex market research, and develops and implements his own trading strategies of Forex analysis (especially in Forex Research & Analysis, Currency Forecast, and Recommendations and Analysis) that lies in: Numerical analysis: Probabilities, equations and techniques of applying Fibonacci levels. Classical analysis: Breakout strategy and trend indicators. Uses obtained skills to manage traders' accounts since 2009. In April 2009 was certified Financial Technician by the International Federation of Technical Analysts. Winner of several social work awards: Education Literacy and Non-Formal Education (in Literacy and Adult Education in The National Initiative for Human Development).
Languages: Arabic, English, French and Dutch.
Interests: Algorithm, Graphics, Social work, Psychology and Philosophy. Andrey Shevchenko  Andrey Shevchenko Andrey Shevchenko Mihail Makarov  - - Ivan Aleksandrov  Ivan Aleksandrov Ivan Aleksandrov Zhizhko Nadezhda  Graduated from Irkutsk State University. Having acquainted with Forex market in 2008, followed the courses in the International Academy of Stock Exchange Trading. The agenda was so exiting that she moved to St. Petersburg in order to get professional education. Obtained a diploma of the retraining course on the discipline Exchange market and stock market issues, defended the graduation paper with distinction on the subject "Modern technical indicators as the basis of the trading system". At the moment obtains a master degree in International Banking Institute on specialty Financial markets and investments. Apart from trading is occupied with development of trading systems and formalization of the working strategies using Ichimoku indicator. At the moment is working on the book dedicated to the peculiarities of Ichimoku indicator and its operating methods. Interests: yoga, literature, travelling and photograph. "You can only get smarter by playing a smarter opponent" Basics of Chess play, 1883 "Successful people change by themselves, the others are changed by life" Jim Rohn Graduated from Irkutsk State University. Having acquainted with Forex market in 2008, followed the courses in the International Academy of Stock Exchange Trading. The agenda was so exiting that she moved to St. Petersburg in order to get professional education. Obtained a diploma of the retraining course on the discipline Exchange market and stock market issues, defended the graduation paper with distinction on the subject "Modern technical indicators as the basis of the trading system". At the moment obtains a master degree in International Banking Institute on specialty Financial markets and investments. Apart from trading is occupied with development of trading systems and formalization of the working strategies using Ichimoku indicator. At the moment is working on the book dedicated to the peculiarities of Ichimoku indicator and its operating methods. Interests: yoga, literature, travelling and photograph. "You can only get smarter by playing a smarter opponent" Basics of Chess play, 1883 "Successful people change by themselves, the others are changed by life" Jim Rohn Petar Jacimovic  Petar was born on July 08, 1989 in Serbia. Graduated from Economy University and after has worked as a currency analyst for large private investors. Petar has been involved in the world of finance since 2007. In this trading he specializes in Volume Price Action (volume background, multi Fibonacci zones, trend channels, supply and demand). He also writes the market analytical reviews for Forex forums and websites. Moreover Petar is forex teacher and has wide experience in tutoring and conducting webinars. Interests : finance, travelling, sports, music "The key to success is hard work" Petar was born on July 08, 1989 in Serbia. Graduated from Economy University and after has worked as a currency analyst for large private investors. Petar has been involved in the world of finance since 2007. In this trading he specializes in Volume Price Action (volume background, multi Fibonacci zones, trend channels, supply and demand). He also writes the market analytical reviews for Forex forums and websites. Moreover Petar is forex teacher and has wide experience in tutoring and conducting webinars. Interests : finance, travelling, sports, music "The key to success is hard work"
Subscription's options management Theme's:
Fundamental analysis, Fractal analysis, Wave analysis, Technical analysis, Stock Markets
Author's :
A Zotova, Aleksey Almazov, Alexander Dneprovskiy, Alexandr Davidov, Alexandros Yfantis, Andrey Shevchenko, Arief Makmur, Dean Leo, Evgeny Klimov, Fedor Pavlov, Grigory Sokolov, I Belozerov, Igor Kovalyov, Irina Manzenko, Ivan Aleksandrov, l Kolesnikova, Maxim Magdalinin, Mihail Makarov, Mohamed Samy, Mourad El Keddani, Oleg Khmelevskiy, Oscar Ton, Pavel Vlasov, Petar Jacimovic, R Agafonov, S Doronina, Sebastian Seliga, Sergey Belyaev, Sergey Mityukov, Stanislav Polyanskiy, T Strelkova, Torben Melsted, V Isakov, Viktor Vasilevsky, Vladislav Tukhmenev, Vyacheslav Ognev, Yuriy Zaycev, Zhizhko Nadezhda
Edit data of subscription settings
Unsubscribe from the mailing list Sincerely,
Analysts Service | If you have any questions, you can make a phone call using one of the
InstaForex Toll free numbers right now:
|  |  InstaForex Group is an international brand providing online trading services to the clients all over the world. InstaForex Group members include regulated companies in Europe, Russia and British Virgin Islands. This letter may contain personal information for access to your InstaForex trading account, so for the purpose of safety it is recommended to delete this data from the history. If you have received this letter by mistake, please contact InstaForex Customer Relations Department. |


 K economy still in a deep hole


 Vladislav graduated from Moscow State University of Technologiy and Management. He entered the forex market in early 2008. Vladislav is a professional trader, analyst, and manager. He applies a whole gamut of analysis – technical, graphical, mathematical, fundamental, and candlestick analysis. Moreover, he forecasts the market movements using his own methods based on the chaos theory. Vladimir took part in development of trading systems devoted to fractal analysis. In his free time, Vladimir blogs about exchange markets. Hobbies: active leisure, sporting shooting, cars, design, and marketing. "I do not dream only of becoming the best in my field. I also dream about those who I will take with me along the way up."
  Was born in Oujda, Morocco. Currently lives in Belgium. In 2003 obtained B.S. in Experimental Sciences. In 2007 obtained a graduate diploma at Institut Marocain Specialise en Informatique Applique (IMSIA), specialty – Software Engineering Analyst. In 2007–2009 worked as teacher of computer services and trainer in a professional school specializing in computer technologies and accounting. In 2005 started Forex trading. Authored articles and analytical reviews on Forex market on Forex websites and forums. Since 2008 performs Forex market research, and develops and implements his own trading strategies of Forex analysis (especially in Forex Research & Analysis, Currency Forecast, and Recommendations and Analysis) that lies in: Numerical analysis: Probabilities, equations and techniques of applying Fibonacci levels. Classical analysis: Breakout strategy and trend indicators. Uses obtained skills to manage traders' accounts since 2009. In April 2009 was certified Financial Technician by the International Federation of Technical Analysts. Winner of several social work awards: Education Literacy and Non-Formal Education (in Literacy and Adult Education in The National Initiative for Human Development).
 Andrey Shevchenko
  -
-  Ivan Aleksandrov
  Graduated from Irkutsk State University. Having acquainted with Forex market in 2008, followed the courses in the International Academy of Stock Exchange Trading. The agenda was so exiting that she moved to St. Petersburg in order to get professional education. Obtained a diploma of the retraining course on the discipline Exchange market and stock market issues, defended the graduation paper with distinction on the subject "Modern technical indicators as the basis of the trading system". At the moment obtains a master degree in International Banking Institute on specialty Financial markets and investments. Apart from trading is occupied with development of trading systems and formalization of the working strategies using Ichimoku indicator. At the moment is working on the book dedicated to the peculiarities of Ichimoku indicator and its operating methods. Interests: yoga, literature, travelling and photograph. "You can only get smarter by playing a smarter opponent" Basics of Chess play, 1883 "Successful people change by themselves, the others are changed by life" Jim Rohn
  Petar was born on July 08, 1989 in Serbia. Graduated from Economy University and after has worked as a currency analyst for large private investors. Petar has been involved in the world of finance since 2007. In this trading he specializes in Volume Price Action (volume background, multi Fibonacci zones, trend channels, supply and demand). He also writes the market analytical reviews for Forex forums and websites. Moreover Petar is forex teacher and has wide experience in tutoring and conducting webinars. Interests : finance, travelling, sports, music "The key to success is hard work"
No comments:
Post a Comment