| Analytics and trading signals for beginners. How to trade EUR/USD on November 4? Plan for opening and closing trades on Wednesday 2020-11-04 Hourly chart of the EUR/USD pair 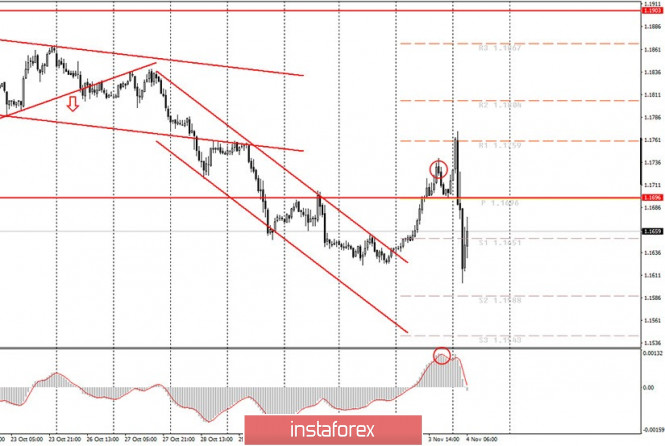 The EUR/USD pair started to sharply decline last night, which reached a total of over 150 points. It happened around the time that polling stations were closed in America. There were no compelling reasons for such a solid strengthening of the US dollar, although we will talk about the fundamental background a little below. The most important thing now is that the technical picture is completely destroyed. After such a sharp drop, one cannot say that the downward trend has resumed now (although the previous local low was updated), but at the same time, one cannot also say that the upward trend is gaining momentum. Now we need the markets to calm down, afterwards we need to re-evaluate the technical picture and draw conclusions. No trend lines or channel can be drawn. Other signals are also very difficult to receive. The MACD indicator does not normally react to all price reversals - they are too sharp. At night, the first results of the counting of votes in the United States began to arrive and, according to these data, Joe Biden is in the lead by a large margin. Thus, we can conclude that traders reacted precisely to this factor. However, take note that these are only interim voting results. The final results will become known later and, of course, may differ from the current ones in any direction. You should also remember that the European trading session will open in the coming hours. Simply put, it is still night in the US, the exchanges are closed, so trading among the major players is not carried out. Therefore, with the opening of Europe, and in the afternoon and America, the market may experience new shocks, strong and sharp reversals, as well as new jerks up or down by 100-200 points. Novice traders should be prepared for this. As for macroeconomic statistics, indexes of business activity in the service sectors of the United States and the European Union will be published today, and they are not that important. No reactions towards such data - the markets are now absorbed by completely different news - however, they will make it clear to us how much the service sector in the EU has decreased due to the second wave of COVID-2019 and the repeated lockdown. Also, a rather important ADP report on changes in the level of employment in the private sector will be published in the United States, however, we believe that today any other news and reports, in addition to those related to elections and vote counting, will be ignored by the markets. Thus, everyone will focus on the counting of votes. Possible scenarios for November 4: 1) Buy positions on the EUR/USD pair became relevant after the price settled above the descending channel. However, after rising, which novice traders could work out, thanks to our recommendations, the quotes began to collapse and now it is extremely difficult to understand when and where it will end. In general, it will be extremely difficult to receive buy signals today, and the fundamental background may continue to have a strong impact on the mood of the markets. 2) Trading for a fall at this time has ceased to be relevant, despite the fact that the pair fell by 150 points in the evening. The pair could rise when the European session opens, or it could fall. Today can be extremely volatile. We advise novice traders to wait until the markets calm down. On the chart: Support and Resistance Levels are the Levels that serve as targets when buying or selling the pair. You can place Take Profit near these levels. Red lines are the channels or trend lines that display the current trend and show in which direction it is better to trade now. Up/down arrows show where you should sell or buy after reaching or breaking through particular levels. The MACD indicator (14,22,3) consists of a histogram and a signal line. When they cross, this is a signal to enter the market. It is recommended to use this indicator in combination with trend lines (channels and trend lines). Important announcements and economic reports that you can always find in the news calendar can seriously influence the trajectory of a currency pair. Therefore, at the time of their release, we recommended trading as carefully as possible or exit the market in order to avoid a sharp price reversal. Beginners on Forex should remember that not every single trade has to be profitable. The development of a clear strategy and money management are the key to success in trading over a long period of time. EUR/USD: plan for the European session on November 4. COT reports. Trump is not as simple as everyone thought. US dollar surged after first vote count 2020-11-04 To open long positions on EUR/USD, you need: In yesterday's afternoon forecast, I drew attention to buying the euro in the support area of 1.1701, the breakdown of which took place in the middle of the day. If you look at the 5-minute chart, you will see how buyers confirmed their presence with several more false breakouts, afterwards the euro went up further, just barely reaching the resistance of 1.1754. However, the bullish momentum did not continue and after the first results of voting in different states appeared, it became clear that Biden's victory would not be so easy, if at all. According to the results of the first polls, 14 states voted for Donald Trump, against 12, which prefer to see Joe Biden as the new president. Accordingly, the market reaction was not long in coming and the US dollar regained all its positions, renewing its monthly lows against the euro. 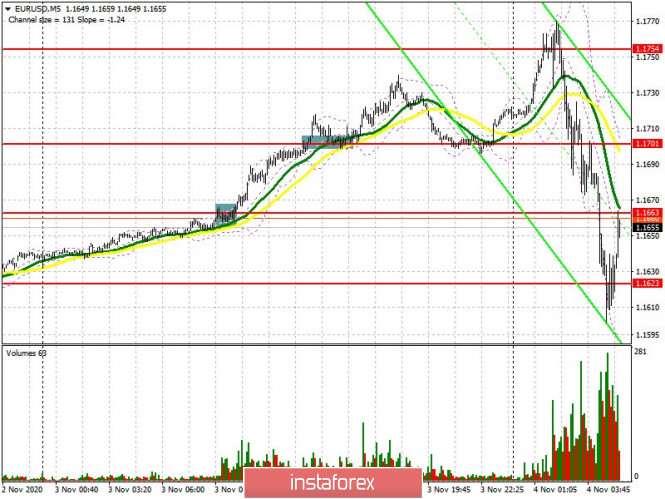 At the moment, it is better not to rush to enter the market at such volatility, since we are not certain whether we can reach such large levels today, since no one knows which direction the market will prefer. One thing is clear, the bulls need to settle above the resistance of 1.1663, which will push the pair up to the high of 1.1701. However, I recommend building up long positions after settling above this range with the goal of reaching the 1.1765 level, from which the entire fall began today. In case the pair falls, forming a false breakout in the support area of 1.1604 will keep buyers optimistic. The absence of bulls' activity in that area will pull down the pair to a low of 1.1541, where we can watch the downward movement stop and an upward correction of 15-20 points. I recommend buying EUR/USD immediately on a rebound only from the low of 1.1490. To open short positions on EUR/USD, you need: Sellers have one simple task - to keep the resistance at 1.1663, where forming a false breakout will be a signal to open short positions in the euro. Slightly higher is the no less important level of 1.1701, which I also recommend paying attention to, as its breakout will lead to a powerful bullish momentum. The bears' main goal in the first half of the day will be to form a breakout and get the pair to settle below the support of 1.1604, which will raise the pressure on the euro and lead to a large sale of EUR/USD to the area of the lows of 1.1541 and 1.1490. You can count on such a scenario after the release of a number of fundamental statistics on activity in the service sector of the eurozone countries, which will probably slow down due to the spread of the coronavirus pandemic. In case EUR/USD grows above the resistance of 1.1701, there is no need to rush to sell. It is best to postpone short positions until the 1.1765 highs are renewed in hopes of a 15-20 point correction, or to sell the euro for a rebound from the new local highs of 1.1835 and 1.1915. 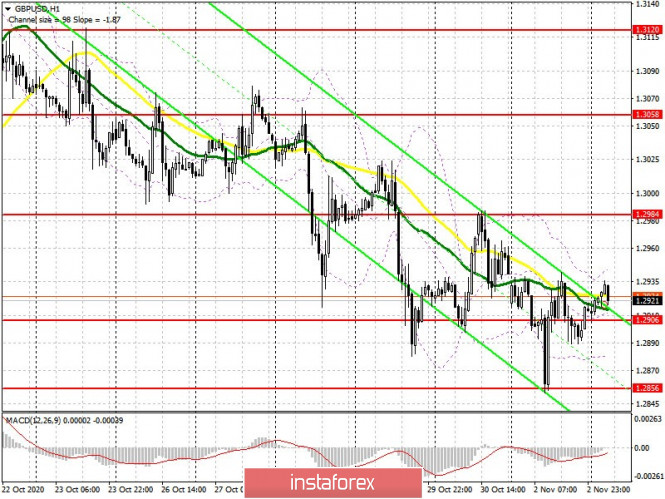 The Commitment of Traders (COT) report for October 27 showed a reduction in both long and short positions. Despite this, buyers of risky assets believe that the bull market will continue and so they prefer to act with caution. Thus, long non-commercial positions fell from 229,878 to 217,443, while short non-commercial positions also fell to 61,888 from 63,935. The total non-commercial net position decreased to 155,555 from 165,943 a week earlier. However, the bullish sentiments for the euro remains rather high in the medium term. The more the euro will decline against the US dollar at the end of this year, the more attractive it will be for new investors, especially following the US presidential elections, when additional pressure on the market on this issue eases. Indicator signals: Moving averages Trading is carried out just below the 30 and 50 moving averages, which indicates an active opposition of buyers and sellers. Note: The period and prices of moving averages are considered by the author on the H1 hourly chart and differs from the general definition of the classic daily moving averages on the D1 daily chart. Bollinger Bands In case of growth, the upper border of the indicator at 1.1765 will act as resistance. Description of indicators - Moving average (moving average, determines the current trend by smoothing out volatility and noise). Period 50. It is marked in yellow on the chart.
- Moving average (moving average, determines the current trend by smoothing out volatility and noise). Period 30. It is marked in green on the chart.
- MACD indicator (Moving Average Convergence/Divergence — convergence/divergence of moving averages) Quick EMA period 12. Slow EMA period to 26. SMA period 9
- Bollinger Bands (Bollinger Bands). Period 20
- Non-commercial speculative traders, such as individual traders, hedge funds, and large institutions that use the futures market for speculative purposes and meet certain requirements.
- Long non-commercial positions represent the total long open position of non-commercial traders.
- Short non-commercial positions represent the total short open position of non-commercial traders.
- Total non-commercial net position is the difference between short and long positions of non-commercial traders.
GBP/USD: plan for the European session on November 4. COT reports. Pound reacts to US vote count, loses ground 2020-11-04 To open long positions on GBP/USD, you need: The British pound generated several signals to enter the market yesterday, which made it possible to earn. Let's take a look at the 5-minute chart and break down the entry points in more detail. Even in my afternoon forecast, I paid attention to the signal to buy the pound and advised you to open long positions from the 1.2984 level, especially if the entry point was confirmed by another false breakout, which happened. I marked the area on the chart where it was possible and necessary to enter long positions. The upward movement was more than 80 points. Short positions from resistance at 1.3058 during the first test did not bring much profit, although they also took place. 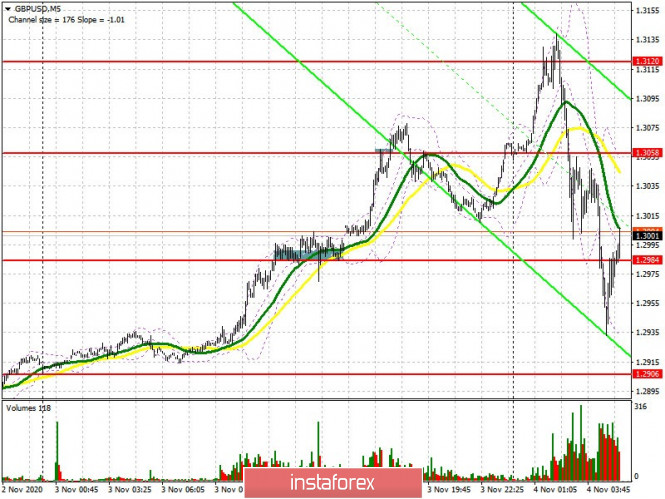 Taking into account the pressure under which the market is now, and what volatility is observed on it, there is clearly no need to rush into making a decision to enter it. Yesterday's bullish momentum stopped after the first results of voting in various states appeared, from which it became clear that Biden's victory would not be so easy, if at all. According to the results of the first polls, 14 states voted for Donald Trump, against 12, which prefer to see Joe Biden as the new president. Accordingly, the market reaction was not long in coming and the US dollar regained all its positions against the British pound. Now buyers need to defend support at 1.2967, and forming a false breakout on it will be a signal to open long positions in the hopes of a return to resistance at 1.3043. Data on activity in the UK service sector could provide support, which should be better than the economists forecasts. An additional task for the bulls is to settle above resistance 1.3043 in the first half of the day, the test of which on the reverse side, similar to yesterday's entry point into long positions, forms a good buy signal, which can quickly return GBP/USD to the resistance area of 1.3136, where I recommend taking profit. In case the pound falls on the new results of the vote count in the US, it is best not to rush into buy positions. Perhaps the price will stop in the support area of 1.2914, but most likely the large bulls will prefer to return to the market only after the 1.2856 low has been updated, on which the further large upward movement of the pair depends. From it, you can open long positions with the expectation of a rebound of 30-40 points within the day. To open short positions on GBP/USD, you need: Pound sellers are now aiming for support at 1.2967. A breakout and consolidation below this range will form a new entry point for short positions, which will cause the pound to fall to a low of 1.2914, which the pair failed to reach today during the Asian session. But as I noted above, sellers will focus on a large low at 1.2856, on which the current bull market depends. A breakout and getting the pair to settle below this range will lead to removing a number of buy stop orders, which will pull down the pound to the 1.2807 and 1.2749 areas, where a slight upward correction of the pair can be observed. In case bears are not active and the pair grows in the first half of the day, it is best to think about sell positions after forming a false breakout in the resistance area of 1.3043. It is possible to open short positions in GBP/USD immediately for a rebound only from a high of 1.3136, counting on a correction of 20-30 points within the day. However, much will depend on new state and voting data. 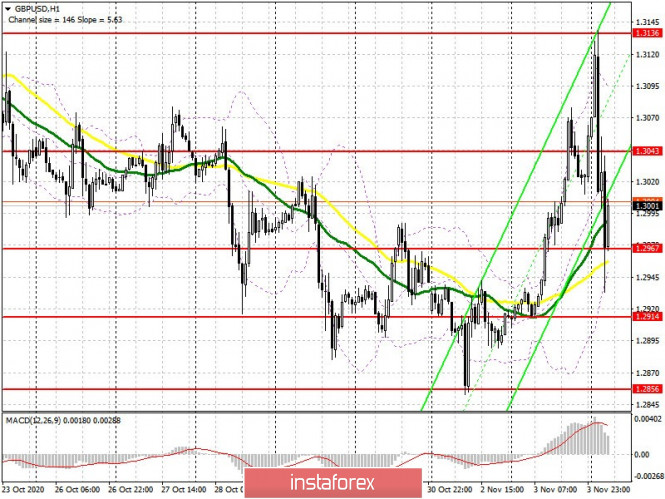 The Commitment of Traders (COT) reports for October 27 showed a reduction in both short and long positions. Long non-commercial positions fell from 39,836 to 31,799. At the same time, short non-commercial positions fell from 41,836 to 38,459. As a result, the negative non-commercial net position was at -6,660, against -2,000 a week earlier, which indicates that the sellers of the British pound retained control and also shows their minimal advantage in the current situation. Indicator signals: Moving averages Trading is carried out in the area of 30 and 50 moving averages, which indicates an active opposition of buyers and sellers. Note: The period and prices of moving averages are considered by the author on the H1 hourly chart and differs from the general definition of the classic daily moving averages on the D1 daily chart. Bollinger Bands A break of the lower border of the indicator near 1.2965 will increase the pressure on the pound. Growth will be limited in the area of the upper level of the indicator 1.3110. Description of indicators - Moving average (moving average, determines the current trend by smoothing out volatility and noise). Period 50. It is marked in yellow on the chart.
- Moving average (moving average, determines the current trend by smoothing out volatility and noise). Period 30. It is marked in green on the chart.
- MACD indicator (Moving Average Convergence/Divergence — convergence/divergence of moving averages) Quick EMA period 12. Slow EMA period to 26. SMA period 9
- Bollinger Bands (Bollinger Bands). Period 20
- Non-commercial speculative traders, such as individual traders, hedge funds, and large institutions that use the futures market for speculative purposes and meet certain requirements.
- Long non-commercial positions represent the total long open position of non-commercial traders.
- Short non-commercial positions represent the total short open position of non-commercial traders.
- Total non-commercial net position is the difference between short and long positions of non-commercial traders.
Indicator analysis. Daily review on EUR/USD for November 4, 2020 2020-11-04 The pair traded upward yesterday and tested the pullback level of 38.2% - 1.1720 (blue dotted line). Early this morning, due to high volatility (the market reaction to the news on the US presidential election), the price initially went up, testing the 50% pullback level - 1.1751 (blue dotted line), and then went down, testing the lower border of the Bollinger lines 1.1602 (black dotted line). The price may continue to move upward. Economic calendar news is expected at 13.15, 15.00, and 15.30 UTC (USD). Trend analysis (Fig. 1). Today, the market from the support level of 1.1622 (white bold line), can continue to move upward with the goal of 1.1683 – a pullback level of 23.6% (blue dotted line). If this line is tested, further upward work is possible with the goal of 1.1720 - a pullback level of 39.2% (blue dotted line). 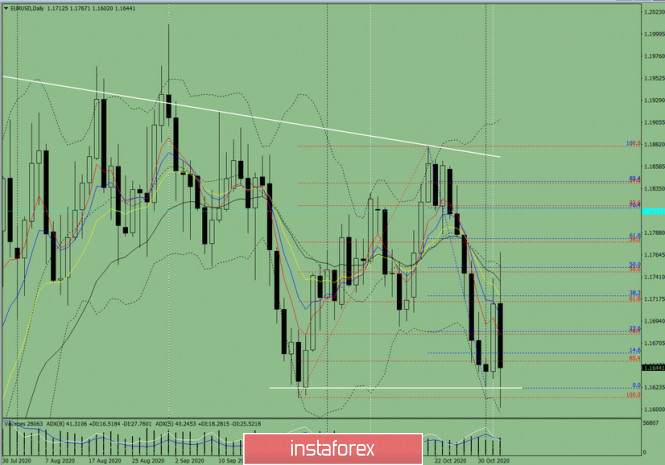
Figure 1 (Daily chart). Comprehensive analysis: - Indicator analysis - up
- Fibonacci levels - up
- Volumes - up
- Candlestick analysis - up
- Trend analysis - up
- Bollinger bands - up
- Weekly chart - up
General conclusion: Today, the price may continue to move upward with the goal of 1.1683 - a pullback level of 23.6% (blue dotted line). If this line is tested, further upward work is possible with the goal of 1.1720 - a pullback level of 39.2% (blue dotted line). Unlikely scenario: upon moving down and reaching the support level - 1.1622 (white bold line), the price may start moving up to the pullback level of 14.6% - 1.1660 (blue dotted line). Indicator analysis. Daily review for the GBP/USD currency pair 04/11/2020 2020-11-04 The pair moved up on Tuesday and tested the pullback level of 61.8% at 1.3054 (blue dotted line). Today, the price, working out the news background, went down and tested the support line at 1.2946 (red bold line). It will try to continue moving up. News on the market is expected at 12:30 UTC (Pound) and 16:14, 18:00, and 18:30 UTC (Pound). Trend analysis (Fig. 1) Today, the market will try to continue moving up from the support line 1.2948 (red bold line) to reach the pullback level of 50.0% at 1.3016 (blue dotted line). If this level is tested, the upward movement will continue with the goal of 1.3054 which is a pullback level of 61.8% (blue dotted line). 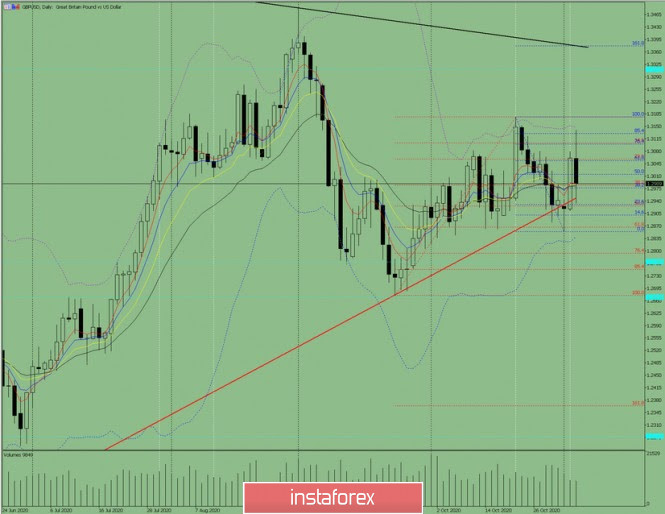 Figure 1 (daily chart). Complex analysis: - Indicator Analysis – up
- Fibonacci Levels – up
- Volumes – up
- Candle Analysis – up
- Trend Analysis – down
- Bollinger Bands – up
- Weekly Chart – up
General conclusion: From the support line at 1.2948 (red bold line), the price will try to continue moving up in order to reach the pullback level of 50.0% at 1.3016 (blue dotted line). If this level is tested, the upward movement will continue with the goal of 1.3054 which is a pullback level of 61.8% (blue dotted line). Unlikely scenario: From the pullback level of 38.2% at 1.2977 (blue dotted line), the price will work down to reach the support line at 1.2948 (red bold line). If this line is tested, it will work down to the target of 1.2867 with a rollback level of 61.8% (red dotted line) Simplified wave analysis and forecast for EUR/USD, AUD/USD, and GBP/JPY on November 4 2020-11-04 EUR/USD Analysis: The movements of the last days on the chart of the European currency canceled the upward reversal pattern that began in September. All current movements of the last month were related to the bearish correction wave of the four-hour timeframe of July 31. According to Elliott's VA, this is a stretched plane. Forecast: The next day is expected to move between the nearest zones in the summer. In the first half of the day, an upward trend is likely. Further, in the resistance zone, you can expect a reversal and a repeated decline. You should count on updating the local minimum. Potential reversal zones Resistance: - 1.1720/1.1750 Support: - 1.1650/1.1620 Recommendations: Trading in the euro market today can be very risky due to sharp fluctuations in the exchange rate. We recommend lowering the standard lot. Sales from the resistance zone are more promising. 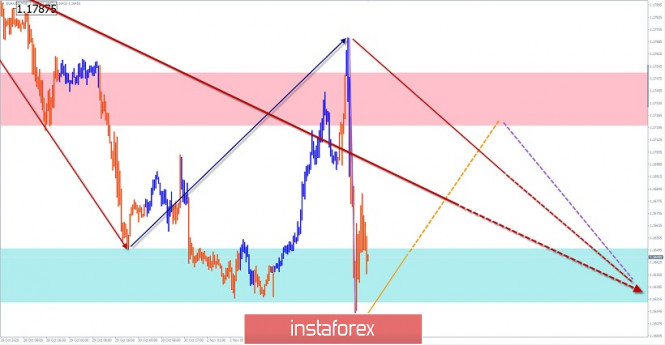
AUD/USD Analysis: Current price fluctuations fit into the algorithm of the rising wave from September 25. The structure of the wave shows the sequence (A-B-C). The decline that started today forms a correction in the final part. Forecast: Today, the pair's exchange rate is expected to move mainly in the lateral plane. In the next session, you can expect an attempt to put pressure on the resistance zone. By the end of the day, a decline is more likely, with a return to the support zone. Potential reversal zones Resistance: - 0.7150/0.7180 Support: - 0.7090/0.7060 Recommendations: Trading on the pair's market today is quite risky and can only be successful during sessions. Tool purchases are safer. 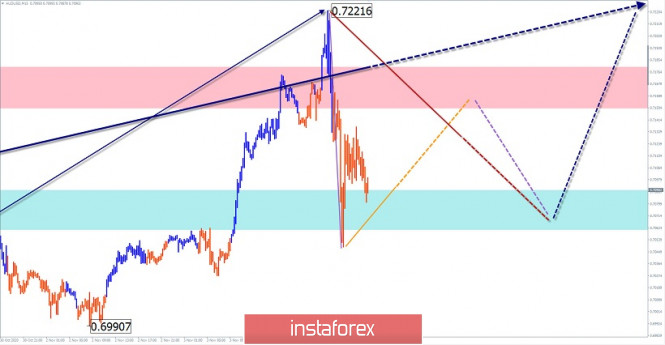
GBP/JPY Analysis: The last incomplete wave construction of the pound/yen cross is downward. It has been reporting since October 12. In the structure, the middle part (B) is close to completion. the bearish section that began in the Asian session has a reversal potential and may be the beginning of the final part (C). Forecast: The price is expected to move sideways the next day. After trying to put pressure on the resistance zone. A reversal and price rise in the area of the resistance zone is likely. Potential reversal zones Resistance: - 137.00/137.30 Support: - 135.90/135.60 Recommendations: The best tactic today is to refrain from entering the pair's market until the downside reversal is complete. Short-term transactions are allowed according to the expected sequence. The lot should be reduced as much as possible. 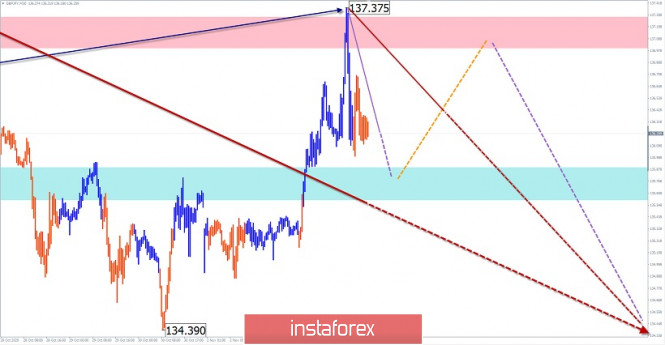
Explanation: In the simplified wave analysis (UVA), waves consist of 3 parts (A-B-C). The last incomplete wave is analyzed. The solid background of the arrows shows the formed structure, and the dotted background shows the expected movements. Note: The wave algorithm does not take into account the duration of the instrument's movements in time! Trading plan for the EUR/USD pair on November 4. COVID-19 and the US presidential elections. The euro is experiencing a high trading volatility. 2020-11-04 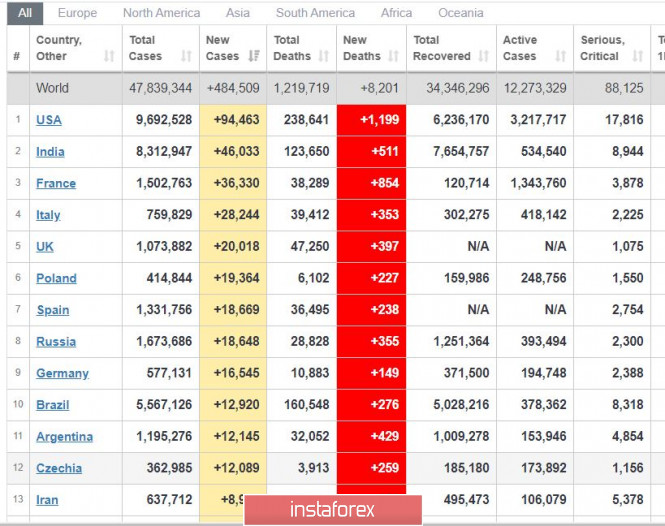
COVID-19: The United States has again recorded almost 95 thousand new coronavirus cases. Aside from that, deaths caused by the virus have also increased very sharply. The same problem is observed in Europe as well, thus, most European countries have again implemented quarantine, which puts pressure both on the euro and oil. US elections: As of the first counting of votes, Biden is on the lead, having 224 electoral votes, while Trump has 213. This just means that both candidates still have a chance of winning (270 votes is needed to win the race). 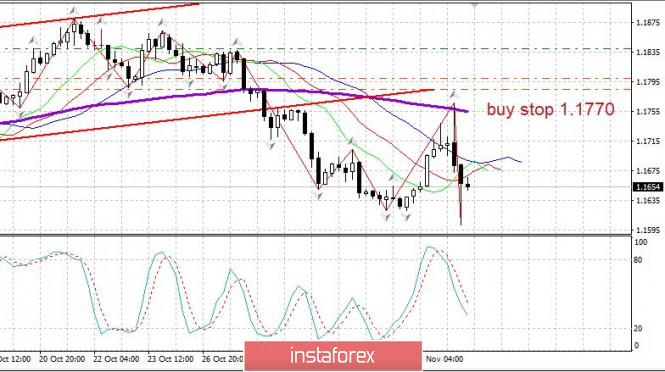
EUR/USD - During the night of the US elections, the euro experienced sharp jumps in the market, which is actually not typical for the currency. But by the European session, the situation seems to have calmed again. Open short positions from 1.1785. Open long positions from 1.1770 New shorts can be opened if the euro consolidates below 1.1610 Next week, the market will be driven by the Fed's decision on monetary policy, as well as by the latest US employment reports. Technical Analysis of EUR/USD for November 4, 2020 2020-11-04 Technical Market Outlook: The EUR/USD pair has made another local low at the level of 1.1602 as the pair is doing some up and down swing as the votes in the presidential election in the USA are still being counted. Right now everything is possible, but the market looks to be bending towards a stronger US Dollar. The momentum is weak and negative and the market conditions at the H4 time frame chart are extremely oversold, so please keep an eye on a temporary rebound. The nearest technical resistance is seen at the level of 1.1695. Bears are in full control of the market and the weekly outlook is bearish despite the election night in the USA. Weekly Pivot Points: WR3 - 1.1974 WR2 - 1.1916 WR1 - 1.1756 Weekly Pivot - 1.1698 WS1 - 1.1531 WS2 - 1.1471 WS3 - 1.1314 Trading Recommendations: Since the middle of March 2020 the main trend is on EUR/USD pair has been up, which can be confirmed by almost 10 weekly up candles on the weekly time frame chart and 4 monthly up candles on the monthly time frame chart. The recent correction towards the level of 1.1612 seems to be completed and now market is ready for another wave up. This means any local corrections should be used to buy the dips until the key technical support is broken. The key long-term technical support is seen at the level of 1.1445. The key long-term technical resistance is seen at the level of 1.2555. 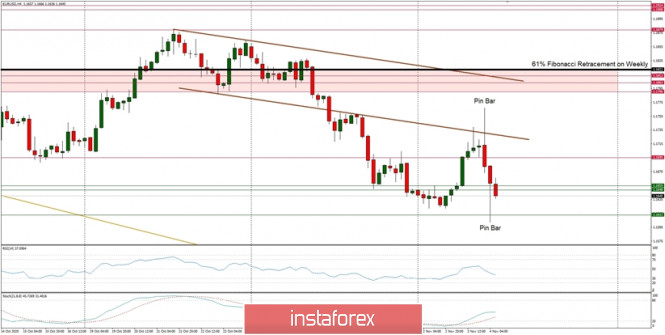
Technical Analysis of GBP/USD for November 4, 2020 2020-11-04 Technical Market Outlook: The GBP/USD pair is making the up and down swings today as the votes of the presidential elections in the USA are still being collected. The price has broken out of the acceleration channel and made a local high at the level of 1.3136, but the four hour candle closed way below the top, at the level of 1.3027. Currently, it looks like the US Dollar is getting stronger again and the Pound continues the move to the downside towards the short -term trend line support. Any sustained violation of this trend line will indicate more bearish pressure that can push the prices to the level of 1.2868, 1.2848 or even 1.2816. The weak and negative momentum supports the short-term bearish outlook despite the oversold market conditions. Only a sustained breakout above the level of 1.2982 would change the intraday outlook to bullish. Weekly Pivot Points: WR3 - 1.3236 WR2 - 1.3153 WR1 - 1.3037 Weekly Pivot - 1.2956 WS1 - 1.2835 WS2 - 1.2757 WS3 - 1.2653 Trading Recommendations: The GBP/USD pair is in the down trend on the monthly time frame, but the recent bounce from the low at 1.1411 made in the middle of March 2020 looks very strong and might be a reversal swing. In order to confirm the trend change, the bulls have to break through the technical resistance seen at the level of 1.3518. All the local corrections should be used to enter a buy orders as long as the level of 1.2674 is not broken. 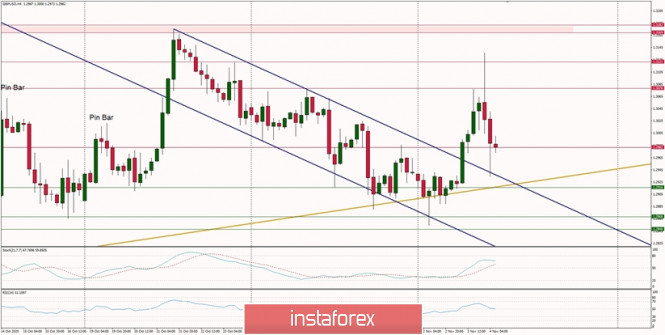
Trading idea for gold 2020-11-04  Last night, when the preliminary results of the US elections came out, a bullish impulse emerged on the US dollar, but then it was quickly bought out by traders. Regardless, gold bulls can rely on it when working for an increase, particularly on bringing the quote towards a price level of 1933. 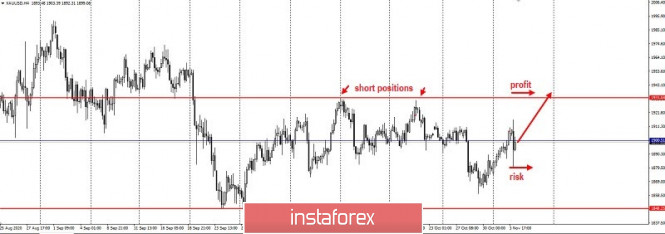 In fact, such a strategy has a good risk/profit ratio - 1.5 to 1. Aside from that, it uses the classic (and trusted) Price Action and Stop Hunting techniques. Good luck! GBP/USD. November 4. COT report. The Briton also got on the "roller coaster" ride. News on the topic of Brexit comes unpleasant 2020-11-04 GBP/USD – 1H. 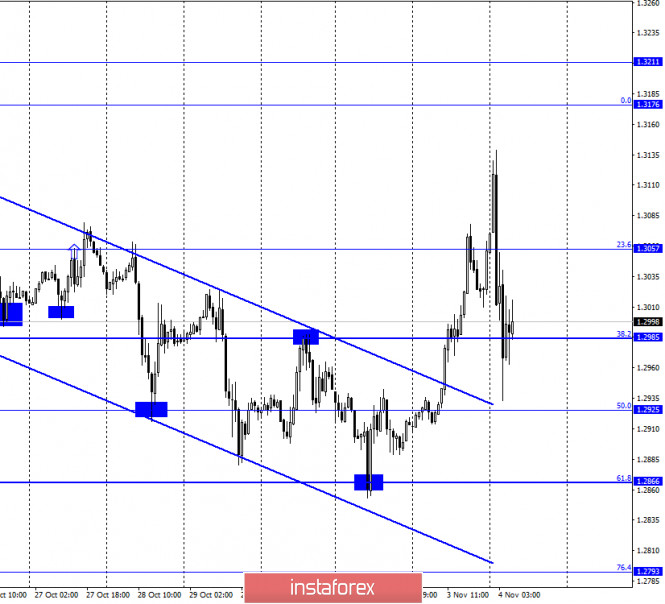
According to the hourly chart, the quotes of the GBP/USD pair performed an increase to 1.3135 over the past day, after which they turned in favor of the US currency and fell to the corrective level of 38.2% (1.2985). In total, the pair's quotes went up 220 points yesterday, and down 200 points tonight. Thus, the "roller coaster" is also present here, since the presidential election in the United States concerns all pairs in which the dollar is present. Meanwhile, if you pay attention to the news that came from the UK or rather news related to Brexit, we can assume a new drop in the British dollar in the coming days. So far, traders are trading solely based on American elections and vote counting. However, when this process is completed, they will again begin to pay attention to an equally important topic for the pair - the topic of Brexit. And in the last few days, several representatives of the European Union, in particular the European Commission, said that the parties have not yet been able to reach a common decision on key issues. Moreover, the European Commission made a statement that London did not give an official response to the claims of the European Union regarding Britain's violation of the Brexit agreement, which was concluded in 2019. Let me remind you that Boris Johnson submitted a bill "on the internal market of Great Britain", which violates some points of the agreement with the European Union. Parliament approved the bill in two readings, however, the final vote will take place later, when it becomes clear whether there will be a trade deal between London and Brussels or not. At the same time, the European Union intends to use legal pressure on Britain because of a possible violation of the Brexit agreement. GBP/USD – 4H. 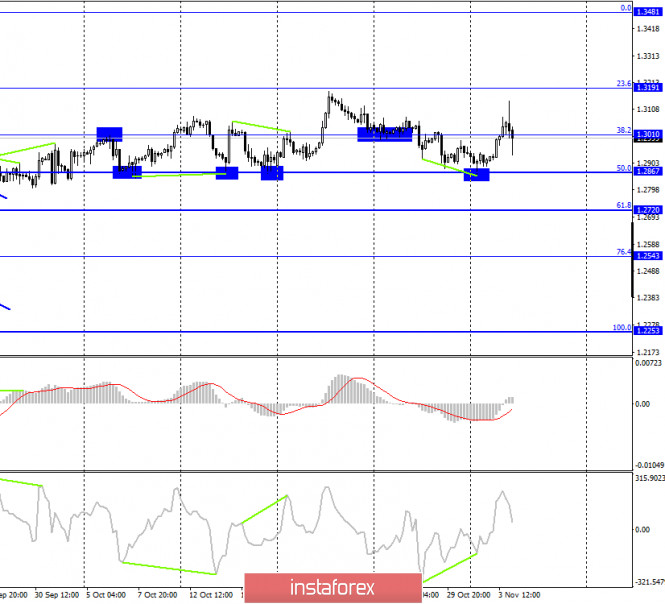
On the 4-hour chart, the GBP/USD pair performed a reversal in favor of the US currency and consolidated under the corrective level of 38.2% (1.3010), which allows us to count on a further drop in quotes in the direction of the next Fibo level of 50.0% (1.2867). However, as in the case of the European, I recommend paying more attention to the hourly chart today, which shows changes in the mood of traders more quickly. GBP/USD – Daily. 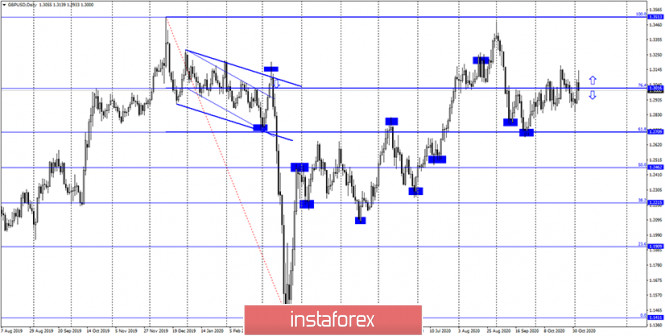
On the daily chart, the pair's quotes have consolidated below the corrective level of 76.4% (1.3016), which now allows us to expect a fall in the direction of the next corrective level of 61.8% (1.2709). GBP/USD – Weekly. 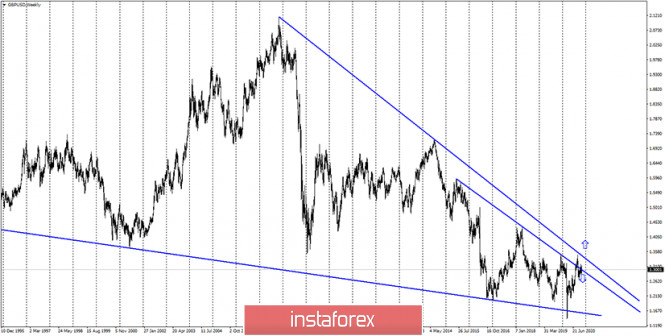
On the weekly chart, the pound/dollar pair closed under the lower downward trend line, thus, a false breakout of this line followed earlier. However, in recent weeks, the pair has made new attempts to gain a foothold over both trend lines. Overview of fundamentals: There were no economic reports or other important events in the UK on Tuesday, other than data related to the trade deal negotiations. However, they were not taken into account by traders. News calendar for the US and the UK: UK - PMI for services (09:30 GMT). US - change in the number of employees from ADP (13:15 GMT). US - composite ISM index for non-manufacturing (15:00 GMT). On November 4, the UK news calendar contains only the business activity index for the service sector. In America, more important reports will be released, as well as the counting of votes in the elections continues. And it is this information that will be most important for traders today. COT (Commitments of Traders) report: 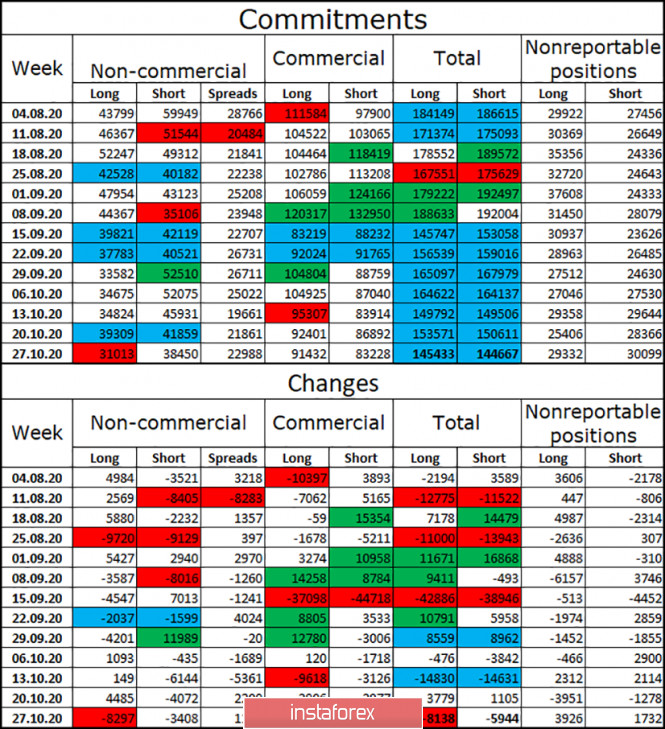
The latest COT report on the British pound showed that the mood of the "Non-commercial" category of traders became more "bearish" over the reporting week. Speculators got rid of 8,297 long contracts and 3,408 short contracts. Thus, in general, speculators got rid of any contracts for the British. However, it is mostly from long-contracts. This suggests that the major players do not believe in the pound. It is extremely difficult to do this in the current conditions, as the prospects for the British economy remain extremely vague. Since August, the total number of long contracts in the hands of speculators has decreased to an absolute minimum – only 31,013. The total number of open contracts among all categories of traders has been almost the same for two months. Forecast for GBP/USD and recommendations for traders: Today, I recommend selling the GBP/USD pair with targets of 1.2925 and 1.2866, if the quotes close under the Fibo level of 38.2% (1.2985) on the hourly chart. I recommend buying the British dollar with the goals of 1.3057 and 1.3135 if the rebound from the level of 1.2985 is made on the hourly chart. Terms: "Non-commercial" - major market players: banks, hedge funds, investment funds, private, large investors. "Commercial" - commercial enterprises, firms, banks, corporations, companies that buy currency not for speculative profit, but for current activities or export-import operations. "Non-reportable positions" - small traders who do not have a significant impact on the price. EUR/USD. November 4. COT report. The roller coaster has begun. Traders reacted violently to the first results of the vote count 2020-11-04 EUR/USD – 1H. 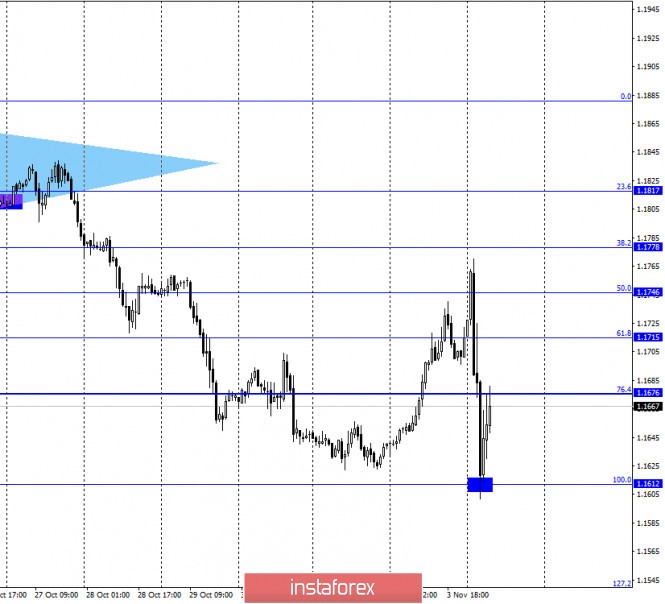
On November 3, the EUR/USD pair continued the growth process all day to the corrective level of 50.0% (1.1746). However, this night, when the polls in America closed, the voting was officially completed and the counting of votes began. The pair performed a sharp reversal in favor of the US currency and fell to the level of 100.0% (1.1612) in a matter of hours. The rebound of quotes from this level worked in favor of the European currency and growth to the corrective level of 76.4% (1.1676). And all together it can be called a "roller coaster". At the moment, about 70% of all votes have already been counted and the first data that more or less accurately reflects the picture of the election has been received. As of the morning of November 4, Joe Biden is winning the election, having already received 223 electoral college votes. However, Donald Trump also won a fairly large number of votes – 174. Let me remind you that you need to get 270 votes to win. So far, it is unclear what to do with the 100 million Americans who voted early or by mail. Are their votes taken into account in the overall rating? After all, Donald Trump has previously stated that counting votes by mail may take weeks. However, we will rely on official data provided by American sources responsible for counting votes. Today's day for the euro/dollar pair may pass again in quite active movements since there are no final voting results yet. EUR/USD – 4H. 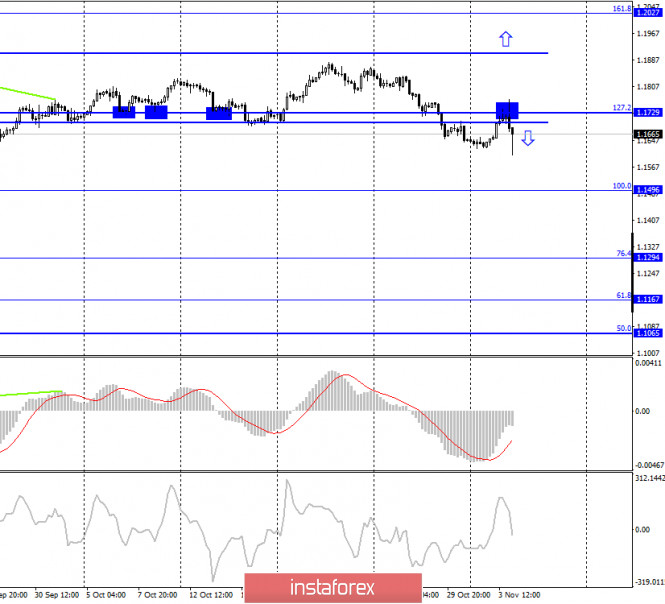
On the 4-hour chart, the pair's quotes performed an increase this night to the corrective level of 127.2% (1.1729). The rebound of quotes from this Fibo level worked in favor of the US currency and the resumption of the fall in the direction of the corrective level of 100.0% (1.1496). At the same time, the movements of the last 24 hours cannot be fully evaluated. Traders were clearly in a state of excessive excitement, which may continue throughout the day. Thus, it is better to use an hourly chart for trading the pair, where you can track changes as quickly as possible. EUR/USD – Daily. 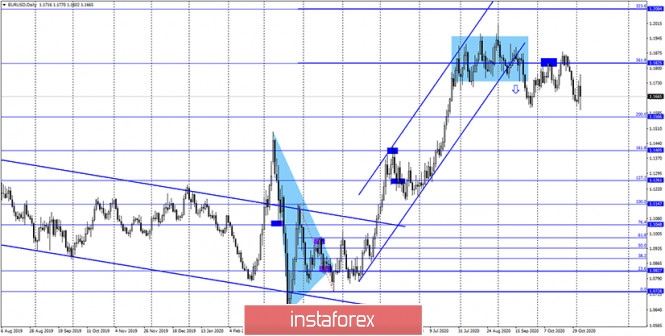
On the daily chart, the quotes of the EUR/USD pair performed a new rebound from the corrective level of 261.8% (1.1825), after which the quotes began and continue to fall in the direction of the Fibo level of 200.0% (1.1566). Closing the pair's rate below this level will increase the chances of a further fall towards the level of 161.8% (1.1405). EUR/USD – Weekly. 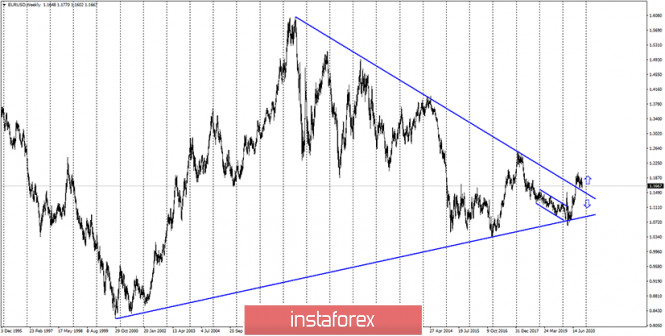
On the weekly chart, the EUR/USD pair performed a consolidation above the "narrowing triangle", which preserves the prospects for further growth of the pair, but in the long term. In the short term, a drop is preferable. Overview of fundamentals: On November 3, the European Union and America did not have a single economic report or other events. All the attention of traders was focused exclusively on the elections in America. News calendar for the United States and the European Union: EU - index of business activity in the service sector (09:00 GMT). US - change in the number of employees from ADP (13:15 GMT). US - composite ISM index for the non-manufacturing sector (15:00 GMT). On November 4, vote counting will continue in the United States, and quite important ADP and ISM reports will be released. In the European Union, an insignificant index of business activity in the service sector will be released today. COT (Commitments of Traders) report: 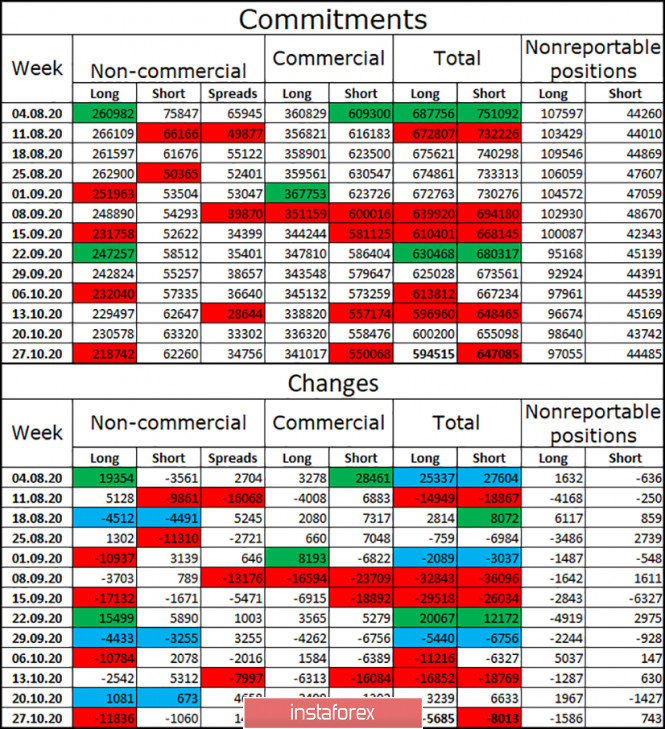
The latest COT report was quite informative. The most important category of non-commercial traders got rid of 12 thousand long contracts and 1 thousand short contracts during the reporting week. Thus, speculators do not believe in the further growth of the European currency and get rid of more purchases of this currency. This process, I must say, has been going on for several weeks, so a trend is emerging. Over the past two months, the total number of long contracts in the hands of speculators has been steadily falling, while the number of short contracts has been growing slightly. Thus, I am inclined to the option with a further fall in the euro currency quotes. Forecast for EUR/USD and recommendations to traders: Today, I recommend opening new sales of the euro currency with a target of 1.1612, if the rebound from the Fibo level of 76.4% (1.1676) is completed. Purchases of the pair will be possible with targets of 1.1715 and 1.1746 if the quotes consolidate above the level of 76.4% on the hourly chart. Traders' activity may remain high today. Terms: "Non-commercial" - major market players: banks, hedge funds, investment funds, private, large investors. "Commercial" - commercial enterprises, firms, banks, corporations, companies that buy currency not for speculative profit, but for current activities or export-import operations. "Non-reportable positions" - small traders who do not have a significant impact on the price. Trading idea for the USD/JPY pair 2020-11-04  The last forecast Following November 3 , the yen went down the market, in the direction of the target price level, which is 104. 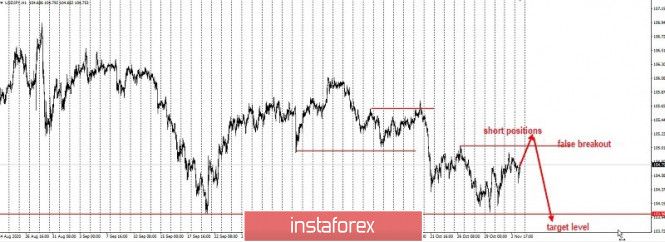 In fact, the pair managed to falsely break the upper limit of its price channel, right after the overnight moves related to the preliminary results of the US elections. 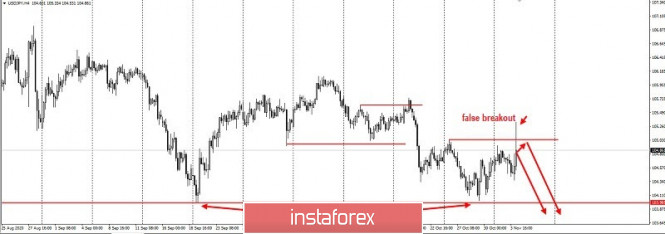 Therefore, today, the next step is to continue the short positions, all according to the plan presented above. As mentioned earlier, the target quote is 104. Cancel the transaction if the pair breaks out of 105.3. This technique uses Price Action and Stop Hunting methods. Good luck!
Author's today's articles: Stanislav Polyanskiy  Graduated from Odessa State Economic University. On Forex since 2006. Writes analytical reviews about international financial markets for more than 3 years. Worked as a currency analyst in different finance companies for a long time including the biggest companies of Russia and Ukraine. Graduated from Odessa State Economic University. On Forex since 2006. Writes analytical reviews about international financial markets for more than 3 years. Worked as a currency analyst in different finance companies for a long time including the biggest companies of Russia and Ukraine. Maxim Magdalinin  In 2005 graduated from the Academy of the Ministry of Internal Affairs of the Republic of Belarus, law faculty. Worked as a lawyer for three years in one of the biggest country's company. Besides the trading, he develops trading systems, writes articles and analytical reviews. Works at stock and commodity markets explorations. On Forex since 2006. In 2005 graduated from the Academy of the Ministry of Internal Affairs of the Republic of Belarus, law faculty. Worked as a lawyer for three years in one of the biggest country's company. Besides the trading, he develops trading systems, writes articles and analytical reviews. Works at stock and commodity markets explorations. On Forex since 2006. Sergey Belyaev  Born December 1, 1955. In 1993 graduated from Air Force Engineering Academy. In September 1999 started to study Forex markets. Since 2002 has been reading lectures on the technical analysis . Is fond of research work. Created a personal trading system based on the indicator analysis. Authored the book on technical analysis "Calculation of the next candlestick". At present the next book is being prepared for publishing "Indicator Analysis of Forex Market. Trading System Encyclopedia". Has created eleven courses on indicator analysis. Uses classical indicators. Works as a public lecturer. Held numerous seminars and workshops presented at international exhibitions of financial markets industry. Is known as one of the best specialists in the Russian Federation researching indicator analysis. Born December 1, 1955. In 1993 graduated from Air Force Engineering Academy. In September 1999 started to study Forex markets. Since 2002 has been reading lectures on the technical analysis . Is fond of research work. Created a personal trading system based on the indicator analysis. Authored the book on technical analysis "Calculation of the next candlestick". At present the next book is being prepared for publishing "Indicator Analysis of Forex Market. Trading System Encyclopedia". Has created eleven courses on indicator analysis. Uses classical indicators. Works as a public lecturer. Held numerous seminars and workshops presented at international exhibitions of financial markets industry. Is known as one of the best specialists in the Russian Federation researching indicator analysis. Vyacheslav Ognev  Vyacheslav was born on August 24, 1971. In 1993, he graduated from Urals State University of Economics in the Russian city of Ekaterinburg holding a degree in Commerce and Economics of Trade. In 2007, he started concentrating on the Russian stock market, trading stocks on the RTS Stock Exchange and futures contracts on FORTS. Since 2008 he has been engaged in analyzing Forex market and trading currencies. He is an author of a simplified wave analysis method. He has also developed a trading strategy. At present, Vyacheslav is a co-author of training materials on two web portals dedicated to Forex trading education. Interests: fitness, F1 "Experience is the best of schoolmasters, only the school fees are heavy." - Thomas Carlyle Vyacheslav was born on August 24, 1971. In 1993, he graduated from Urals State University of Economics in the Russian city of Ekaterinburg holding a degree in Commerce and Economics of Trade. In 2007, he started concentrating on the Russian stock market, trading stocks on the RTS Stock Exchange and futures contracts on FORTS. Since 2008 he has been engaged in analyzing Forex market and trading currencies. He is an author of a simplified wave analysis method. He has also developed a trading strategy. At present, Vyacheslav is a co-author of training materials on two web portals dedicated to Forex trading education. Interests: fitness, F1 "Experience is the best of schoolmasters, only the school fees are heavy." - Thomas Carlyle Mihail Makarov  - - Sebastian Seliga  Sebastian Seliga was born on 13th Oсtober 1978 in Poland. He graduated in 2005 with MA in Social Psychology. He has worked for leading financial companies in Poland where he actively traded on NYSE, AMEX and NASDAQ exchanges. Sebastian started Forex trading in 2009 and mastered Elliott Wave Principle approach to the markets by developing and implementing his own trading strategies of Forex analysis. Since 2012, he has been writing analitical reviews based on EWP for blogs and for Forex websites and forums. He has developed several on-line projects devoted to Forex trading and investments. He is interested in slow cooking, stand-up comedy, guitar playing, reading and swimming. "Every battle is won before it is ever fought", Sun Tzu Sebastian Seliga was born on 13th Oсtober 1978 in Poland. He graduated in 2005 with MA in Social Psychology. He has worked for leading financial companies in Poland where he actively traded on NYSE, AMEX and NASDAQ exchanges. Sebastian started Forex trading in 2009 and mastered Elliott Wave Principle approach to the markets by developing and implementing his own trading strategies of Forex analysis. Since 2012, he has been writing analitical reviews based on EWP for blogs and for Forex websites and forums. He has developed several on-line projects devoted to Forex trading and investments. He is interested in slow cooking, stand-up comedy, guitar playing, reading and swimming. "Every battle is won before it is ever fought", Sun Tzu Andrey Shevchenko  Andrey Shevchenko Andrey Shevchenko Grigory Sokolov  Born 1 January, 1986. In 2008 graduated from Kiev Institute of Business and Technology with "Finance and Credit" as a major. Since 2008 has studied the behavior of various currency pairs and their correlation on Forex. In his works and trading practice he uses candlestick analysis and Fibonacci technique. Since 2009 has written analytical reviews and articles which are published on popular Internet resources. Interests: music, computers and cookery. "Out of five deadly sins of business and as a rule, the most widespread, excessive striving to get profit is the worst". P. Drucker Born 1 January, 1986. In 2008 graduated from Kiev Institute of Business and Technology with "Finance and Credit" as a major. Since 2008 has studied the behavior of various currency pairs and their correlation on Forex. In his works and trading practice he uses candlestick analysis and Fibonacci technique. Since 2009 has written analytical reviews and articles which are published on popular Internet resources. Interests: music, computers and cookery. "Out of five deadly sins of business and as a rule, the most widespread, excessive striving to get profit is the worst". P. Drucker
Subscription's options management Theme's:
Fundamental analysis, Fractal analysis, Wave analysis, Technical analysis, Stock Markets
Author's :
A Zotova, Aleksey Almazov, Alexander Dneprovskiy, Alexandr Davidov, Alexandros Yfantis, Andrey Shevchenko, Arief Makmur, Dean Leo, Evgeny Klimov, Fedor Pavlov, Grigory Sokolov, I Belozerov, Igor Kovalyov, Irina Manzenko, Ivan Aleksandrov, l Kolesnikova, Maxim Magdalinin, Mihail Makarov, Mohamed Samy, Mourad El Keddani, Oleg Khmelevskiy, Oscar Ton, Pavel Vlasov, Petar Jacimovic, R Agafonov, S Doronina, Sebastian Seliga, Sergey Belyaev, Sergey Mityukov, Stanislav Polyanskiy, T Strelkova, Torben Melsted, V Isakov, Viktor Vasilevsky, Vladislav Tukhmenev, Vyacheslav Ognev, Yuriy Zaycev, Zhizhko Nadezhda
Edit data of subscription settings
Unsubscribe from the mailing list Sincerely,
Analysts Service | If you have any questions, you can make a phone call using one of the
InstaForex Toll free numbers right now:
|  | InstaForex Group is an international brand providing online trading services to the clients all over the world. InstaForex Group members include regulated companies in Europe, Russia and British Virgin Islands. This letter may contain personal information for access to your InstaForex trading account, so for the purpose of safety it is recommended to delete this data from the history. If you have received this letter by mistake, please contact InstaForex Customer Relations Department. |


No comments:
Post a Comment