| Indicator Analysis. Daily review for the EUR/USD currency pair 11/23/20 2020-11-23 Last Friday, the pair had an unsuccessful attempt to overcome the resistance line at 1.1879 (white thick line), and it went down testing almost the retracement level of 23.6% at 1.1844 (red dotted line). Today the price may continue to move up according to an economic calendar news, it is expected at 8.30 UTC (euro). Trend analysis (Fig. 1). Today, the market may continue to move upward from the level of 1.1855 (closing of the Friday's daily candle) with the first upper target of 85.4% retracement level at 1.1894 (blue dotted line). In case of testing this line, we are waiting for the continuation of the upper work with the target at 1.1920 - the upper fractal (daily candle from 09/11/2020). 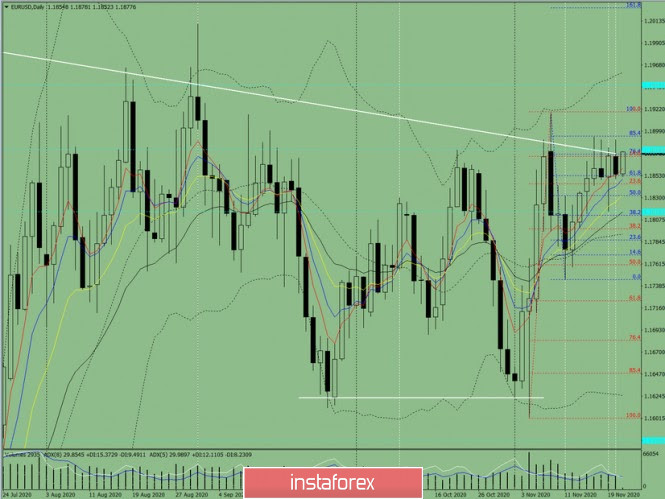 Figure: 1 (daily chart). Comprehensive Analysis: - Indicator Analysis - up
- Fibonacci levels - up
- Volumes - up
- Candlestick Analysis - down
- Trend Analysis - down
- Bollinger Lines - up
- Weekly Chart - up
General Conclusion: Today, the price may move upward with the target of 85.4% retracement level at 1.1894 (blue dotted line). In case of testing this line, we are waiting for the continuation of the upper work with the target at 1.1920 - the upper fractal (daily candle from 09/11/2020). Alternative scenario: from the level of 1.1835 (close of Friday's daily candle) there will be a work going upward in order to reach the resistance line at 1.1877 (white thick line). In case of testing this line, there will be a work going down with the target at 1.1844 - the lower retracement level of 23.6% (red dotted line). Analytics and trading signals for beginners. How to trade EUR/USD on November 23? Plan for opening and closing trades on Monday 2020-11-23 Hourly chart of the EUR/USD pair 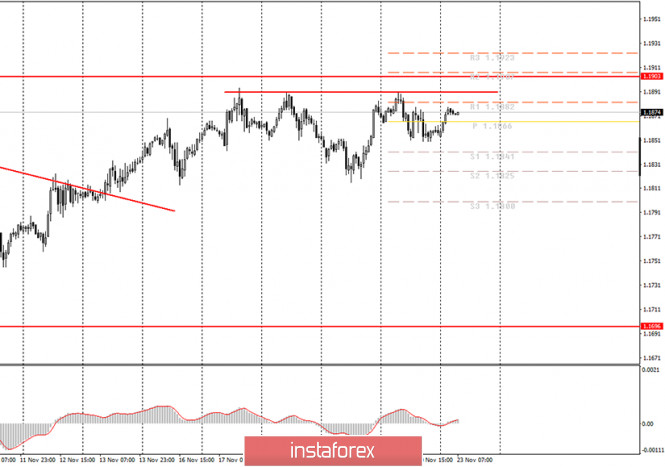
The EUR/USD pair began a new round of corrective movement. Take note that we only consider the current downward trend because the price reached the area of the upper line of the horizontal channel at 1.1700-1.1900. Therefore, we expect a downward reversal and the euro's quotes to fall to the lower border of the channel. But in general, the pair remains in a long-term flat, and we are looking for trends only within the horizontal channel. Thus, in the current conditions, we still need to wait for a new sell signal from MACD, which will allow us to open new short positions. At the same time, the pair went into a weaker flat last week, between the levels of 1.1816 and 1.1890. The quotes have been in this range for more than a week. Therefore, the technical picture of the euro/dollar pair is becoming more and more unattractive for trading. Nevertheless, novice traders can count on the pair to fall by 50-60 points. If, by some miracle, the price settles above the 1.1903 level, then this will provide a lot of help in forming a new upward trend. The European Union will publish business activity indices in the services and manufacturing sectors on Monday, November 23. The service sector is expected to be hit hard by the second wave of coronavirus, as well as the lockdown. Business activity is expected to drop to 42.5. This is a deterioration that may negatively affect GDP in the future - the most important indicator of the state of any economy. Therefore, the euro might be under pressure in the first half of the day. And will stay under it in the afternoon, because US PMIs are not forecast to decline. A second lockdown was not introduced in the United States, limiting itself only to targeted strengthening of quarantines in various states. Therefore, business activity remains normal. The epidemiological and political situation in the United States remains abnormal. Recall that Donald Trump continues to bombard the courts of all states in which he lost elections, and America remains in first place in the world in terms of the number of coronavirus diseases and deaths from it. However, market participants are no longer interested in these topics. They were hardly interested in it for the last week. Thus, most likely, the pair's volatility will remain rather weak today, and the price will remain within the double horizontal channel. Possible scenarios for November 23: 1) Long positions are currently irrelevant. It will no longer be possible to go back to buying the euro before the end of the current downward trend. Under the current conditions, the only option is to overcome the 1.1903 level, which means the pair will leave the 1.1700-1.1900 horizontal channel. In this case, you are advised to open long positions with targets at 1.1923 and 1.1950. 2) Trading for a fall at this time is relevant, since the trend has changed to a downward one. The next round of the upward correction may end in the coming hours, so novice traders can track the MACD sell signal and start trading down with targets at 1.1841 and 1.1825. Given the minimal volatility, we do not expect strong movements on Monday. On the chart: Support and Resistance Levels are the Levels that serve as targets when buying or selling the pair. You can place Take Profit near these levels. Red lines are the channels or trend lines that display the current trend and show in which direction it is better to trade now. Up/down arrows show where you should sell or buy after reaching or breaking through particular levels. The MACD indicator (14,22,3) consists of a histogram and a signal line. When they cross, this is a signal to enter the market. It is recommended to use this indicator in combination with trend lines (channels and trend lines). Important announcements and economic reports that you can always find in the news calendar can seriously influence the trajectory of a currency pair. Therefore, at the time of their release, we recommended trading as carefully as possible or exit the market in order to avoid a sharp price reversal. Beginners on Forex should remember that not every single trade has to be profitable. The development of a clear strategy and money management are the key to success in trading over a long period of time. Technical Analysis of EUR/USD for November 23, 2020 2020-11-23 Technical Market Outlook: The EUR/USD pair keeps trading in a narrow zone located between the level of 1.1822 - 1.1880, but the bulls are pushing higher every time the market makes a pull-back. The next target for bulls is seen at the level of 1.1920 (swing high) and then at 1.1965. The nearest technical support is located at 1.1813, 1.1803 and 1.1789. The strong and positive momentum supports the short-term bullish outlook. Weekly Pivot Points: WR3 - 1.1973 WR2 - 1.1933 WR1 - 1.1892 Weekly Pivot - 1.1854 WS1 - 1.1815 WS2 - 1.1774 WS3 - 1.1735 Trading Recommendations: Since the middle of March 2020 the main trend is on EUR/USD pair has been up, which can be confirmed by almost 10 weekly up candles on the weekly time frame chart and 4 monthly up candles on the monthly time frame chart. The recent correction towards the level of 1.1612 seems to be completed and now market is ready for another wave up. This means any local corrections should be used to buy the dips until the key technical support is broken. The key long-term technical support is seen at the level of 1.1445. The key long-term technical resistance is seen at the level of 1.2555. 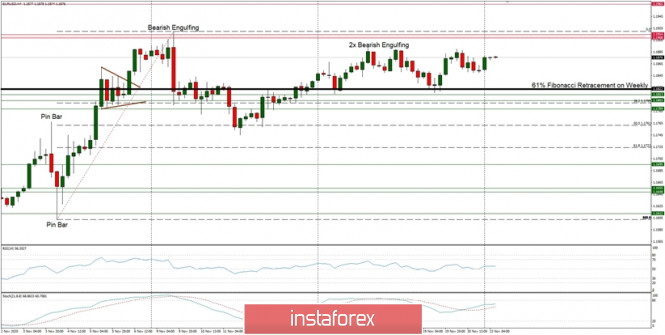
Indicator analysis. Daily review on the GBP/USD currency pair for November 23, 2020 2020-11-23 Trend analysis (Fig. 1). Today, the market may continue to move upward from the level of 1.3280 (closing of last Friday's daily candlestick) with the target of 1.3322 - the resistance line (white bold line). When testing this line, upward movement should be continued with the goal of 1.3436 – the target level of 161.8% (blue dotted line). 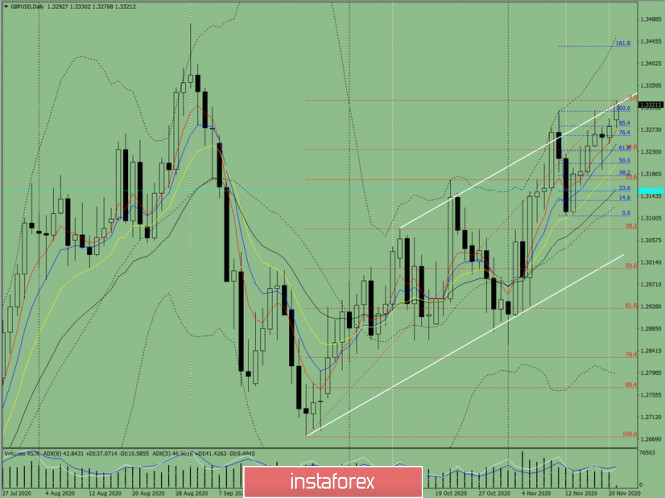
Figure 1 (Daily chart). Comprehensive analysis: - Indicator analysis - up;
- Fibonacci levels - up;
- Volumes - up;
- Candlestick analysis - down;
- Trend analysis - up;
- Bollinger bands - up;
- Weekly chart - up.
General conclusion: Today, the price may continue to move upward with the target of 1.3322 - the resistance line (white bold line). When testing this line, upward movement should be continued with the goal of 1.3436 – the target level of 161.8% (blue dotted line). Alternative scenario: from the level of 1.3280 (closing of last Friday's daily candlestick), the price may continue to move up with the target of 1.3322 - the resistance line (white bold line). When testing this line, work downward with the goal of 1.3234 - a 14.6% pullback level (red dotted line). Technical Analysis of GBP/USD for November 23, 2020 2020-11-23 Technical Market Outlook: The GPB/USD pair keeps trading in the ascending channel and the bulls are pushing higher every time the market makes a pull-back. At the beginning of the new week bulls made a new high at the level of 1.3330 (at the time of writing the article) and keep pushing. The next target for bulls is seen at the level of 1.3447(swing high) and then at 1.3512. The nearest technical support is located at 1.3306, 1.3295 and 1.3264. The strong and positive momentum supports the short-term bullish outlook. Weekly Pivot Points: WR3 - 1.3491 WR2 - 1.3401 WR1 - 1.3359 Weekly Pivot - 1.3256 WS1 - 1.3209 WS2 - 1.3108 WS3 - 1.3061 Trading Recommendations: The GBP/USD pair is in the down trend on the monthly time frame, but the recent bounce from the low at 1.1411 made in the middle of March 2020 looks very strong and might be a reversal swing. In order to confirm the trend change, the bulls have to break through the technical resistance seen at the level of 1.3518. All the local corrections should be used to enter a buy orders as long as the level of 1.2674 is not broken. 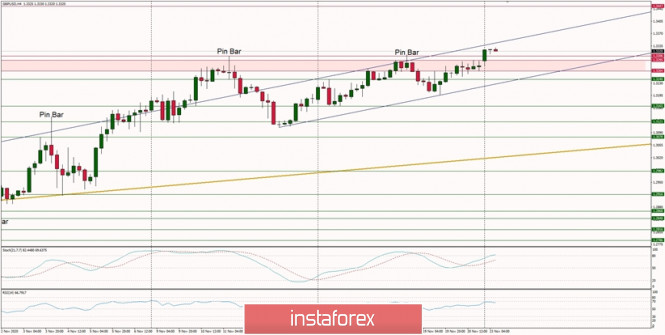
EUR/USD. COVID-19 and EU budget are in focus 2020-11-23 The US dollar index continues to hold at multi-week lows at the bottom of the 0.92 level. The overall situation in the currency market remained unchanged at the end of the weekend. The key dollar pairs began to trade in almost the same positions where they were last Friday. However, the pound/dollar pair is an exception, which surged to the 33rd figure. The fact is that on Saturday, the UK and Canada reached an agreement on maintaining continuity in trade relations. The countries decided not to change the rules, keeping the flow of goods and services worth $ 27 billion. This fact has supported the pound, although key negotiations between London and Brussels are still unclear. In turn, the euro-dollar pair has no significant changes. Traders continue to push within the area of the 0.18 level. TThe price has been alternately pushing back from the boundaries of the range for a week and a half, which narrowed to 1.1830-1.1890 by Friday. Neither bears nor bulls of EUR/USD managed to exit the range, although the corresponding attempts are made daily. In the end, the pair is marking time, amid contradictory fundamental outlook. Technically, the US currency is still under pressure from coronavirus anti-records, political uncertainty (especially regarding the prospects for a new stimulus package), the Fed's "dovish" rhetoric, and weak macroeconomic reports (US retail sales and inflation). 
The euro, on the other hand, is also affected negatively by COVID-19, albeit minimum. The European lockdowns are starting to turn out well. For example, the number of new cases of COVID-19 in France, which became the epicenter of the second wave of pandemic in Europe, has declined over the past 10 days and lowered the positive test results. According to the head of the French Ministry of Health, the situation was brought under control, and the peak of the second wave has already passed. The similar dynamics is observed in other EU countries. Therefore, the main problem of the euro lies elsewhere now. It should be recalled that Hungary and Poland vetoed the adoption of the draft EU budget because of the new rules for the distribution of funds. This year, Brussels included in the document the obligation to observe the principles of the rule of law for the first time, and this fact alarmed the Hungarians and Poles. Human rights organizations regularly voice complaints against these countries: Hungary is criticized for a tough anti-immigration policy, while Poland for judicial reform and attempts to control the media. In view of such accusations, the countries may lose tens of billions of euros from EU funds, so they vetoed the budget adoption process, demanding to exclude the above principle. Unfortunately, the initial negotiations did not lead to anything. However, Slovenia supported Budapest and Warsaw, whose prime minister is a longtime ally of Viktor Orban, especially in the field of migration policy. For now, we can say that the situation has reached an impasse. Therefore, the current growth of the EUR/USD pair is due only to the weakness of the US dollar, which is losing its positions throughout the market. The United States remains the focus of COVID-19 – if the daily increase in the number of cases did not fall below the 100-thousandth mark at the beginning of November, then last week, it did not fall below the 150-thousandth target. Recently, it has not dropped below the 170,000 mark. The news that vaccinations in the US could begin as early as December did not help the dollar. So, nothing will change in the medium term (at least until January-February), while the market is not used to assessing the situation of long-term prospects. Therefore, the US dollar index did not change its course during today's Asian session. It is gradually declining, due to the market's skeptical attitude towards the US currency. This week's economic calendar for the EUR/USD pair does not contain many important releases, which are as follows: - Monday, Nov 23 - PMI indices of key European countries
- Tuesday, Nov 24 - US consumer confidence
- Wednesday, Nov 25 - Personal consumption, expenditure index and the Fed's minutes of the last meeting.
- Thursday, Nov 26 - US Thanksgiving
- Friday, Nov 27 - None
Therefore, all investors' attention will be focused on the "main" topics: COVID-19, EU budget, a new aid package for the US economy and Brexit negotiations. In my opinion, the priority for the EUR/USD pair remains with long positions. Firstly, the results of European lockdowns will be more clearly visible at the end of November: the curve of COVID-19 will likely to slowly decline. Second, the problem of blocking the EU budget is likely to be solved – in one form or another. If negotiations with representatives of Hungary and Poland finally reach an impasse, the EU may use alternative mechanisms. In particular, Brussels proposes to approve the parts that make up the budget through alternative channels that do not allow a veto by one of the countries. The European Union is also considering launching an economic recovery fund based on article 122 of the EU Treaty, which allows providing financial assistance to member States in emergency situations. There are other mechanisms for bypassing the block. Given this fact, we can conclude that Budapest and Warsaw will be more compliant, or Brussels will actually implement alternative scenarios. 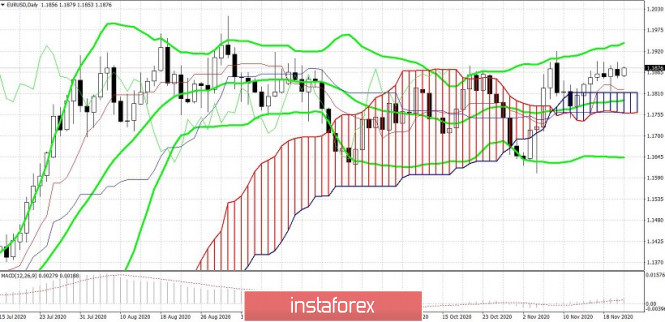
From the point of view of technical analysis, long positions are of priority. The price on the daily chart is between the middle and upper lines of the Bollinger Bands indicator, as well as above all the lines of the Ichimoku indicator (including the Kumo cloud). All this suggests that the pair can be considered longs with the first goal at 1.1940 (upper line of the Bollinger Bands in the same time frame). Technical analysis of GBP/USD for November 23, 2020 2020-11-23 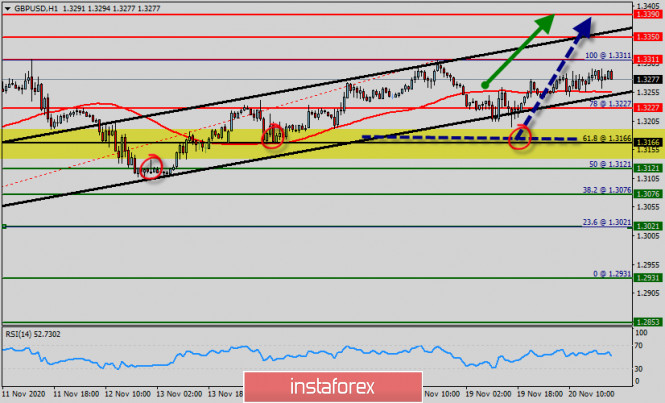 Overview : The market opened above the weekly pivot point (1.3166). Last week, the trend continued to move downwards from the level of 1.3166 to the top around 1.3311. The GBP/USD pair is currently trying to settle above the support at 1.3166 as the U.S. dollar continues to lose ground against a broad basket of currencies. The Moving Average 50 formed a perfect support against the GBP/USD pair, to push trades to rise and attempt to regain the bullish trend. The minor support and major support levels are set at the prices of 1.3227 and 1.3166 respectively. This would suggest a bullish market because the moving average (50) is still in a negative area and does not show any signs of a trend reversal at the moment. The price also jumped above the 50-period simple moving averages (SMAs) and the RSI, signaling some more buying interest. The RSI gains its positive momentum clearly, which forms positive factor that might press on the price to rise again. Today, the first resistance level is seen at 1.3311 followed by 1.3350 and 1.3390, while daily support 1 is seen at 1.3166. The GBP/USD pair broke resistance which turned to strong support at 1.3277. Right now, the pair is trading above this level. It is likely to trade in a higher range as long as it remains above the support level of 1.3166 which is expected to act as major support today. Amid the previous events, the GBP/USD pair is still moving between the levels of 1.3166 and 1.3390, so we expect a range of 22.4 pips in coming days. Therefore, the major support can be found at 1.3166 providing a clear signal to buy with a target seen at 1.3311. If we do break above the 1.3227 handle, then it is likely that the market goes looking towards the 1.3311 handle after that. The 1.3311 handle after that is a large - the price of 1.3311 represents the double top on the H1 chart. Therefore, we will continue to suggest the bullish trend for the upcoming period unless the price rallied to breach 1.3350 and hold above it, reminding you that our first positive target is located at the 1.3390 level. In case the GBP/USD pair manages to settle above this level, it will gain additional upside momentum and head towards the next resistance at 1.3311. A successful test of the resistance at 1.3311 will push the GBP/USD pair towards the next resistance level at 1.3350. This move may be fast since there are no important levels between 1.3227 and 1.3390. On the support side, the nearest support level for GBP/USD pair is located at 1.3166. If GBP/USD pair declines below this level, it will head towards the next support level at 1.3121. In case GBP/USD pair moves below the support at 1.3121, it will get to the test of the next support level which is located at the 50 EMA at 1.3021. - The expected trend for today : bullish market as long as the trend is still set above the 1.3166 price. Trading recommendations: According to the previous events of GBP/USD pair has still called for a strong bullish market since two weeks. Therefore, it will be advantageous to buy above 1.3166 with a first target 1.3311 in order to test the double top. if the price is able to break 1.3311, it may resume to 1.3350. we can expect explosive breakout and it is likely that the market is going to start showing the signs of bullish market towards the third target at 1.3390. On the other hand, stop loss should always be in account, consequently, it will be of wholesome to set the stop loss below the support 1 at the price of 1.3166. Technical analysis of AUD/USD for November 23, 2020 2020-11-23 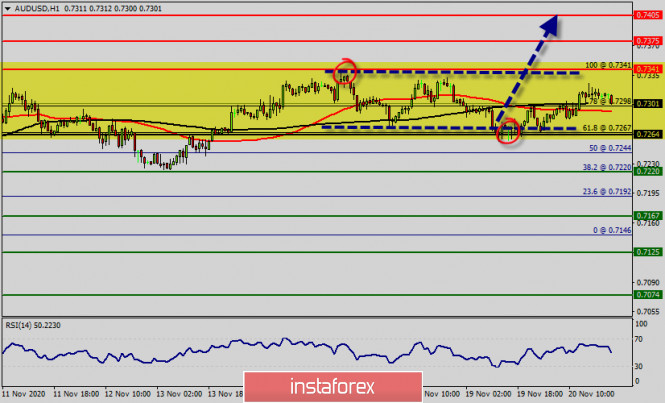 Overview : On the H1 chart : A trend in the AUD/USD pair was argumentative as it was trading in a narrow sideways channel, the market showed signs of instability. Amid the previous events, the price is still moving between the levels of 0.7264 and 0.7341. The Aussie closed up at the price of 0.7310 against the US dollar last week. The AUD/USD pair rallied significantly during the week, reaching towards 0.7341 handle. At this point in time, it looks like we are running out of momentum. Last week, the AUD/USD pair fell from to top point of 0.7341 to the bottom of 0.7264 to rebound toward 0.7301 (close price) The market is likely to continue to be very sharp if we do pull back from here, but it surely looks as if we are running out of a lot of the momentum. Resistance and support are seen at the levels of 0.7341 (also, the double top is already set at the point of 0.7341) and 0.7264 respectively. As the current rebound is pushing the Aussie close to this level once again, price action is trading above the 0.7264 handle. As long as the 0.7264 level holds, the AUD/USD pair is likely to trade subdued. There is a risk of rising further up to the 0.7341 handle. Therefore, it is recommended to be cautious while placing orders in this area. So, we need to wait until the sideways channel has completed. The current price is seen at 0.7264 which represents a key level today. The hourly chart shows strong consolidation taking place as price whipsaws back and forth. As a result, there is currently no clear trend defined within the short term. Now, the price is set at 0.7264 to act as a daily pivot point. It should be noted that volatility is very high for that the AUD/USD pair is still moving between 0.7264 and 0.7341 in coming days. Furthermore, the price has set above the strong support at the levels of 0.7264 and 0.7244, which coincides with the 61.8% and 50% Fibonacci retracement level respectively. Additionally, the price is in a bullish channel now. Amid the previous events, the pair is still in a uptrend. From this point, the AUD/USD pair is continuing in a bullish trend from the new support levels of 0.7264 or/and 0.7244. Moreover, the RSI is becoming to signal an upward trend, as the trend is still showing strong above the moving average (100). Thus, the market is indicating a bullish opportunity above the area of 0.7264 and 0.7244. The price spot of 0.7264 and 0.7244remains a significant support zone. Hence, a possibility that the AUD/USD pair will have upnside momentum is rather convincing and the structure of a rise does not look corrective. In order to indicate a bearish opportunity above 0.7264 and 0.7244. If the pair fails to pass through the levels of 0.7264 and 0.7244, the market will indicate a bullish opportunity above the strong support levels of 0.7264 and 0.7244. In this regard, buy deals are recommended higher than the 0.7264 level with the first target at 0.7341. It is possible that the pair will turn upwards continuing the development of the bullish trend to the level 0.7264 . Consequently, buy above the level of 0.7264 with the first target at 0.7341 so as to test the daily resistance 1 and further to 0.7375. Besides, the level of 0.7405 is a good place to take profit. However, stop loss has always been in consideration thus it will be useful to set it below the last double bottom at the level of 0.7220 (last bearish wave). Technical analysis of EUR/USD for November 23, 2020 2020-11-23 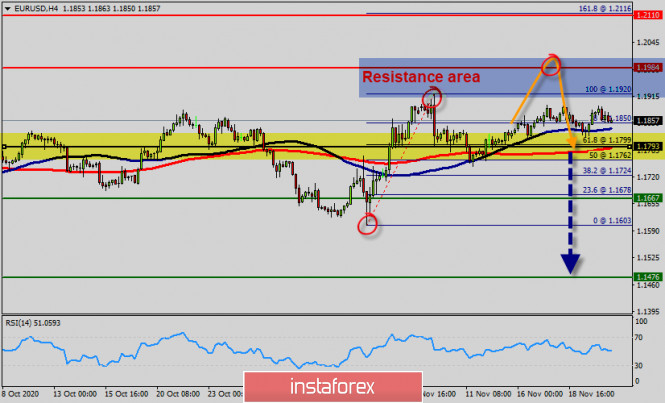 Overview : The EUR/USD pair has rallied slightly during the week but we still see a significant amount of resistance just below, as the 1.1920 level continues to loom large. The levels of 1.1920 and 1.1984 are representing the double top and the first weekly resistance respectively. The trend has set in consolidation below the area of 1.1984 - 1.1920 last week. Ultimately, this is a market that still sees a lot of resistance near 1.1920 level that extends to the 1.1984 level. This week, The EUR/USD pair is once again testing the resistance at 1.1920 while the U.S. dollar is moving lower against a broad basket of currencies. Initial bias remains neutral this week first. On the upside, break of 1.1920 will reaffirm the case that consolidation from 1.1920 has completed at 1.1984. Further rise would be seen to retest 1.1984 high. However, break of 1.1793 support will turn bias to the downside to extend the consolidation with another falling leg. Also, it shuld be noted that the Europe director of the World Health Organization (WHO) said last week there a small sign that the latest resurgence of Coronavirus 2019 (COVID-19) cases in the region is slowing but still warned of "six tough months" ahead. More technically : On the H4 chart, the EUR/USD pair faced resistance at the level of 1.1984, while minor resistance is seen at 1.1920. Support is found at the levels of 1.1773 (pivot) and 1.1667. Aweekly daily pivot point has already set at the level of 1.1773. Equally important, the EUR/USD pair is still moving around the key level at 1.1793, which represents a daily pivot in the H4 time frame at the moment. Last week, the EUR/USD pair continued to move upwards from the level of 1.1603. The pair rose from the level of 1.1603 (this level of 1.1603 coincides with the double bottom) to the top around 1.1920 - closed at 1.1857. Amid the previous events, the price is still moving between the levels of 1.1920 and 1.1773. In overall, we still prefer the bearish scenario as long as the price is below the level of 1.1920. The moving average (100) and (50) starts signaling a downward trend; consequently, the market is indicating a bearish opportunity below 1.1920. So it will be good to sell at 1.1920 today. If the pair fails to pass through the level of 1.1920, the market will indicate a bearish opportunity below the level of 1.1920. So, the market will decline further to 1.1773 in order to return to the weekly pivot point (0.6604). Moreover, a breakout of that target will move the pair further downwards to 1.1603. The level of 1.1603 will form a double bottom. Furthermore, the price will fall into a bearish trend in order to go further towards the strong support at 1.1467 to test it again. On the other hand, if the price closes above the strong resistance of 1.1920, the best location for a stop loss order is seen above 1.2110. Comprehensive, we still prefer the bearish scenario which suggests that the pair will stay below the zone of 1.1920/1.1984 this week. Weekly key levels - Major resistance : 1.2110
- Minor resistance : 1.1984
- Pivot point : 1.1793
- Minor support : 1.1667
- Major support : 1.1476
Simplified wave analysis and forecast for EUR/USD, AUD/USD, and GBP/JPY on November 23 2020-11-23 EUR/USD Analysis: The last wave of the European currency that is not completed today is rising, from November 4. A correction is formed in its structure for the entire current month. It looks like a horizontal pennant with the last section missing. After its complete completion, the upward trend will continue. Forecast: On the current day, the pair's price is expected to move in the corridor between the nearest zones. After the probable pressure on the resistance zone, you should expect a reversal and a price decline. A break below the calculated support is unlikely today. Potential reversal zones Resistance: - 1.1890/1.1920 Support: - 1.1830/1.1800 Recommendations: Euro trading today is only possible in individual trading sessions, with a reduced lot. The pair's sales are more promising. 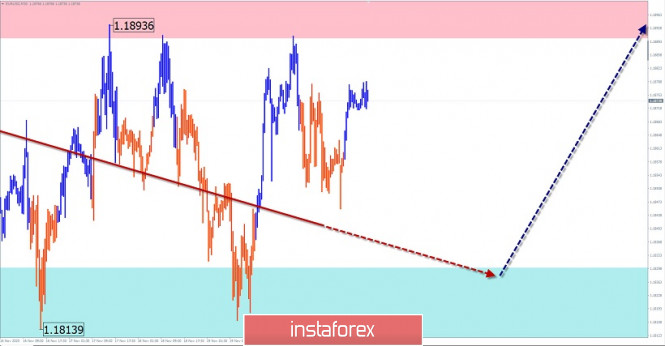
AUD/USD Analysis: The direction of price movements of the Australian dollar is set by the rising wave algorithm from September 25. Its structure has a clear sequence (A-B-C). In the last part, a pullback has been developing in the last 3 weeks from a strong resistance zone in the horizontal plane. Forecast: The range of the price corridor today is limited by the calculated counter zones. In the next session, an attempt to put pressure on the resistance zone is likely. By the end of the day, you can expect a change of course and a decline in the support area. Potential reversal zones Resistance: - 0.7330/0.7360 Support: - 0.7270/0.7240 Recommendations: Selling with a reduced lot is possible on the "Aussie" market today. It is most safe to refrain from entering the pair's market until the entire correction is completed, followed by entering long positions. 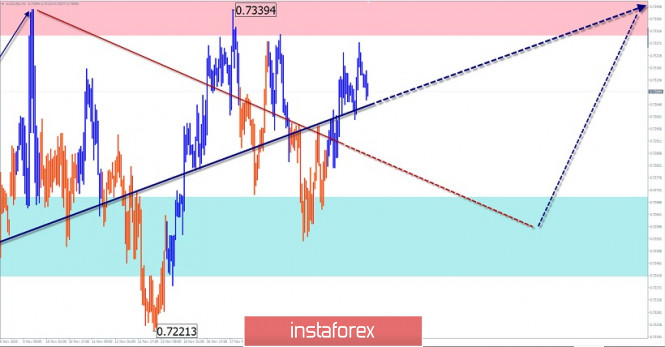
GBP/JPY Analysis: A downward wave has been forming on the chart of the pound's cross against the yen since November 9. It gives rise to a new section of the dominant trend in recent years. A flat correction has been forming in the wave structure since November 13. The price has reached the preliminary target zone, but the correction structure is not complete. Forecast: Today, the general flat mood of the movement is expected, mainly with an upward vector. The expected limits of the daily range show the estimated counter zones. At the end of the day, a change in the exchange rate and a second decline are not excluded. Potential reversal zones Resistance: - 138.80/139.10 Support: - 137.90/137.60 Recommendations: Purchases of the pair today can be risky. It is safer to wait for reversal signals and enter short positions. 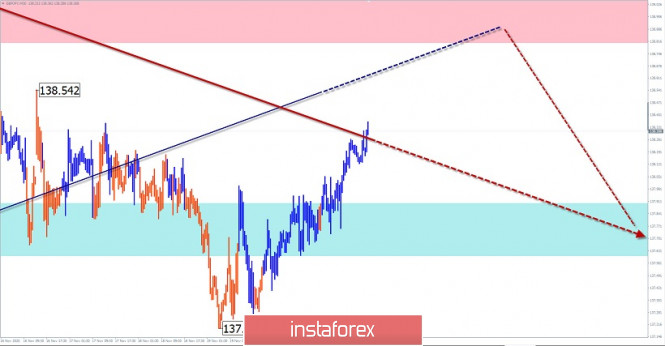
Explanation: In the simplified wave analysis (UVA), waves consist of 3 parts (A-B-C). The last incomplete wave is analyzed. The solid background of the arrows shows the formed structure, and the dotted background shows the expected movements. Note: The wave algorithm does not take into account the duration of the instrument's movements in time! EUR/USD: plan for the European session on November 23. COT reports. Traders await PMI data 2020-11-23 To open long positions on EUR/USD, you need: Like last Friday afternoon, it was not possible to wait for some kind of signal to enter the market, since trading was mainly carried out in the middle of the horizontal channel. Volatility remained fairly low due to the lack of important fundamentals and progress in negotiations between the UK and the EU. 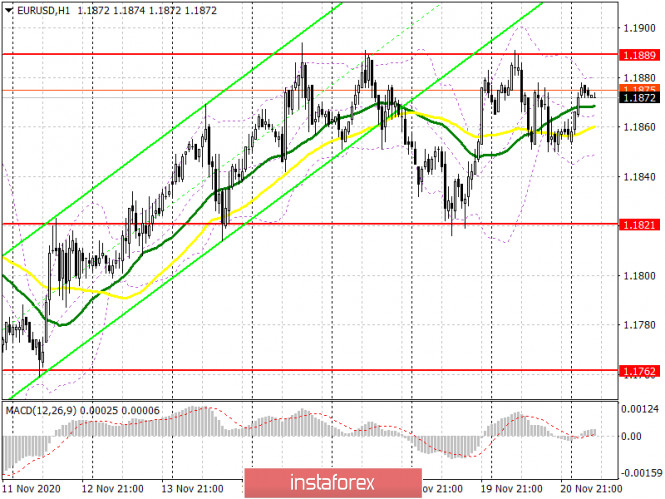
Buyers will entirely be focused on the 1.1889 level, which appeared last Friday. A breakout and getting the pair to settle above this level forms a good signal to open long positions in order to continue the upward trend, which will be directed to new highs in the 1.1953 area, where I recommend taking profits. The next area will be the resistance of 1.2008, but it will be achievable only if there are more than good data on PMI indices for the eurozone countries, although I would not recommend counting on them. If the euro is under pressure in the first half of the day, and the service sector demonstrates a larger slowdown in November, then it is best to refuse buying, counting on the pair's fall to the lower border of the 1.1821 horizontal channel. The initial test of this level will lead to an upward correction of 15-20 points within the day. To open short positions on EUR/USD, you need: The bears are facing a new challenge to protect resistance at 1.1889. However, forming a false breakout at this level will be a signal to open short positions with the expectation of a decline to the lower border of the horizontal channel at 1.1821, where I recommend taking profits. This signal will be realized in case we receive weak PMI indices for the eurozone countries. In case of a breakout and consolidation scenario below 1.1821, one can expect the pair to fall to the support of 1.1762, which will form a new downward trend for the pair. If bears are not active at the 1.1889 level in the first half of the day, I recommend refusing to sell until the 1.1953 high has been updated, where you can open short positions immediately on a rebound, counting on a downward correction of 15-20 points within the day. The Commitment of Traders (COT) report for November 10 showed a reduction in long and short positions. Euro bulls are holding on to a wait-and-see attitude and are in no hurry to return to the market even after the US presidential elections. Despite this, buyers of risky assets believe that the bull market will continue, although they prefer to proceed with caution. Thus, long non-commercial positions decreased from 208,237 to 202,374, while short non-commercial positions remained practically unchanged, falling from 67,888 to 67,087. The total non-commercial net position decreased to 135,287 against 140,349 a week earlier. It is worth noting that the delta has been declining for seven consecutive weeks, which confirms the buyers' lack of desire to enter the market in the current conditions. Growth will only begin after Joe Biden's victory and once his plan is implemented, as he intends to endow the American economy with the next largest monetary aid package worth more than $2 trillion. Indicator signals: Moving averages Trading is carried out just above 30 and 50 moving averages, which indicates the likelihood of further growth in the euro. Note: The period and prices of moving averages are considered by the author on the H1 hourly chart and differs from the general definition of the classic daily moving averages on the daily D1 chart. Bollinger Bands The volatility is very low, which does not provide signals to enter the market. Description of indicators - Moving average (moving average, determines the current trend by smoothing out volatility and noise). Period 50. It is marked in yellow on the chart.
- Moving average (moving average, determines the current trend by smoothing out volatility and noise). Period 30. It is marked in green on the chart.
- MACD indicator (Moving Average Convergence/Divergence — convergence/divergence of moving averages) Quick EMA period 12. Slow EMA period to 26. SMA period 9
- Bollinger Bands (Bollinger Bands). Period 20
- Non-commercial speculative traders, such as individual traders, hedge funds, and large institutions that use the futures market for speculative purposes and meet certain requirements.
- Long non-commercial positions represent the total long open position of non-commercial traders.
- Short non-commercial positions represent the total short open position of non-commercial traders.
- Total non-commercial net position is the difference between short and long positions of non-commercial traders.
GBP/USD: plan for the European session on November 23. COT reports. Pound making its way up 2020-11-23 To open long positions on GBP/USD, you need: We didn't wait for signals to enter the market last Friday, since trading was carried out in a narrow horizontal channel. There were no guidelines for entering the market due to the fact that not a single nearest level was tested throughout the day. The pound grew in today's Asian session amid rumors that a compromise was found on a number of important issues between the UK and the EU, which did not allow signing a trade agreement. 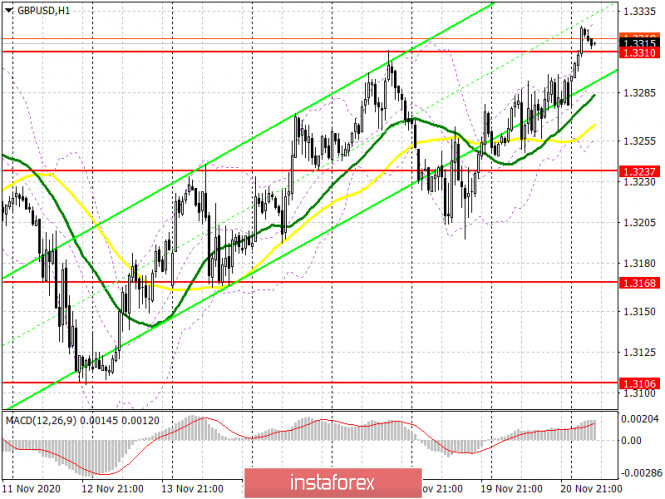
The bulls managed to take the 1.3310 level, and now their main task for the first half of the day is to protect this range. Falling to this level and a false breakout there will be a signal to open long positions in order to continue the upward trend while also hoping that the EU and the UK will come to an agreement. In this case, the nearest target for buyers will be resistance at 1.3378, where I recommend taking profit. The next target will be the high of 1.3467. Today's benchmark will be the data on PMI indices for the services and manufacturing sectors in the UK. In case we receive bad reports, the pair could fall below the 1.3310 level. In this case, there is no need to rush in opening long positions. It is best to wait until the 1.3237 support has been updated and buy the pound there, counting on a rebound of 20-30 points within the day. A larger level for opening long positions is seen around 1.3168. To open short positions on GBP/USD, you need: Bears need to regain control of the 1.3310 level. The easiest way to do this is after receiving weak data on the UK services sector. The decline in the PMI index is worse than expected and the initial value is likely to push GBP/USD under the 1.3310 level. Testing it from the bottom up forms a good signal to open short positions with the main goal of falling to support 1.3237, where I recommend taking profits. A more distant level will be the low of 1.3168. If the pound is in demand in the afternoon, then there is no need to rush to sell. I recommend waiting until a new high at 1.3378 has been tested and sell the pound there immediately on a rebound, counting on a correction of 20-25 points within the day. If bears are not active in this range, you can hold back from selling until the larger high of 1.3467 is renewed. And although the pound is growing on rumors that a number of compromises have been reached, the main problem with fishing has not been resolved. Therefore, at any moment the pair may begin to fall if it becomes clear that none of the parties is going to make concessions. The Commitment of Traders (COT) report for November 10 showed a slight increase in long positions and a sharp inflow of short positions. Long non-commercial positions rose from 27,701 to 27,872. At the same time, short non-commercial positions increased from 38,928 to 45,567. As a result, the negative non-commercial net position was -17,695, against -11,227 weeks earlier, which indicates that the sellers of the British pound retains control and also shows their minimal advantage in the current situation. Indicator signals: Moving averages Trading is carried out above 30 and 50 moving averages, which indicates the likelihood of the pound's succeeding growth. Note: The period and prices of moving averages are considered by the author on the H1 hourly chart and differs from the general definition of the classic daily moving averages on the daily D1 chart. Bollinger Bands In case the pair falls, support will be provided by the lower border of the indicator at 1.3245. Description of indicators - Moving average (moving average, determines the current trend by smoothing out volatility and noise). Period 50. It is marked in yellow on the chart.
- Moving average (moving average, determines the current trend by smoothing out volatility and noise). Period 30. It is marked in green on the chart.
- MACD indicator (Moving Average Convergence/Divergence — convergence/divergence of moving averages) Quick EMA period 12. Slow EMA period to 26. SMA period 9
- Bollinger Bands (Bollinger Bands). Period 20
- Non-commercial speculative traders, such as individual traders, hedge funds, and large institutions that use the futures market for speculative purposes and meet certain requirements.
- Long non-commercial positions represent the total long open position of non-commercial traders.
- Short non-commercial positions represent the total short open position of non-commercial traders.
- Total non-commercial net position is the difference between short and long positions of non-commercial traders.
Trading plan for the EUR/USD pair on November 23. Improving outlook on the COVID-19 situation around the world. 2020-11-23 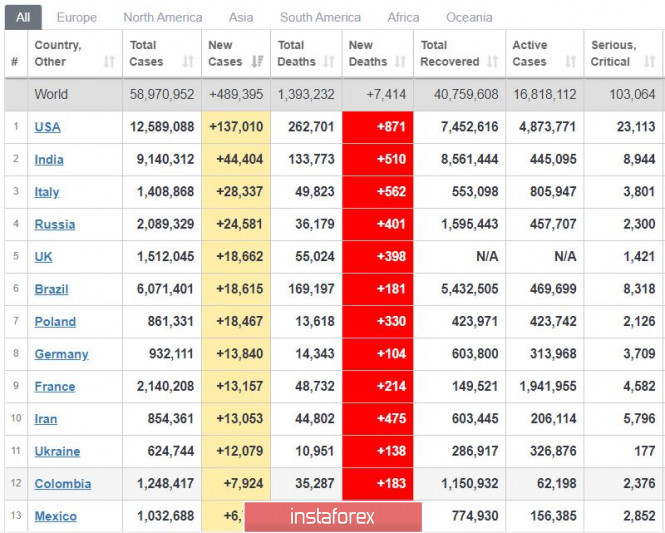
For the second time, global COVID-19 incidence has decreased, reaching a value of 660,000. This suggests that the virus is receding, especially since the US also has recorded a sharp drop in new cases from 200,000 to 137,000 yesterday. However, there is also the chance that this could only be the effect of the weekend, since such a scenario is typical on these days. Incidence rates have also stabilized in Europe, but they are still within high levels. In another note, on Friday, November 20, Pfizer filed for the approval of its vaccine. A response is expected to come out on December 10, and vaccinations are expected to begin in the US on December 11. Another vaccine, but this time from Moderna, is also close to being approved. The cost of vaccines from these companies is about $ 17-20 per dose, and you need to be vaccinated twice with an interval of a month. Many are also awaiting the vaccine from AstraZeneca and Oxford, which is expected to cost no more than $ 4-5 per dose. 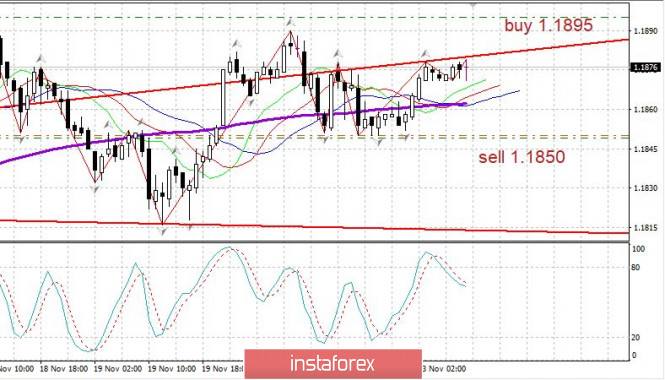
EUR/USD: Open long positions from 1.1895. Open short positions from 1.1850. Forex forecast 11/23/2020 on EUR/USD , EUR/GBP, Gold and Ethereum from Sebastian Seliga 2020-11-23 Let's take a look at the EUR/USD and EUR/GBP pairs before the PMI data releases. Moreover, we will analyze Gold and Ethereum at the H4 time frame chart. Technical analysis for the EUR/USD pair this week (Nov 23-28, 2020) 2020-11-23 The euro/dollar pair was moving in a sideways channel last week, and failed to break up the resistance line 1.1883 (white thick line) again, but the price closed below this line in the end. This week, the market may increase. Trend analysis: The price from the level of 1.1855 (closing of the last weekly candle) may start rising this week, with the goal at 1.1920 upper fractal (red dotted line). After testing this line, it can likely further rise towards the next goal, that is, the level of 1.2010 – the upper fractal (weekly candle from 08/30/2020). Upon reaching this level, we can continue to trade upwards. 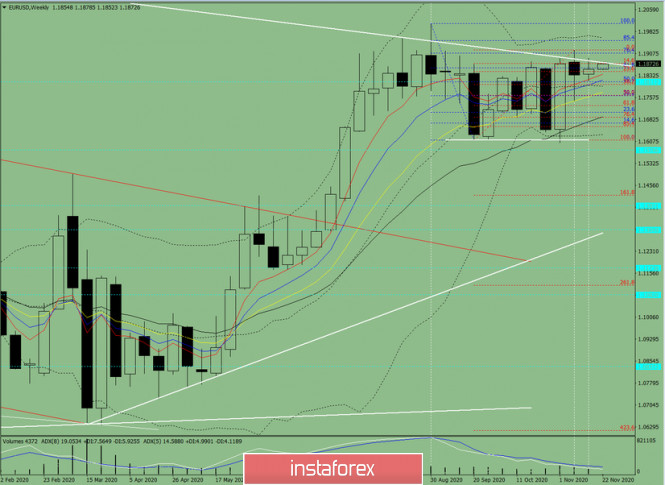
Figure 1 (weekly chart) Comprehensive analysis: - indicator analysis - up; - Fibonacci levels - up; - volumes - up; - candlestick analysis - up; - trend analysis - down; - Bollinger lines - up; - monthly chart - up. Growth can be concluded based on a comprehensive analysis. The overall result of the candlestick calculation of the EUR/USD currency pair on the weekly chart: the price is likely to have an upward trend this week, with no lower shadow in the weekly white candlestick (Monday - up) and no upper shadow (Friday - up). The first goal above is the resistance line 1.1883 (white thick line). After testing this line, it is possible to rise towards the next goal at 1.1908 - the pullback level of 76.4% (blue dashed line). Upon reaching this level, further growth can be expected towards the level of 1.1951 - the pullback level of 85.4% (blue dotted line). An alternative scenario: rising from the level of 1.1835 (closing of the last weekly candle) with the goal located at the resistance line 1.1883 (white thick line) can be considered. If this line is tested, there will be a decline towards the goal at 1.1802 - the pullback level of 38.2% (red dotted line). After testing this level, the price is likely to further decline to the goal of 1.1765 - the pullback level of 50.0% (red dotted line).
Author's today's articles: Sergey Belyaev  Born December 1, 1955. In 1993 graduated from Air Force Engineering Academy. In September 1999 started to study Forex markets. Since 2002 has been reading lectures on the technical analysis . Is fond of research work. Created a personal trading system based on the indicator analysis. Authored the book on technical analysis "Calculation of the next candlestick". At present the next book is being prepared for publishing "Indicator Analysis of Forex Market. Trading System Encyclopedia". Has created eleven courses on indicator analysis. Uses classical indicators. Works as a public lecturer. Held numerous seminars and workshops presented at international exhibitions of financial markets industry. Is known as one of the best specialists in the Russian Federation researching indicator analysis. Born December 1, 1955. In 1993 graduated from Air Force Engineering Academy. In September 1999 started to study Forex markets. Since 2002 has been reading lectures on the technical analysis . Is fond of research work. Created a personal trading system based on the indicator analysis. Authored the book on technical analysis "Calculation of the next candlestick". At present the next book is being prepared for publishing "Indicator Analysis of Forex Market. Trading System Encyclopedia". Has created eleven courses on indicator analysis. Uses classical indicators. Works as a public lecturer. Held numerous seminars and workshops presented at international exhibitions of financial markets industry. Is known as one of the best specialists in the Russian Federation researching indicator analysis. Stanislav Polyanskiy  Graduated from Odessa State Economic University. On Forex since 2006. Writes analytical reviews about international financial markets for more than 3 years. Worked as a currency analyst in different finance companies for a long time including the biggest companies of Russia and Ukraine. Graduated from Odessa State Economic University. On Forex since 2006. Writes analytical reviews about international financial markets for more than 3 years. Worked as a currency analyst in different finance companies for a long time including the biggest companies of Russia and Ukraine. Sebastian Seliga  Sebastian Seliga was born on 13th Oсtober 1978 in Poland. He graduated in 2005 with MA in Social Psychology. He has worked for leading financial companies in Poland where he actively traded on NYSE, AMEX and NASDAQ exchanges. Sebastian started Forex trading in 2009 and mastered Elliott Wave Principle approach to the markets by developing and implementing his own trading strategies of Forex analysis. Since 2012, he has been writing analitical reviews based on EWP for blogs and for Forex websites and forums. He has developed several on-line projects devoted to Forex trading and investments. He is interested in slow cooking, stand-up comedy, guitar playing, reading and swimming. "Every battle is won before it is ever fought", Sun Tzu Sebastian Seliga was born on 13th Oсtober 1978 in Poland. He graduated in 2005 with MA in Social Psychology. He has worked for leading financial companies in Poland where he actively traded on NYSE, AMEX and NASDAQ exchanges. Sebastian started Forex trading in 2009 and mastered Elliott Wave Principle approach to the markets by developing and implementing his own trading strategies of Forex analysis. Since 2012, he has been writing analitical reviews based on EWP for blogs and for Forex websites and forums. He has developed several on-line projects devoted to Forex trading and investments. He is interested in slow cooking, stand-up comedy, guitar playing, reading and swimming. "Every battle is won before it is ever fought", Sun Tzu Irina Manzenko  Irina Manzenko Irina Manzenko Mourad El Keddani  Was born in Oujda, Morocco. Currently lives in Belgium. In 2003 obtained B.S. in Experimental Sciences. In 2007 obtained a graduate diploma at Institut Marocain Specialise en Informatique Applique (IMSIA), specialty – Software Engineering Analyst. In 2007–2009 worked as teacher of computer services and trainer in a professional school specializing in computer technologies and accounting. In 2005 started Forex trading. Authored articles and analytical reviews on Forex market on Forex websites and forums. Since 2008 performs Forex market research, and develops and implements his own trading strategies of Forex analysis (especially in Forex Research & Analysis, Currency Forecast, and Recommendations and Analysis) that lies in: Numerical analysis: Probabilities, equations and techniques of applying Fibonacci levels. Classical analysis: Breakout strategy and trend indicators. Uses obtained skills to manage traders' accounts since 2009. In April 2009 was certified Financial Technician by the International Federation of Technical Analysts. Winner of several social work awards: Education Literacy and Non-Formal Education (in Literacy and Adult Education in The National Initiative for Human Development). Was born in Oujda, Morocco. Currently lives in Belgium. In 2003 obtained B.S. in Experimental Sciences. In 2007 obtained a graduate diploma at Institut Marocain Specialise en Informatique Applique (IMSIA), specialty – Software Engineering Analyst. In 2007–2009 worked as teacher of computer services and trainer in a professional school specializing in computer technologies and accounting. In 2005 started Forex trading. Authored articles and analytical reviews on Forex market on Forex websites and forums. Since 2008 performs Forex market research, and develops and implements his own trading strategies of Forex analysis (especially in Forex Research & Analysis, Currency Forecast, and Recommendations and Analysis) that lies in: Numerical analysis: Probabilities, equations and techniques of applying Fibonacci levels. Classical analysis: Breakout strategy and trend indicators. Uses obtained skills to manage traders' accounts since 2009. In April 2009 was certified Financial Technician by the International Federation of Technical Analysts. Winner of several social work awards: Education Literacy and Non-Formal Education (in Literacy and Adult Education in The National Initiative for Human Development).
Languages: Arabic, English, French and Dutch.
Interests: Algorithm, Graphics, Social work, Psychology and Philosophy. Vyacheslav Ognev  Vyacheslav was born on August 24, 1971. In 1993, he graduated from Urals State University of Economics in the Russian city of Ekaterinburg holding a degree in Commerce and Economics of Trade. In 2007, he started concentrating on the Russian stock market, trading stocks on the RTS Stock Exchange and futures contracts on FORTS. Since 2008 he has been engaged in analyzing Forex market and trading currencies. He is an author of a simplified wave analysis method. He has also developed a trading strategy. At present, Vyacheslav is a co-author of training materials on two web portals dedicated to Forex trading education. Interests: fitness, F1 "Experience is the best of schoolmasters, only the school fees are heavy." - Thomas Carlyle Vyacheslav was born on August 24, 1971. In 1993, he graduated from Urals State University of Economics in the Russian city of Ekaterinburg holding a degree in Commerce and Economics of Trade. In 2007, he started concentrating on the Russian stock market, trading stocks on the RTS Stock Exchange and futures contracts on FORTS. Since 2008 he has been engaged in analyzing Forex market and trading currencies. He is an author of a simplified wave analysis method. He has also developed a trading strategy. At present, Vyacheslav is a co-author of training materials on two web portals dedicated to Forex trading education. Interests: fitness, F1 "Experience is the best of schoolmasters, only the school fees are heavy." - Thomas Carlyle Maxim Magdalinin  In 2005 graduated from the Academy of the Ministry of Internal Affairs of the Republic of Belarus, law faculty. Worked as a lawyer for three years in one of the biggest country's company. Besides the trading, he develops trading systems, writes articles and analytical reviews. Works at stock and commodity markets explorations. On Forex since 2006. In 2005 graduated from the Academy of the Ministry of Internal Affairs of the Republic of Belarus, law faculty. Worked as a lawyer for three years in one of the biggest country's company. Besides the trading, he develops trading systems, writes articles and analytical reviews. Works at stock and commodity markets explorations. On Forex since 2006. Mihail Makarov  - -
Subscription's options management Theme's:
Fundamental analysis, Fractal analysis, Wave analysis, Technical analysis, Stock Markets
Author's :
A Zotova, Aleksey Almazov, Alexander Dneprovskiy, Alexandr Davidov, Alexandros Yfantis, Andrey Shevchenko, Arief Makmur, Dean Leo, Evgeny Klimov, Fedor Pavlov, Grigory Sokolov, I Belozerov, Igor Kovalyov, Irina Manzenko, Ivan Aleksandrov, l Kolesnikova, Maxim Magdalinin, Mihail Makarov, Mohamed Samy, Mourad El Keddani, Oleg Khmelevskiy, Oscar Ton, Pavel Vlasov, Petar Jacimovic, R Agafonov, S Doronina, Sebastian Seliga, Sergey Belyaev, Sergey Mityukov, Stanislav Polyanskiy, T Strelkova, Torben Melsted, V Isakov, Viktor Vasilevsky, Vladislav Tukhmenev, Vyacheslav Ognev, Yuriy Zaycev, Zhizhko Nadezhda
Edit data of subscription settings
Unsubscribe from the mailing list Sincerely,
Analysts Service | If you have any questions, you can make a phone call using one of the
InstaForex Toll free numbers right now:
|  | InstaForex Group is an international brand providing online trading services to the clients all over the world. InstaForex Group members include regulated companies in Europe, Russia and British Virgin Islands. This letter may contain personal information for access to your InstaForex trading account, so for the purpose of safety it is recommended to delete this data from the history. If you have received this letter by mistake, please contact InstaForex Customer Relations Department. |


No comments:
Post a Comment