| AUD/USD Review and Forecast from October 16, 2020 2020-10-16 Hello there! The price dynamics of the Australian dollar was influenced by important macroeconomic indicators, as well as comments from the head of the Reserve Bank of Australia (RBA), Philip Lowe. The data yesterday on the Australian labor market came out better than the forecast values but market participants actually ignored the Australian labor reports, and the "Aussie" did not receive the much-needed and largely expected support. Now, on the last day of weekly trading, I will not give specific figures for the Australian labor market as they can easily be found in the economic calendar. In my opinion, based on the speech of the head of the RBA, it was kept in neutral-dovish tones. Some experts continue to expect further easing of the RBA's monetary policy and a reduction in the main interest rate at the end of the next meetings. The reason why AUD/USD was under pressure also includes weak statistics from China, which is Australia's largest trading partner, as well as anti-risk sentiment that has been observed in the market in recent days. Weekly 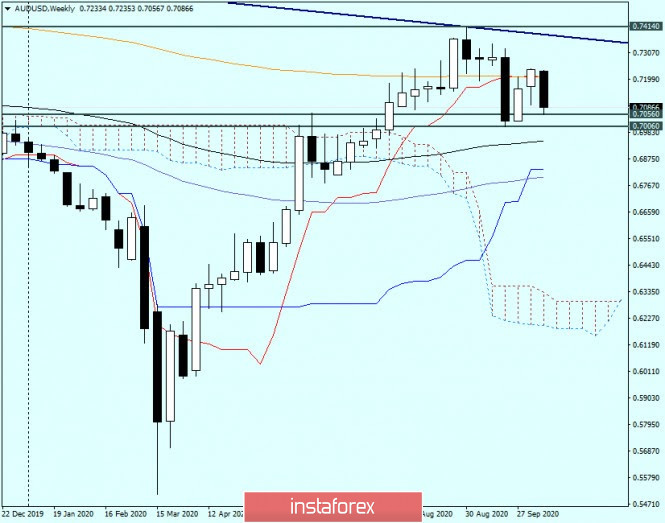 After the previous two-week growth and the closing of the last week above the red line of the Tenkan Ichimoku indicator and the 200 EMA, the pair shows a fairly strong downward trend in the current five-day trading period. However, in my opinion, there are two important levels about the breakdown of which is simply necessary in order to count on a downward scenario in the medium term. The first of these two marks is 0.7100, which is being tested for a breakdown at the time of writing this article. The second level is 0.7000. At the same time, only a true breakdown of the last mark signals a further opportunity to move in a southerly direction. To implement the bullish scenario, it is necessary to return the price above the red Tenkan line, after which the bulls on the "Aussie" will have to once again test the strong resistance of sellers near the iconic 0.7400 mark, as well as break through the resistance line 0.8136 - 0.7414. Despite the previous growth forecasts based on the previous week's closing price above Tenkan and the orange 200 exponential moving average, I believe that the situation has already changed or is changing in favor of bearish sentiment. As already noted, the breakdown of a significant psychological and technical level of 0.7000 will finally confirm this assumption. Daily 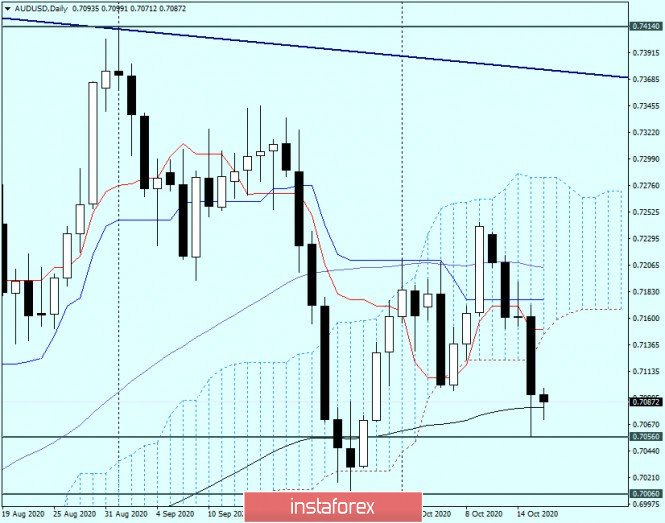 As we can see on the daily chart, the pair fell out of the Ichimoku indicator cloud. Despite the more or less significant lower shadow, the downward scenario has every chance of continuing, which will confirm the update of yesterday's lows at 0.7056. In my purely personal opinion, the main trading recommendation for the pair should be considered sales, which are better to open after a breakout of 0.7056 or after a corrective pullback to the broken lower border of the daily Ichimoku cloud, which now passes near 0.7145. More aggressively, you can try to sell the "Aussie" after the price rises to the level of 0.7120. I recommend that you hold off on your purchases for now. Successful bidding! Technical analysis and trading recommendations on EUR/GBP on October 16 2020-10-16 Hello, dear traders! Since today is the last trading day of the week, it is better to carry out the analysis of the GBP/USD pair on Monday when the trading week will actually end. Today, however, let's focus on the euro/pound cross rate which has been ignored for a long time. I assume that in the light of the upcoming end of the Brexit saga this instrument will become even more attractive, especially to those investors who use it in their trading. The most acute issue remains COVID-19 which is still exerting a powerful impact on global financial markets. Given the gloomy forecasts of virologists, the coronavirus has all chances to spread further on. Despite popular discontent, the British government intends to tighten restrictive measures in London and in the north of England. The reason for the implementation of such tough measures is the growing number of coronavirus cases in London and Manchester. The economic costs of the lockdown and varios restrictive measures increase along with the second wave of COVID-19. Given the fact that the British economy will be suffering substantial losses (at least in the beginning) after Brexit, the economic future of the United Kingdom looks quite gloomy. Most likely, the British pound sterling will face difficult times even despite the fact that even the worst scenarios have already been partly or largely included in the price of the British currency. It is also fair to say that the UK's withdrawal from the European Union will have an adverse impact on the euro. However, according to the author of the article, this effect will not be as profound as in case of the pound sterling. Now, let's conduct a technical analysis of the EUR/GBP cross rate on the weekly time frame. I am convinced that sometimes price charts can provide plenty of useful and accurate information, and often in advance. Weekly 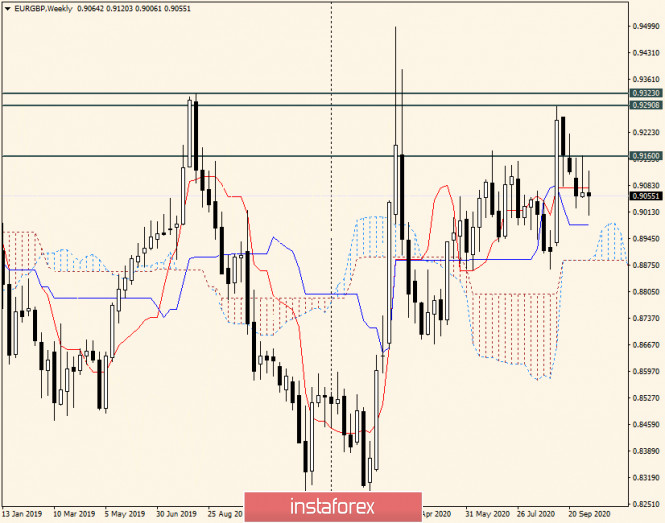
The first thing to pay attention to is strong bearish resistance, which is located near the significant technical level of 0.9300. As we can see, the quote has fallen multiple times trying to break through this mark. Moreover, it happened more than once. In the meantime, at the moment of writing this article, the current weekly candlestick was actually missing a body, while the existing shadows above and below show the absence of a clear price trend. Most likely, market participants are waiting for the outcome of the EU summit. Notably, the previous weekly candlestick was formed with a very long upper shadow and a very small bullish body. Usually, after the formation of such candlesticks, the quote goes downward. In addition, the pair is trading near the weekly red Tenkan line. If the current weekly trades are closed above this line, bulls will have the opportunity to resume the upward movement. In this case, the immediate upward target will be the previous high of 0.9160. Otherwise, if the cross pair breaks through the important support zone of 0.9000-0.8980, the bearish movement will be confirmed. Both the psychological and technical level and the blue Kijun line of the Ichimoku indicator are located in this support zone. I assume that both scenarios are possible at the moment. The closest levels to buy the instrument are in the region of 0.9080-0.9100. Apart from that, this is also the area of 0.9145-0.9160. It is better to open long positions from the 0.9010-0.8980 price zone. In both cases, the best thing to do is to turn to the corresponding candlestick signals in the daily/four-hour/ hourly time frame. Those who do not want to take risks are better to stay out of the market for now. Have a nice weekend! EUR/USD and GBP/USD: Implementation of another strict social distancing measures limits the growth of the European currency. Diminishing hopes of having a post-Brexit deal puts pressure on the British pound. 2020-10-16 The British pound fell in the markets yesterday, amid disappointing statements from the EU over the post-Brexit trade deal. In addition to that, the coronavirus continues to spread in the UK, which forces authorities to resort to another strict social distancing measures, which has a negative effect on the UK economy.  On the first day of negotiations, not much progress has been made, as the EU only reaffirmed that the Brexit transition period ends on December 31, 2020. This gives light to the idea that the EU does not intend to make any concessions over the trade agreement, despite all the indignation and alternative scenarios that the UK is ready to apply in the event of a tough Brexit and breakdown of previous trade relations. Such disappointing news dropped the pound down in the markets, thereby knocking all the traders who bet on a rise after being under the impression that the two parties would finally agree to a deal. Now, the pound is trading at a quote of 1.2850, and a breakout from which will immediately bring it to a price of 1.2800. Such will also make it easier for the GBP / USD pair to reach a new local low, which is 1.2740. But if good news arises, that is, the UK and the EU finally signs a deal, the pound could return to a price of 1.2950, which will make it easier for the bulls to increase the pound towards a quote of 1.3010 or 1.3085. EUR / USD Much like the pound, the European currency is also experiencing growth problems, not only because of the weak statistics for the euro area, but also because of the implementation of another strict social distancing measures. Yesterday, German Chancellor Angela Merkel announced additional measures to combat the spread of the coronavirus, requiring citizens to wear protective masks in public places. As for the regions that record high levels of incidence rate, bars and restaurants that open late at night will be closed, and no more than 10 people are allowed at parties.  The UK government also announced additional restrictions to slow the spread of the coronavirus, imposing a ban on household gatherings and parties. As of the moment, Europe is in a bad situation, in which if the incidence rate continues to rise, its GDP will collapse to much record lows. This is because new restrictive measures will affect the service sector, since the authorities will be forced to close bars, restaurants and shops. It will also negatively affect the confidence of consumers and companies. However, this scenario could be avoided, but it is on the grounds that a vaccine against the coronavirus is finally invented. In this case, the EU economy could recover by 2.0%. With regards to economic statistics, a rather weak data on the US labor market was published yesterday, the figures of which clearly show that recovery is slowing down. The report of the US Department of Labor indicated that initial jobless claims for the week of October 4-10 rose by 53,000, amounting to 898,000. 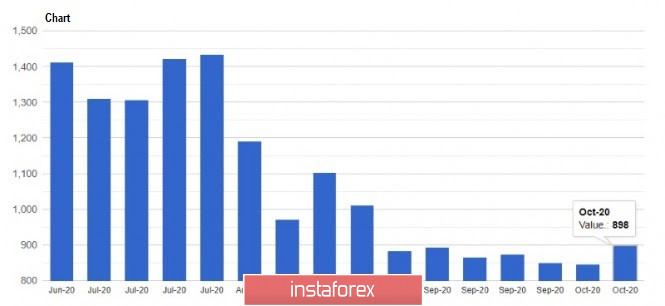 Meanwhile, business activity in the area of Philadelphia Fed continued to grow in October, reaching 32.3 points against 15 points in September. Economists expected the indicator to come out at only 14 points. In line with this, San Francisco Fed President, Mary Daly, said the economic outlook of the United States will be weaker, if the government does not allocate additional measures of fiscal support. Until now, the Republicans and Democrats have not agreed on a new package of economic assistance, however, it is unlikely to be done before the US elections this November. Daly said a weaker-than-expected prospect will prolong the Fed's current response, but it is still too early to talk about a change in the volume of asset purchases, since the Fed does not need new tools to withstand economic difficulties. As for the technical picture of the EUR / USD pair, demand for the euro will remain low today, on the grounds that the bears manage to bring the quote below the level of 1.1685. Such will also make the pair reach new lows, at a level of 1.1645 or 1.1600. The euro will only see a rise if traders manage to return the quote to the level of 1.1725, as such will knock out many sell limits, and will bring the quote to the highs 1.1770 and 1.1830. Trading idea for the NZD/USD pair 2020-10-16 
A strong bearish momentum went through the kiwi yesterday, following the downward scenario predicted on October 14 . Thus, as of today, the pair has already moved down 70 pips, almost reaching the target price levels set earlier. 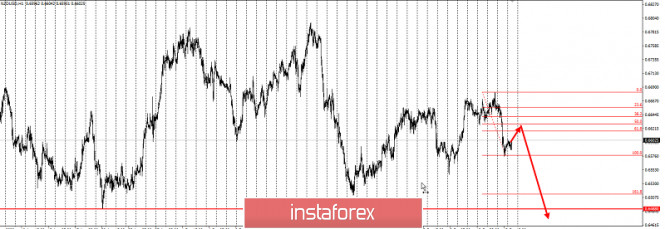
In fact, the recent price movements have formed a three-wave pattern, with which wave A is the strong downward thrust yesterday. To keep the quote moving in the direction of the target price levels, set short positions along the 50% retracement zone. However, such a strategy will be irrelevant once the quote reaches the level of 0.6660. Aside from that, the risk should also be monitored to avoid any losses. Remember that trading in this financial market is precarious, but also very profitable as long as you use the right approach. In this case, the strategy used is Price Action and Stop Hunting. Good luck! EUR/USD analysis for October 16, 2020 - Potential for the further rise and continuation of the upside trend 2020-10-16 - If greater action is needed due to incoming data, we have the capacity and willingness to act accordingly
- Given the present uncertainty, it would be a mistake to set an end date for the ECB's pandemic response
Some token remarks by Villeroy, as we have seen from most ECB speakers this week. All of this is mainly to reaffirm that they are still in a wait-and-see approach and will only consider more action should there be material downside to incoming economic data. Further Development 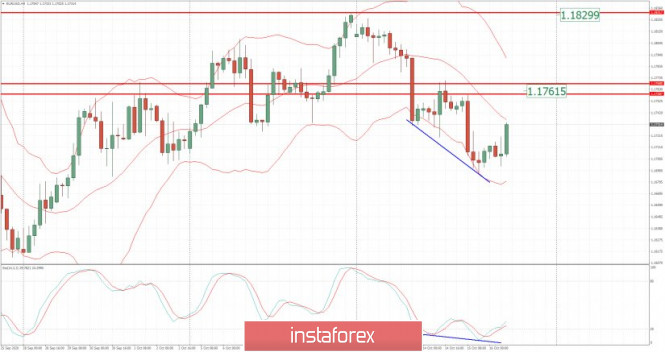
Based on the graph above I found that on the top of the list we got Lean Hogs and Coffee today and on the bottom Lumber and Gasoline RBOB. Key Levels: Resistance: 1,1760 and 1,1830 Support level: 1,1700 Analysis of Gold for October 16,.2020 - Potential for further rally towards the level at $1.931 2020-10-16 - Given the present uncertainty, it would be a mistake to set an end date for the ECB's pandemic response
Some token remarks by Villeroy, as we have seen from most ECB speakers this week. All of this is mainly to reaffirm that they are still in a wait-and-see approach and will only consider more action should there be material downside to incoming economic data. 
Further Development 
Analyzing the current trading chart of Gold, I found that the sellers got exhausted today and that price failed to test recent swing low based on the 4H time-frame, which is good sign for further rise. The Golds in overall uptrend on the short-mid term and my advice is to watch for buying opportunities on the dips with the tragets at $1,931 and $1,9543 Key pivot level resistance is set at $1,913 1-Day relative strength performance Finviz 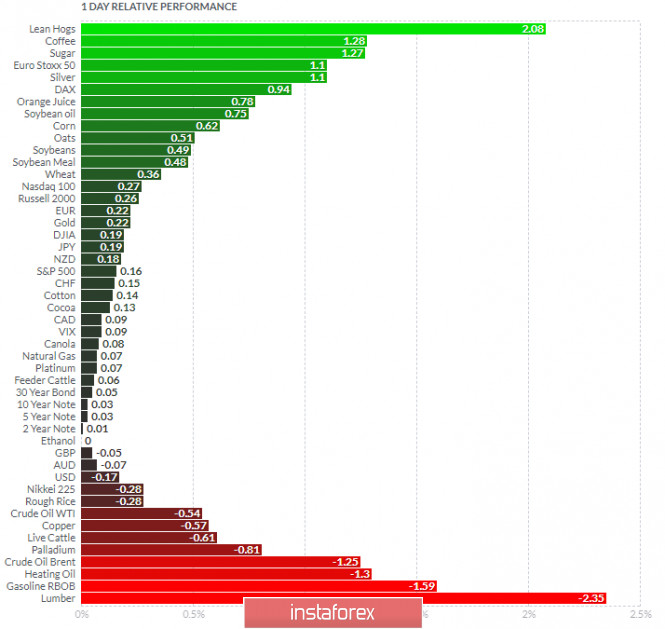
Based on the graph above I found that on the top of the list we got Lean Hogs and Coffee today and on the bottom Lumber and Gasoline RBOB. Gold is positive today on the relative strength list, which is another sign for the upside movement. Key Levels: Resistance: $1,913, $1,930 and $1,955 Support level: $1,890 Trading recommendations for the GBP/USD pair on October 16 2020-10-16 The trading week is coming to an end. If we analyze all price movements that occurred this week, we will see that large speculative jumps started when the quote reached the psychological level of 1.3000. In fact, it was with the use of technical analysis that key coordinates were determined, within which price jumps were observed. The key coordinates are: 1.2860; 1.3060 / 1.3080. The overall structure, albeit has a wide range, is rather shaky, in which if there is a more dominant activity from certain participants (Bulls or Bears), a breakout occurs, which leads to a further surge in activity. The trading strategy, as before, gives preference to short-term trading operations, where news, as well as areas of interaction of trade forces, serve as trading signals. So, if we look at the M15 chart and analyze the trades set yesterday, we will see that many short positions appeared at 06: 45-15: 30, during which the quote moved towards the level of 1.1860. Such a movement is quite identical with what happened to the EUR / USD pair. In terms of daily dynamics, the indicator recorded 139 points for October 15, which is 13% above the average level. Activity has been high in the market for three days already, which indicates a high ratio of speculative positions in the GBP / USD pair. This is because following the previous review , traders held the quote below 1.3000 in order to trigger a downside move in the pair. Fortunately, it really occurred and coincided with the earlier trading forecast. As for the daily chart, it is quite clear that the correction that started from the local low 1.2674 is coming to an end, and it seems that a recovery process is due to begin soon. With regards to other factors that influence price movement, a slightly weak US labor market report was released, where it was revealed that initial jobless claims increased from 845,000 to 898,000, while second claims decreased from 11,183,000 to 10,018,000. In this case though, the advantage is on the side of second claims, so the US dollar rose evidently in the market. Another factor was the long-standing issue on the post-Brexit deal, which, until now, has not been resolved. The negotiations started again yesterday, however, the EU only reaffirmed that the transition period ends on December 31, and said that countries should prepare for a British exit without a deal. "The European Council confirms that the transition period will end on December 31, 2020 and notes with concern that progress in the negotiations on key issues for the community is not enough to reach an agreement. Against this background, the EU is instructing its chief negotiator, Michel Barnier, to continue negotiations in the coming weeks, and urge the UK to take necessary actions to make the agreement possible. In this regard, the European Council calls on all countries and institutions of the community, as well as all interested players, to intensify work at all levels to prepare for all scenarios, including the absence of an agreement. The summit instructs the European Commission to timely prepare proposals for unilateral emergency measures to ensure the interests of the European Union, "the EU summit document says. London, in turn, expressed its disappointment. "The UK is disappointed with the decision taken at the EU summit. We are surprised that the EU is no longer committed to working hard to achieve a future partnership "said UK chief negotiator, David Frost Today, data on US retail sales will be published, and the growth rate of which may slow down from 2.6% to 2.2%.  The upcoming trading week contains many statistical indicators, including data on inflation and retail sales in the United Kingdom. However, the main driver, as before, will be Brexit, coronavirus and the US elections. Tuesday, October 20 USA 13:30 - Number of issued building permits (September) USA 13:30 - Volume of construction of new houses (September) Wednesday, October 21 UK 07:00 - Inflation Thursday, October 22 US 13:30 - Jobless claims US 15:00 - Sales in the secondary housing market (September) Friday, October 23 UK 07:00 - Volume of retail sales (September) US 14:45 - Preliminary Services PMI (October) Further development As we can see on the trading chart, strong fluctuations occurred in the GBP / USD pair, so we should pay close attention to coordinates 1.2860; 1.3060 / 1.3080, as a breakout from which can lead to strong impulsive waves in the market. 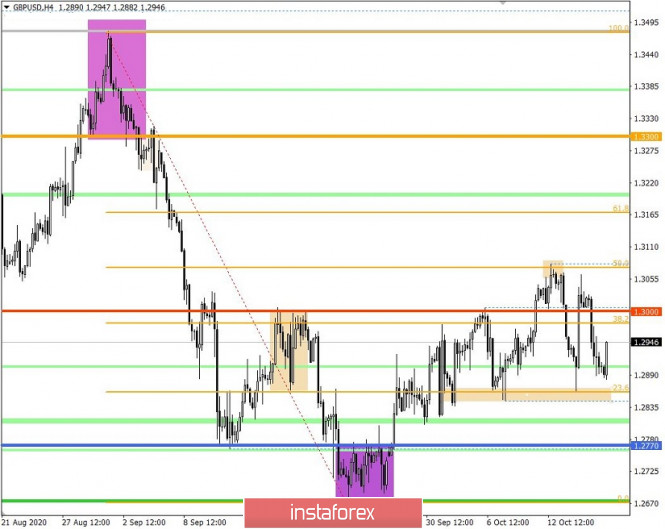 Indicator analysis Looking at the different sectors of time frames (TF), we can see that the indicators on the minute period signal BUY, while the indicators on the hourly period signal SELL. The daily period, on the other hand, changed signal from BUY to NEUTRAL, and this is because of the price convergence in the GBP / USD pair. 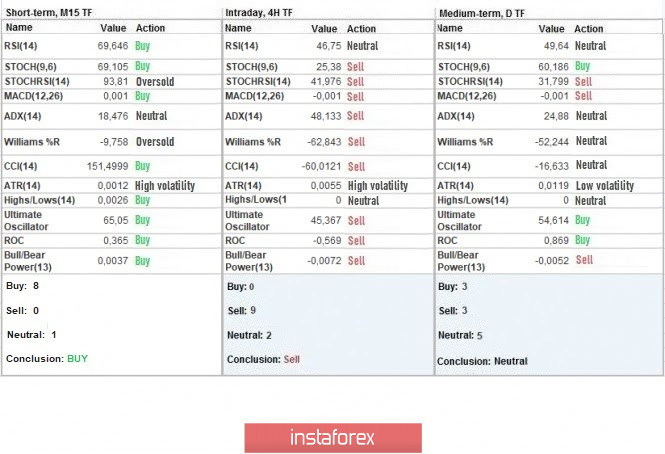 Weekly volatility / Volatility measurement: Month; Quarter; Year Volatility is measured relative to the average daily fluctuations, which are calculated every Month / Quarter / Year. (The dynamics for today is calculated, all while taking into account the time this article is published) Volatility is currently at 62 points, which is 49% below the average level. Since speculative activity remains high in the market and that a bunch of news are still relevant on market sentiment, volatility will continue to jump in the GBP / USD pair. 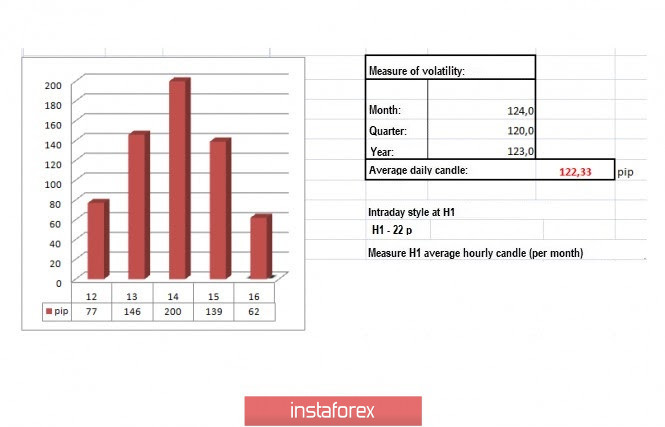 Key levels Resistance zones: 1.3000 ***; 1.3200; 1.3300 **; 1.3600; 1.3850; 1.4000 ***; 1.4350 **. Support Zones: 1.2770 **; 1.2620; 1.2500; 1.2350 **; 1.2250; 1.2150 **; 1.2000 *** (1.1957); 1.1850; 1.1660; 1.1450 (1.1411). * Periodic level ** Range level *** Psychological level Also check the brief trading recommendations for EUR / USD pair here. Gold bulls try to break resistance 2020-10-16 Gold price is trading above $1,900 again and is challenging important short-term resistance at $1,910-15 area. Gold bulls need to continue making higher highs and higher lows and in order to resume the up trend towards $1,955 and maybe higher. 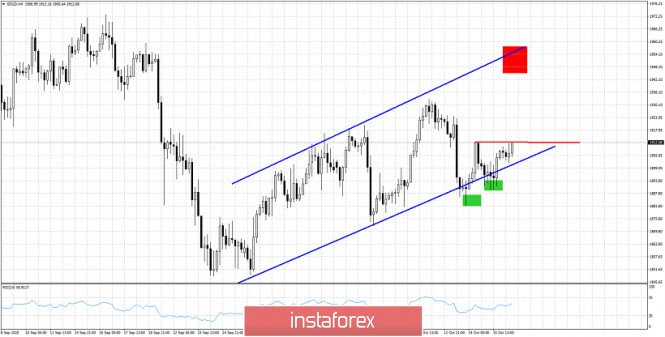
Blue lines - bullish channel Green rectangles - higher lows Red line - horizontal resistance Red rectangle -target Gold price target remains at $1,955 as long as price remains above the green rectangles. Bulls need to break above $1,910-15 on a daily basis and stay above this level in order to continue higher towards our target of $1,955. As long as price remains above $1,882 which was our stop from our latest trading plan, we remain optimistic. Breaking below $1,882 will cancel all short-term bullish scenarios.
Author's today's articles: Ivan Aleksandrov  Ivan Aleksandrov Ivan Aleksandrov Pavel Vlasov  No data No data Andrey Shevchenko  Andrey Shevchenko Andrey Shevchenko Petar Jacimovic  Petar was born on July 08, 1989 in Serbia. Graduated from Economy University and after has worked as a currency analyst for large private investors. Petar has been involved in the world of finance since 2007. In this trading he specializes in Volume Price Action (volume background, multi Fibonacci zones, trend channels, supply and demand). He also writes the market analytical reviews for Forex forums and websites. Moreover Petar is forex teacher and has wide experience in tutoring and conducting webinars. Interests : finance, travelling, sports, music "The key to success is hard work" Petar was born on July 08, 1989 in Serbia. Graduated from Economy University and after has worked as a currency analyst for large private investors. Petar has been involved in the world of finance since 2007. In this trading he specializes in Volume Price Action (volume background, multi Fibonacci zones, trend channels, supply and demand). He also writes the market analytical reviews for Forex forums and websites. Moreover Petar is forex teacher and has wide experience in tutoring and conducting webinars. Interests : finance, travelling, sports, music "The key to success is hard work" Vladislav Tukhmenev  Vladislav graduated from Moscow State University of Technologiy and Management. He entered the forex market in early 2008. Vladislav is a professional trader, analyst, and manager. He applies a whole gamut of analysis – technical, graphical, mathematical, fundamental, and candlestick analysis. Moreover, he forecasts the market movements using his own methods based on the chaos theory. Vladimir took part in development of trading systems devoted to fractal analysis. In his free time, Vladimir blogs about exchange markets. Hobbies: active leisure, sporting shooting, cars, design, and marketing. "I do not dream only of becoming the best in my field. I also dream about those who I will take with me along the way up." Vladislav graduated from Moscow State University of Technologiy and Management. He entered the forex market in early 2008. Vladislav is a professional trader, analyst, and manager. He applies a whole gamut of analysis – technical, graphical, mathematical, fundamental, and candlestick analysis. Moreover, he forecasts the market movements using his own methods based on the chaos theory. Vladimir took part in development of trading systems devoted to fractal analysis. In his free time, Vladimir blogs about exchange markets. Hobbies: active leisure, sporting shooting, cars, design, and marketing. "I do not dream only of becoming the best in my field. I also dream about those who I will take with me along the way up." Alexandros Yfantis  Alexandros was born on September 14, 1978. He graduated from the ICMA Centre, University of Reading with the MSc in International Securities, investment and Banking in 2001. In 2000, Alexandros got the BSc in Economics and Business Finance from Brunel University, UK. In 2004, he began trading on the Greek stock market, where Alexandros got a specialization in international derivatives. Alexandros Yfantis has worked in a top financial company in Greece, responsible for the day-to-day running of the International markets department. He is a certified Portfolio Manager and a certified Derivatives Trader. Alexandros is also a contributor and analyst using Elliott wave and technical analysis of global financial markets. In 2007, he started Forex trading. He loves his profession and believes that entering a trade should always be accompanied by money management rules. His goal is to find profitable opportunities across the markets while minimizing risk and maximizing potential profit. "I'm still learning" Michelangelo Alexandros was born on September 14, 1978. He graduated from the ICMA Centre, University of Reading with the MSc in International Securities, investment and Banking in 2001. In 2000, Alexandros got the BSc in Economics and Business Finance from Brunel University, UK. In 2004, he began trading on the Greek stock market, where Alexandros got a specialization in international derivatives. Alexandros Yfantis has worked in a top financial company in Greece, responsible for the day-to-day running of the International markets department. He is a certified Portfolio Manager and a certified Derivatives Trader. Alexandros is also a contributor and analyst using Elliott wave and technical analysis of global financial markets. In 2007, he started Forex trading. He loves his profession and believes that entering a trade should always be accompanied by money management rules. His goal is to find profitable opportunities across the markets while minimizing risk and maximizing potential profit. "I'm still learning" Michelangelo
Subscription's options management Theme's:
Fundamental analysis, Fractal analysis, Wave analysis, Technical analysis, Stock Markets
Author's :
A Zotova, Aleksey Almazov, Alexander Dneprovskiy, Alexandr Davidov, Alexandros Yfantis, Andrey Shevchenko, Arief Makmur, Dean Leo, Evgeny Klimov, Fedor Pavlov, Grigory Sokolov, I Belozerov, Igor Kovalyov, Irina Manzenko, Ivan Aleksandrov, l Kolesnikova, Maxim Magdalinin, Mihail Makarov, Mohamed Samy, Mourad El Keddani, Oleg Khmelevskiy, Oscar Ton, Pavel Vlasov, Petar Jacimovic, R Agafonov, S Doronina, Sebastian Seliga, Sergey Belyaev, Sergey Mityukov, Stanislav Polyanskiy, T Strelkova, Torben Melsted, V Isakov, Viktor Vasilevsky, Vladislav Tukhmenev, Vyacheslav Ognev, Yuriy Zaycev, Zhizhko Nadezhda
Edit data of subscription settings
Unsubscribe from the mailing list Sincerely,
Analysts Service | If you have any questions, you can make a phone call using one of the
InstaForex Toll free numbers right now:
|  | InstaForex Group is an international brand providing online trading services to the clients all over the world. InstaForex Group members include regulated companies in Europe, Russia and British Virgin Islands. This letter may contain personal information for access to your InstaForex trading account, so for the purpose of safety it is recommended to delete this data from the history. If you have received this letter by mistake, please contact InstaForex Customer Relations Department. |


No comments:
Post a Comment