| Technical Analysis of GBP/USD for October 16, 2020 2020-10-16 Technical Market Outlook: The GBP/USD pair has been rejected from the supply zone located between the levels of 1.3059 - 1.3081. It looks like this zone will be the key short-term zone for both bulls and bears and only a clear and sustained breakout will show the traders the next direction for Pound. In a case of a bullish scenario, the next target would be 1.3121 and the next target for bears is seen at the level of 1.2868 and 1.2848. Currently, the market is traidng around the upper channel line seen at the level of 1.2868. Weekly Pivot Points: WR3 - 1.3328 WR2 - 1.3191 WR1 - 1.3137 Weekly Pivot - 1.2992 WS1 - 1.2933 WS2 - 1.2792 WS3 - 1.2730 Trading Recommendations: On the GBP/USD pair the main, multi-year trend is down, which can be confirmed by the down candles on the monthly time frame chart. The key long-term technical resistance is still seen at the level of 1.3518. Only if one of these levels is clearly violated, the main trend might reverse (1.3518 is the reversal level) or accelerate towards the key long-term technical support is seen at the level of 1.1903 (1.2589 is the key technical support for this scenario). 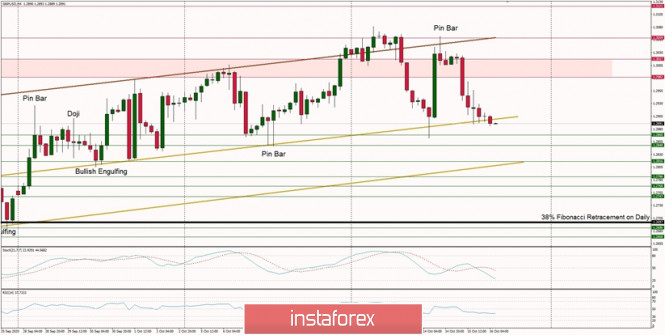
Technical Analysis of EUR/USD for October 16, 2020 2020-10-16 Technical Market Outlook: The EUR/USD pair has made another lower low after it was rejected from the level of 1.1822. This is the 61% Fibonacci retracement level on the weekly time frame chart and had been tested many times in the past and even this time the bears were stronger than bulls again. The market has made the lower low at the level of 1.1692, just below the technical support seen at the level of 1.1696. Despite the oversold conditions, the momentum remains weak and negative, which support the short-term bearish outlook. Weekly Pivot Points: WR3 - 1.2004 WR2 - 1.1916 WR1 - 1.1875 Weekly Pivot - 1.1792 WS1 - 1.1756 WS2 - 1.1665 WS3 - 1.1629 Trading Recommendations: Since the middle of March 2020 the main trend is on EUR/USD pair has been up, which can be confirmed by almost 10 weekly up candles on the weekly time frame chart and 4 monthly up candles on the monthly time frame chart. Nevertheless, weekly chart is recently showing some weakness in form of a several Pin Bar candlestick patterns at the recent top seen at the level of 1.2004. This means any corrections should be used to buy the dips until the key technical support is broken. The key long-term technical support is seen at the level of 1.1445. The key long-term technical resistance is seen at the level of 1.2555. 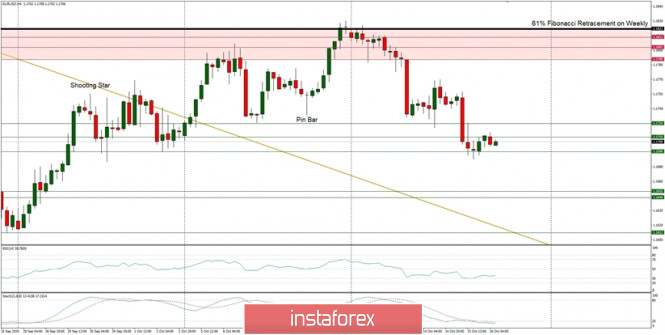
Analytics and trading signals for beginners. How to trade EUR/USD on October 16? Plan for opening and closing trades on Friday 2020-10-16 Hourly chart of the EUR/USD pair 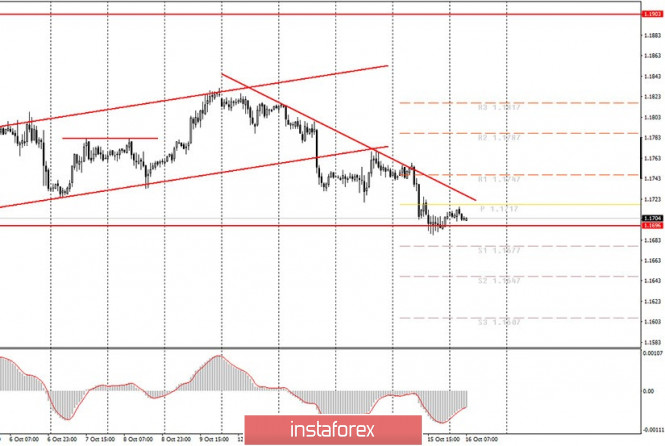 The EUR/USD pair failed to overcome the 1.1696 level last Thursday night, which served as the lower border of the horizontal channel for a long time. Thus, at the moment, we can conclude that there was a rebound and a correction began. That's exactly what we need. As long as the price is below the trend line, the downward trend is maintained. Therefore, we need a round of correction so that the MACD indicator discharges to the zero level, afterwards we can expect a sell signal to appear. Also, as a sell signal, you can consider that the price could rebound from the trend line, which already has four reference points. However, take note that in the near future it will be difficult for the MACD indicator to turn down if the downward movement resumes. The correction is too weak and the indicator failed to even approach the zero level. On the other hand, if the downward trend line is overcome, then novice traders can consider long options on the foreign exchange market. The fundamental background for the EUR/USD pair remains unchanged. The consumer price index (inflation) will be released in the European Union today, which we consider the most significant report of the day. The headline inflation is expected to remain at -0.3% y/y, while core inflation is expected to rise to 0.2% y/y. If today's results do not exceed forecasts, then the euro will not receive support due to such values. Deflation has a very negative effect on the economic growth of any country. And the European economy is now recovering from the coronavirus crisis, and is just entering the stage of the second wave of the epidemic. Therefore, anything that can stop economic growth only adds to the headaches of the European Central Bank and the EU government. A relatively important retail sales report will be released in America. However, forecasts for this indicator are as neutral as possible. The same goes for the US industrial production report. We believe that traders will not react to such US reports or reaction would be minimal. Based on this, we continue to recommend that traders pay more attention to technical factors. As for the general fundamental background, such as the elections in America or the new aid package for the US economy, there is no new information on them. Consequently, market participants have nothing to react to. Possible scenarios for October 16: 1) Buy positions on the EUR/USD pair have ceased to be relevant at the moment, since the pair left the ascending channel. However, if the price settles above the new trendline, then novice traders can try to open long positions while aiming for resistance levels of 1.1747 and 1.1787, since a new round of upward movement will most likely begin in this case. Especially if the 1.1696 level remains unbroken. 2) Sell positions are still relevant at the moment. However, traders failed to overcome the 1.1696 level on their first attempt. Therefore, we recommend opening new sell orders if the 1.1696 level is overcome or after a new round of correction to the trend line, afterwards the MACD indicator will form a sell signal. The targets will be the support levels 1.1677 and 1.1647. The ultimate goal is 1.1607. On the chart: Support and Resistance Levels are the Levels that serve as targets when buying or selling the pair. You can place Take Profit near these levels. Red lines are the channels or trend lines that display the current trend and show in which direction it is better to trade now. Up/down arrows show where you should sell or buy after reaching or breaking through particular levels. The MACD indicator (14,22,3) consists of a histogram and a signal line. When they cross, this is a signal to enter the market. It is recommended to use this indicator in combination with trend lines (channels and trend lines). Important announcements and economic reports that you can always find in the news calendar can seriously influence the trajectory of a currency pair. Therefore, at the time of their release, we recommended trading as carefully as possible or exit the market in order to avoid a sharp price reversal. Beginners on Forex should remember that not every single trade has to be profitable. The development of a clear strategy and money management are the key to success in trading over a long period of time. EUR/USD. The dollar is "stuck" between COVID-19 and Trump 2020-10-16 The US currency is caught in the grip of conflicting fundamental factors: the increase in risk-off sentiment due to the coronavirus surge in Europe and the political uncertainty in the United States, which restricts the dollar bulls to fully show their character. The dollar index came close to the 94th figure yesterday, but at the end of the day it retreated from the reached highs. And during the Asian session on Friday it was trading flat — in the range of 92.77-92.82. 
Bear in mind that France, which imposed a state of emergency and declared a curfew in the country's largest cities, including Paris, was the trigger for the strengthening of the US currency. Quarantine measures were also tightened in many other EU countries that recorded a sharp spike in the incidence of COVID-19. This relatively reminded the market of the spring events when the European economy experienced the main coronavirus blow. The negative fundamental picture was supplemented by China, which published weak macroeconomic reports (reflecting a slowdown in the consumer price index and the producer price index) yesterday. The reaction of traders was immediate: the dollar, as the main protective asset, began to enjoy increased demand. Panicked investor sentiment allowed the greenback to regain lost positions, although the overall negative background for the dollar remains negative. This is not the first time that such a situation occurred on the market. Recall that not so long ago, the dollar served as almost the only protective tool for several months. During almost the entire spring, traders found refuge in the US currency when anti-risk sentiment surged. Dollar bulls were then the main beneficiaries of the pandemic in the context of the currency market, even despite the record slowdown in the US economy. Since about mid-summer, the topic of coronavirus has narrowed to the borders of one country – the United States – so the former excitement around the greenback has come to naught. The increase in the number of infected people was observed in many other countries of the world, but the States here were out of the competition – instead they led in the number of infected people, the number of deaths, and the number of daily increases in cases. Therefore, the coronavirus factor ceased to be an "ally" of the greenback, and bursts of anti-risk sentiment played in favor of other instruments, primarily in favor of gold. But today, the situation is changing once again in favor of the dollar. The only difference is that there are no liquidity problems in the market, and the dollar itself is under the background pressure of political events in the United States. As a result, dollar bulls cannot take full advantage of the current situation. Last day was somewhat indicative in this context. So, throughout Thursday, the dollar index grew steadily, changing the configuration of the main currency pairs along the way. At the end of the trading day, however, the dollar was reminded that the States are in a state of pre-election race, and in two weeks the fierce struggle for the Oval Office will reach the finish line. It is important to note that Joe Biden is currently considered as the favored one in the race – according to the latest poll conducted by The Wall Street Journal, the democratic leader is ahead of Trump by 11 percentage points (53% vs. 42%). And before the TV debate, the former Vice President of the United States was ahead of the current President in the polls by 8%. To win the presidential election, a candidate must get 270 votes out of 538. Analysts believe that Trump will get 205 college votes. In other words, Biden is highly possible to be declared as the winner of the presidential election – the only question is whether Donald Trump will recognize this result. In an interview, he said that he "does not guarantee a peaceful transfer of power," which alarmed investors. Yesterday, the US President raised this issue again at a meeting with voters, saying that he would hand over power to Biden, but only if "he is sure of a fair election result." For several months, Trump has been criticizing remote voting (due to the pandemic, Americans were allowed not to visit the polling station), stating that such voting is "not controlled." 
Considering the current US President's disposition, it can be assumed that the process of transferring power will be accompanied by numerous lawsuits from the Republican team. The "pre-election factor" is an anchor for the dollar that does not allow it to develop large-scale growth throughout the market. If we talk directly about the euro-dollar pair, the southern momentum has not exhausted itself. The EUR/USD bears have overcome the support level of 1.1750, and from a technical point of view, they are on their way to the main support level of 1.1630 (the lower border of the Kumo cloud coincides with the lower line of the BB indicator on the daily chart). Despite the certain vulnerability of the US currency, the euro looks much weaker, taking into account the recent happenings in European countries. If quarantine measures in the EU countries continue to tighten, the EUR/USD pair will reach 1.1630, not even due to the strengthening of the dollar, but due to the weakening of the European currency. Therefore, short positions are still a priority for the pair. Brief trading recommendations for EUR/USD on 10/16/20 2020-10-16 
The EUR/USD pair showed an active downward interest yesterday. As a result, the important support level of 1.1700 was reached, where it is possible for sellers to weaken the Euro even more than expected. In this case, we should focus our attention to two factors that indicate a weakening of the European currency: 1. The completion of the corrective move from the local low of 1.1612 (1.1612 -> 1.1830), where a recovery relative to the correction is already more than 64%. If there is a recovery by more than 50%, we can expect that the initial interest will continue, and in this case, the downward path set in the market last month. 2. The support level of 1.1700. Regarding the recent fluctuations, the quote is seen to be concentrated within the 1.1690/1.1700 area, which indicates its breakdown in the future. This will lead to the further weakening of the euro. Meanwhile, for the quote's current location, you can see a variable price fluctuation relative to the support level of 1.1700, where there was a slight pullback. Nevertheless, the downward interest still remains on the market. Based on the location of the quote and the reference support level, you can make a trading forecast from several possible market development scenarios. First, the natural basis. The level of 1.1700 acted as a support in the market for a long time, where traders naturally feel pressure, affecting the volume of short positions *(sell positions). The price's current correlation with this level may not be an exception, as the quote will rebound from it again. In this case, we consider the prolongation of the existing pullback towards the range of 1.1735-1.1750, if the price consolidates above 1.1715. Second, a decline is held in the market. The downward move set at the beginning of the trading week is held, which leads to a breakdown of the control level of 1.1700 and a full recovery of the quote relative to the scale of the corrective move 1.1612 -> 1.1830. The level of 1.1685 will be considered as the best entry point, with a prospect of moving to 1.1650-1.1615. 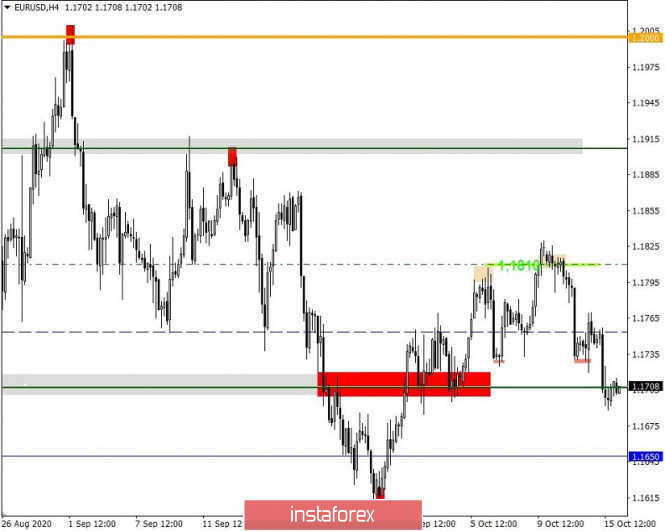
Trading plan for the EUR/USD pair on October 16. Second pandemic wave and the US elections. 2020-10-16 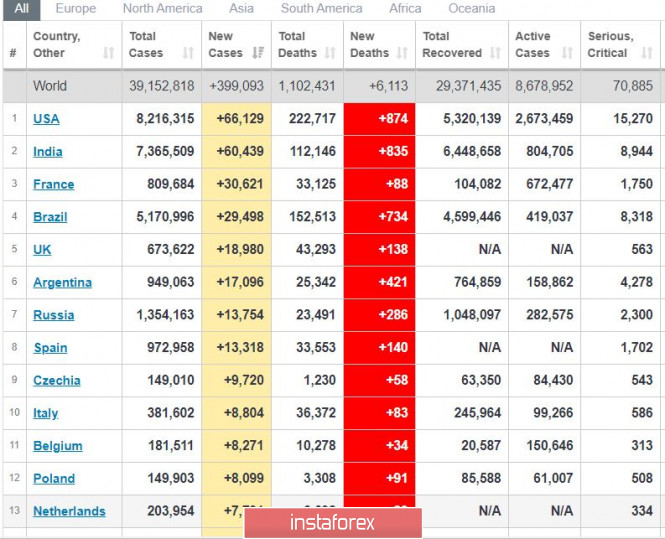
The situation is still bad in Europe. As of the moment, France has recorded 30 thousand new coronavirus patients, much higher than the figure it listed a day ago. Meanwhile, the United Kingdom has observed a slight decrease in new cases to 19 thousand, while in Spain, it increased to 13 thousand. 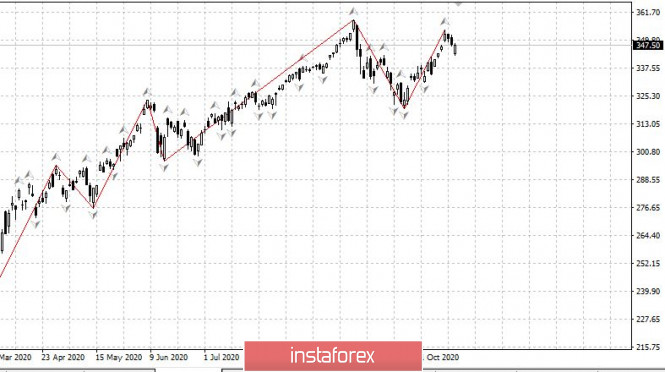
The S&P 500 index shows that the US market has bounced up sharply. However, it is unlikely to move further before the November elections. 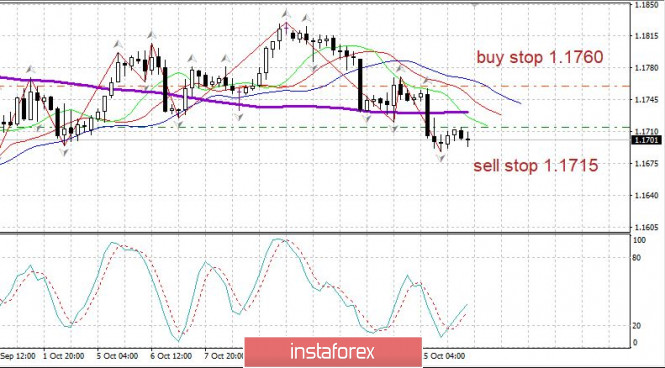
EUR/USD: The euro declined after a strong US employment report yesterday. Open short positions from 1.1715. Open long positions from 1.1760. GBP/USD: Is Brexit an ally or an opponent for the pound? 2020-10-16  The pound is facing a problem again – will Brexit be an opponent that will hinder its growth or will it be an ally that can help discover new opportunities? Experts believe that the role of Brexit is not only limited to the pound's negativity. Rather, it could also be an impulse for its positive dynamics. The Brexit deadline had a controversial impact on the pound. It should be noted that the deadline for agreeing on a transitional period between London and Brussels ended yesterday. The pound was growing steadily up to this point and even took the lead in trading during the middle of the week. However, it lost the majority of its share yesterday, being in a state of uncertainty ahead of trade negotiations with European leaders. An additional negative factor was the introduced tightening measures of the British authorities, relative to the second wave of COVID-19. 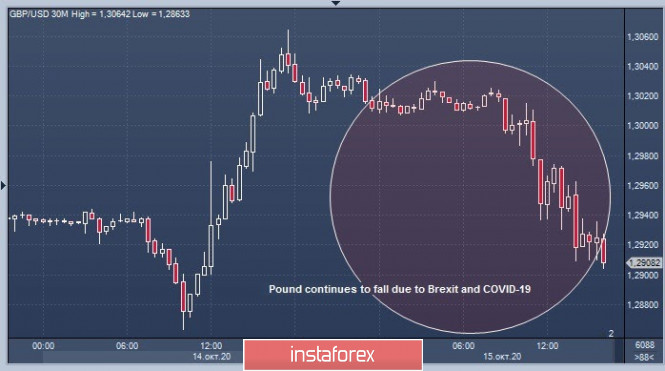 A pause in trade negotiations also worsened the situation, which affected the pound again. Today, it continues to suffer losses due to the growing cases of COVID-19, and against the background of stalled negotiations with Brussels. Thus, European leaders are seriously concerned about the lack of progress on critical issues related to economic engagement with the UK. The strengthening of the conflicting issues hindered the growth of the pound: it fell to 0.4% to 1.2961 on Wednesday and to - 0.7%, to a critical low of 1.2910 on Thursday. Moreover, the decline of the GBP/USD pair continues today, entering a downward spiral which hasn't stopped yet. It started at the level of 1.2890 this morning and currently moves around the range of 1.2893-1.2894, making traders hopeful for a small upward movement. On the other hand, analysts are worried for a potential negative scenario given that both parties will not manage to reach an agreement. In such circumstances, the UK has to talk to other countries of the Eurobloc under the rules of the WTO, and this will cause a significant blow to the European and British economies. Such a result will be disastrous for the GBP: the national currency will be under the pressure of a strongly negative impact. A stumbling block for London and Brussels is still the point related to the regulation of fishing. The market expects concessions from the EU on this issue, and the UK is expected to compromise on a number of trade positions. Many experts are optimistic and believe that the parties will be able to reach an agreement in the near future. According to them, the continuation of negotiations is a good sign for the pound, but in order for the pound to strongly rise, their successful completion is necessary. Yet, some analysts say that Brexit may be the next step for the price of the pound to conquer new peaks. Despite the number of contradictions between the UK and the EU, it does not prevent the pound from choosing a favorable direction. Experts believe that Brexit may take on an unusual role – to become a driver of the pound's growth in the medium and long term. Indicator analysis. Daily review for the GBP/USD currency pair 10/16/20 2020-10-16 Trend analysis (Fig. 1). Today, the market from the level of 1.2911 (closing of yesterday's daily candle) will try to continue moving down with the target of 1.2883 – the support line (red bold line). When this line will be reached, the price can start moving up with the next target of 1.2983 – a pullback level of 38.2% (blue dotted line). In testing this level, a further work going up with the target of 1.3083 is the upper fractal (red dotted line). 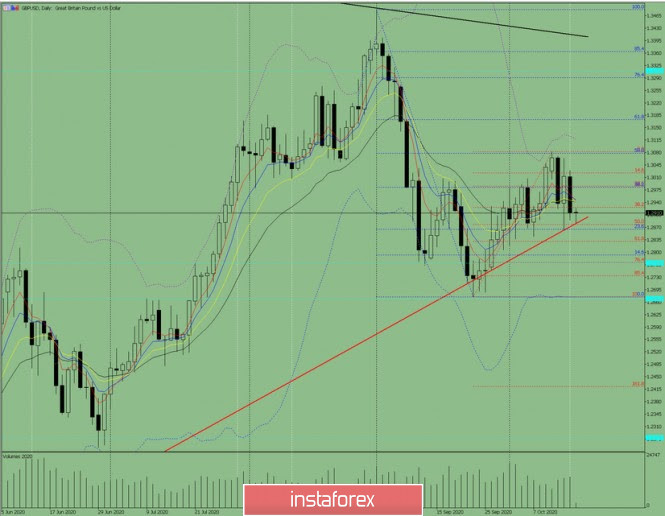 Figure 1 (daily chart). Complex Analysis: General Conclusion: Today, the price from the level of 1.2911 (closing of yesterday's daily candle) will try to continue moving down with the target of 1.2883 – the support line (red bold line). When this line will be reached, the price can start moving up with the next target of 1.2983 – a pullback level of 38.2% (blue dotted line). In testing this level, a further work going up with the target of 1.3083 is the upper fractal (red dotted line). Alternative scenario: when moving down and testing the support line 1.2883 (red bold line), the continuation of the downward movement to the next target 1.2831 is a rollback level of 61.8% (red dotted line). Technical analysis of GBP/USD for October 16, 2020 2020-10-16 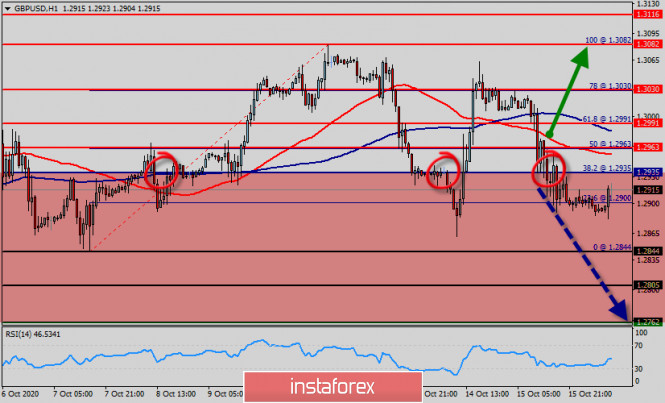 Overview : The GBP/USD pair was trading around the area of 1.2935 a week ago. Today, the level of 1.2935 represents a weekly pivot point in the H1 time frame. The pair has already formed minor resistance at 1.2935 and the strong resistance is seen at the level of 1.3030 because it represents the weekly resistance 1. So, major resistance is seen at 1.3030, while immediate support is found at 1.2900. This resistance (1.3030) has been rejected two times confirming the validity of a downtrend. Please notice that this scenario will be invalidated if the price reverses above the wave 2 highs at the level of 1.3030. If the pair closes below the weekly pivot point of 1.4478, the GBP/USD pair may resume it movement to 1.2900 to test the weekly support 1. From this point, we expect the GBP/USD pair to move between the levels of 1.2963 and 1.2762. Equally important, the RSI is still calling for a strong bearish market, because the Relative Strength Index on the one-hour chart is flirting with the 30 level – nearing oversold conditions. As well as the current price is also below the moving average 100. Momentum remains to the downside and the GBP/USD pair is trading below the 100 and 50 Simple Moving Averages. The GBP/USD pair has broken key support at the levels of 1.2991 and 1.2963, time to sell right now around the spot of 1.2963 - 1.2935. Price has finally broken our ascending support line triggering a strong bearish drop as expected from the are of 1.2963 - 1.2935. We look to sell on strength below major resistance at 1.3030. As a result, sell below the weekly pivot point of 1.2935 with targets at 1.2844 and 1.2805 in order to form a double bottom. Nevertheless, stop loss should always be taken into account, accordingly, it will be of beneficial to set the stop loss above the last bullish wave at the level of 1.3030. But, we still expect the bearish trend for the upcoming sessions as long as the price is below the 1.3030 price. Conclusion : If the GBP/USD pair is able to break out the first support at 1.2935, the market will decline further to 1.2844. In the H1 time frame, the pair will probably go down because the downtrend is still strong. Consequently, the market is likely to show signs of a bearish trend. Hence, it will be good to sell below the level of 1.2935 with the first target at 1.2900 and further to 1.2844, then 1.2805. Since there is nothing new in this market, it is not bullish yet. Sell deals are recommended below the level of 1.2935 with the targets indicated above. Major support is already set at the point of 1.2762. The pair is likely to move downwards continuing the development of a bearish trend to the level of 1.2762 in order to test the weekly support 3. Technical analysis of USD/JPY for October 16, 2020 2020-10-16 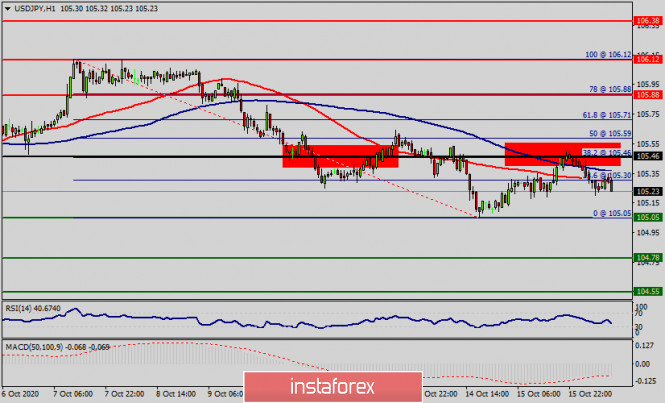 Overview : On the one-hour chart, the USD/JPY pair continues moving in a bearish trend from the resistance level of 105.46. The USD/JPY pair has broken support at the level of 105.46, which acts as resistance now. So, the pair has already formed minor support at 105.46. Currently, the price is in a bearish channel. This is confirmed by the RSI indicator signaling that we are still in a bearish trending market. Therefore, there is a possibility that the USD/JPY pair will move downside and the structure of a fall does not look corrective. The trend is still below the 100 EMA for that the bearish outlook remains the same as long as the 100 EMA is headed to the downside. Moreover, the moving average (100) starts signaling a downward trend; therefore, the market is indicating a bearish opportunity below 105.46. Amid the previous events, the price is still moving between the levels of 105.88 and 104.55. If the USD/JPY pair fails to break through the resistance level of 105.46, the market will decline further to 105.05 as as the first target. The bias remains bearish in the nearest term testing 105.30 and 105.05. Immediate resistance is seen around 105.46 levels, which coincides with the weekly pivot. Thus it will be good to sell at 105.46 with the first target of 105.05. It will also call for a downtrend in order to continue towards 104.78. The strong weekly support is seen at 104.55. Also, the double bottom is seen at the level of 105.05. If the trend is buoyant, then the currency pair strength will be defined as following: USD is in an uptrend and JPY is in a downtrend. However, if a breakout happens at the resistance level of 105.88, then this scenario may be invalidated. On the other hand, if the pair closes above the minor resistance (105.46), the price will fall into the bullish market in order to go further towards the strong resistance at 105.88. Overall, we still prefer the bearish scenario which suggests that the pair will stay below the zone of 105.46/105.88 to day.
Author's today's articles: Sebastian Seliga  Sebastian Seliga was born on 13th Oсtober 1978 in Poland. He graduated in 2005 with MA in Social Psychology. He has worked for leading financial companies in Poland where he actively traded on NYSE, AMEX and NASDAQ exchanges. Sebastian started Forex trading in 2009 and mastered Elliott Wave Principle approach to the markets by developing and implementing his own trading strategies of Forex analysis. Since 2012, he has been writing analitical reviews based on EWP for blogs and for Forex websites and forums. He has developed several on-line projects devoted to Forex trading and investments. He is interested in slow cooking, stand-up comedy, guitar playing, reading and swimming. "Every battle is won before it is ever fought", Sun Tzu Sebastian Seliga was born on 13th Oсtober 1978 in Poland. He graduated in 2005 with MA in Social Psychology. He has worked for leading financial companies in Poland where he actively traded on NYSE, AMEX and NASDAQ exchanges. Sebastian started Forex trading in 2009 and mastered Elliott Wave Principle approach to the markets by developing and implementing his own trading strategies of Forex analysis. Since 2012, he has been writing analitical reviews based on EWP for blogs and for Forex websites and forums. He has developed several on-line projects devoted to Forex trading and investments. He is interested in slow cooking, stand-up comedy, guitar playing, reading and swimming. "Every battle is won before it is ever fought", Sun Tzu Stanislav Polyanskiy  Graduated from Odessa State Economic University. On Forex since 2006. Writes analytical reviews about international financial markets for more than 3 years. Worked as a currency analyst in different finance companies for a long time including the biggest companies of Russia and Ukraine. Graduated from Odessa State Economic University. On Forex since 2006. Writes analytical reviews about international financial markets for more than 3 years. Worked as a currency analyst in different finance companies for a long time including the biggest companies of Russia and Ukraine. Irina Manzenko  Irina Manzenko Irina Manzenko Vladislav Tukhmenev  Vladislav graduated from Moscow State University of Technologiy and Management. He entered the forex market in early 2008. Vladislav is a professional trader, analyst, and manager. He applies a whole gamut of analysis – technical, graphical, mathematical, fundamental, and candlestick analysis. Moreover, he forecasts the market movements using his own methods based on the chaos theory. Vladimir took part in development of trading systems devoted to fractal analysis. In his free time, Vladimir blogs about exchange markets. Hobbies: active leisure, sporting shooting, cars, design, and marketing. "I do not dream only of becoming the best in my field. I also dream about those who I will take with me along the way up." Vladislav graduated from Moscow State University of Technologiy and Management. He entered the forex market in early 2008. Vladislav is a professional trader, analyst, and manager. He applies a whole gamut of analysis – technical, graphical, mathematical, fundamental, and candlestick analysis. Moreover, he forecasts the market movements using his own methods based on the chaos theory. Vladimir took part in development of trading systems devoted to fractal analysis. In his free time, Vladimir blogs about exchange markets. Hobbies: active leisure, sporting shooting, cars, design, and marketing. "I do not dream only of becoming the best in my field. I also dream about those who I will take with me along the way up." Mihail Makarov  - - l Kolesnikova  text text Sergey Belyaev  Born December 1, 1955. In 1993 graduated from Air Force Engineering Academy. In September 1999 started to study Forex markets. Since 2002 has been reading lectures on the technical analysis . Is fond of research work. Created a personal trading system based on the indicator analysis. Authored the book on technical analysis "Calculation of the next candlestick". At present the next book is being prepared for publishing "Indicator Analysis of Forex Market. Trading System Encyclopedia". Has created eleven courses on indicator analysis. Uses classical indicators. Works as a public lecturer. Held numerous seminars and workshops presented at international exhibitions of financial markets industry. Is known as one of the best specialists in the Russian Federation researching indicator analysis. Born December 1, 1955. In 1993 graduated from Air Force Engineering Academy. In September 1999 started to study Forex markets. Since 2002 has been reading lectures on the technical analysis . Is fond of research work. Created a personal trading system based on the indicator analysis. Authored the book on technical analysis "Calculation of the next candlestick". At present the next book is being prepared for publishing "Indicator Analysis of Forex Market. Trading System Encyclopedia". Has created eleven courses on indicator analysis. Uses classical indicators. Works as a public lecturer. Held numerous seminars and workshops presented at international exhibitions of financial markets industry. Is known as one of the best specialists in the Russian Federation researching indicator analysis. Mourad El Keddani  Was born in Oujda, Morocco. Currently lives in Belgium. In 2003 obtained B.S. in Experimental Sciences. In 2007 obtained a graduate diploma at Institut Marocain Specialise en Informatique Applique (IMSIA), specialty – Software Engineering Analyst. In 2007–2009 worked as teacher of computer services and trainer in a professional school specializing in computer technologies and accounting. In 2005 started Forex trading. Authored articles and analytical reviews on Forex market on Forex websites and forums. Since 2008 performs Forex market research, and develops and implements his own trading strategies of Forex analysis (especially in Forex Research & Analysis, Currency Forecast, and Recommendations and Analysis) that lies in: Numerical analysis: Probabilities, equations and techniques of applying Fibonacci levels. Classical analysis: Breakout strategy and trend indicators. Uses obtained skills to manage traders' accounts since 2009. In April 2009 was certified Financial Technician by the International Federation of Technical Analysts. Winner of several social work awards: Education Literacy and Non-Formal Education (in Literacy and Adult Education in The National Initiative for Human Development). Was born in Oujda, Morocco. Currently lives in Belgium. In 2003 obtained B.S. in Experimental Sciences. In 2007 obtained a graduate diploma at Institut Marocain Specialise en Informatique Applique (IMSIA), specialty – Software Engineering Analyst. In 2007–2009 worked as teacher of computer services and trainer in a professional school specializing in computer technologies and accounting. In 2005 started Forex trading. Authored articles and analytical reviews on Forex market on Forex websites and forums. Since 2008 performs Forex market research, and develops and implements his own trading strategies of Forex analysis (especially in Forex Research & Analysis, Currency Forecast, and Recommendations and Analysis) that lies in: Numerical analysis: Probabilities, equations and techniques of applying Fibonacci levels. Classical analysis: Breakout strategy and trend indicators. Uses obtained skills to manage traders' accounts since 2009. In April 2009 was certified Financial Technician by the International Federation of Technical Analysts. Winner of several social work awards: Education Literacy and Non-Formal Education (in Literacy and Adult Education in The National Initiative for Human Development).
Languages: Arabic, English, French and Dutch.
Interests: Algorithm, Graphics, Social work, Psychology and Philosophy.
Subscription's options management Theme's:
Fundamental analysis, Fractal analysis, Wave analysis, Technical analysis, Stock Markets
Author's :
A Zotova, Aleksey Almazov, Alexander Dneprovskiy, Alexandr Davidov, Alexandros Yfantis, Andrey Shevchenko, Arief Makmur, Dean Leo, Evgeny Klimov, Fedor Pavlov, Grigory Sokolov, I Belozerov, Igor Kovalyov, Irina Manzenko, Ivan Aleksandrov, l Kolesnikova, Maxim Magdalinin, Mihail Makarov, Mohamed Samy, Mourad El Keddani, Oleg Khmelevskiy, Oscar Ton, Pavel Vlasov, Petar Jacimovic, R Agafonov, S Doronina, Sebastian Seliga, Sergey Belyaev, Sergey Mityukov, Stanislav Polyanskiy, T Strelkova, Torben Melsted, V Isakov, Viktor Vasilevsky, Vladislav Tukhmenev, Vyacheslav Ognev, Yuriy Zaycev, Zhizhko Nadezhda
Edit data of subscription settings
Unsubscribe from the mailing list Sincerely,
Analysts Service | If you have any questions, you can make a phone call using one of the
InstaForex Toll free numbers right now:
|  | InstaForex Group is an international brand providing online trading services to the clients all over the world. InstaForex Group members include regulated companies in Europe, Russia and British Virgin Islands. This letter may contain personal information for access to your InstaForex trading account, so for the purpose of safety it is recommended to delete this data from the history. If you have received this letter by mistake, please contact InstaForex Customer Relations Department. |


No comments:
Post a Comment