| Elliott wave analysis of EUR/JPY for October 29, 2020 2020-10-29 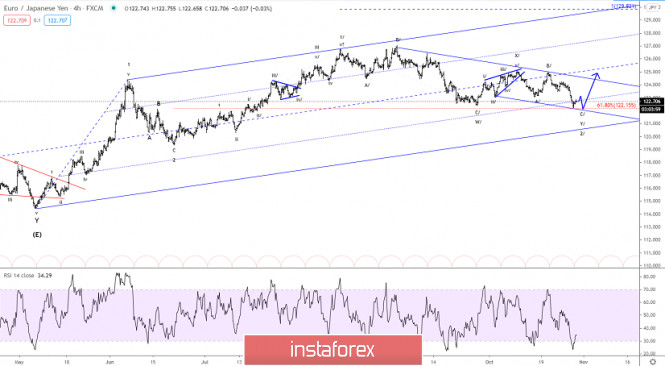
Risk-off sentiment dominated the financial markets yesterday after many European countires announced new lock-downs in their efforts to curb the spread of the coronavirus. EUR weakened amid such news while JPY gained momentum, which clearly was seen in yesterdays price-action. EUR/JPY broke key-support at 123.38 and declined to a low of 122.15 which is the 61.8% corrective target of wave 1/. The low of wave 2/ and be the tne very early stages of a new stong impulsive rally in wave 3/ towards 129.86. A retest and maybe even a slight break below support at 122.15 can't be excluded before wave 2/ finally completes and wave 3/ is ready to take over. R3: 123.49 R2: 123.17 R1: 122.89 Pivot: 122.64 S1: 122.48 S2: 122.25 S3: 122.15 Trading recommendation: We will buy EUR at 122.25 or upon a break above 122.95. If our buy order at 122.25 is filled, we will place our stop at 121.75. Elliott wave analysis of GBP/JPY for October 29, 2020 2020-10-29 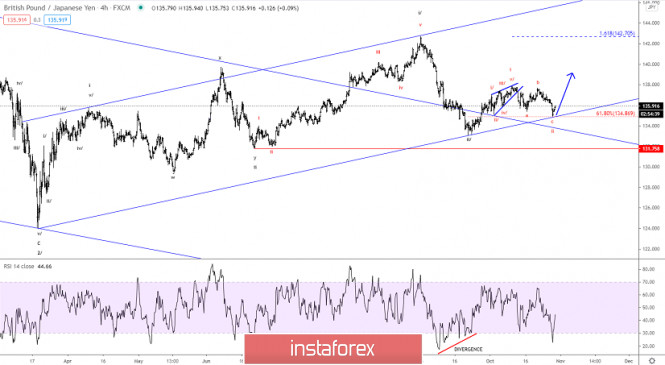
Risk-off sentiment dominated the financial markets yesterday after many European countries announced new lock-downs in their efforts to curb the coronavirus. EUR weakened amid such news while JPY rose, which clearly was seen in yesterdays price-action. GBP/JPY broke a key support at 136.26 which called for more downside pressure towards 135.37 and 135.18. GBP/JPY did more than that and bottomed at the 61.8% corrective target of wave i/ at 134.86. After bottoming at 134.86, GBP/JPY grew significantly indicating a solid bottom could be in place and wave iii/ finally being in motion. To confirm this is the case, we need a break above resistance at 136.50. Only a break below support at 135.24 will indicate that wave ii/ still is in motion and a new test of support at 134.86 should be expected, but the potential downside may be limited now. R3: 136.50 R2: 136.17 R1: 135.92 Pivot: 135.79 S1: 135.61 S2: 135.24 S3: 134.86 Trading recommendation: We took 50% profit off our short position from 136.20 at 135.45 and we will sell the final 50% here at 135.92 for an average of 135.69. We will re-buy GBP at 135.70 or upon a break above 136.55 EUR/USD: plan for the European session on October 29. COT reports. Germany steps up quarantine measures, euro under pressure 2020-10-29 To open long positions on EUR/USD, you need: The euro was under pressure yesterday despite the absence of important fundamental reports, as things in the eurozone countries are gradually deteriorating amid the spread of the second wave of coronavirus. In Germany, Chancellor Angela Merkel announced a partial lockdown with the closure of bars, restaurants and other public places. As for yesterday's deals, the morning sale was more successful. The 5-minute chart clearly shows how, after breaking through the 1.1761 level, the bulls tried to return the market to their side, but testing this area from the bottom up formed a new signal to open short positions in order to continue the current downward trend, which caused the pair to fall to the support area of 1.1732. I recommended opening long positions immediately on a rebound from this level, counting on a correction of 15-20 points, which is what happened. The bears formed a breakout and settled below this range in the afternoon, however, a larger downward movement did not take place, as a result of which the pair returned back to the resistance of 1.1761, which is currently being traded around. 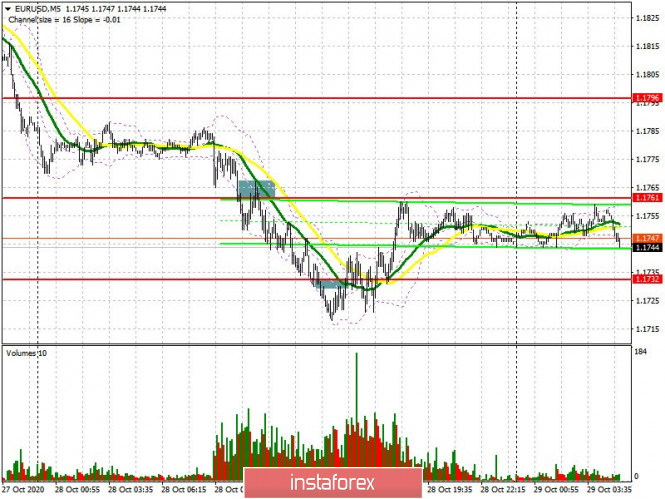 Focus will be on resistance at 1.1761. Buyers need to settle above this range in order to return the bull market. Testing the 1.1761 area from top to bottom generates a signal to buy EUR/USD in order to hit a high of 1.1796, where I recommend taking profits. The 1.1835 level will be the next target. However, a lot will depend on the European Central Bank's decision on interest rates. The pressure on the euro will return in case stimulus programs are expanded and rates are lowered. Therefore, forming a false breakout at the 1.1723 level in the first half of the day will be a signal to open long positions. In the scenario of a breakout of this range, I do not recommend rushing to buy. Updating support at 1.1688 and forming a false breakout there will allow the bulls to count on some upward correction of the pair, or at least a temporary stop in the bear market. I recommend opening long positions immediately on a rebound from a low of 1.1644 with the aim of a rebound of 15-20 points within the day. The Commitment of Traders (COT) report for October 20 recorded an increase in long positions and short ones. However, there were more of the latter, which led to an even greater decrease in the positive delta. Despite this, the buyers of risky assets believe in the continuation of the bull market, but prefer to act with caution, as there is no good news for the eurozone yet. Thus, long non-commercial positions increased from 228,295 to 229,878, while short non-commercial positions increased from 59,658 to 63,935. The total non-commercial net position decreased to 165,943, against 168,637 a week earlier.... However, the bullish sentiment for the euro remains rather high in the medium term. The more the euro falls against the US dollar at the end of this year, the more attractive it is for new investors. To open short positions on EUR/USD, you need: The sellers' should protect resistance at 1.1761, slightly above which the moving averages pass, playing on the bears' side. Considering that the trend is downward, it is better to bet that it will continue today, since the ECB's decisions may negatively affect the euro. Forming a false breakout in the 1.1761 area forms a new entry point for short positions, and the main target will be a breakout and having to settle below the 1.1723 level. Testing it from the bottom-up, similar to yesterday's sale, which I analyzed a little higher, generates an additional signal to open short positions in euros, which will lead to a larger sale in the area of the low of 1.1688. The 1.1644 level will be the next goal, where I recommend taking profits. If the pair rises above 1.1761 and there is no bears' activity there, I recommend postponing short positions and selling the euro immediately on a rebound from yesterday's resistance at 1.1796, counting on a correction of 15-20 points within the day. 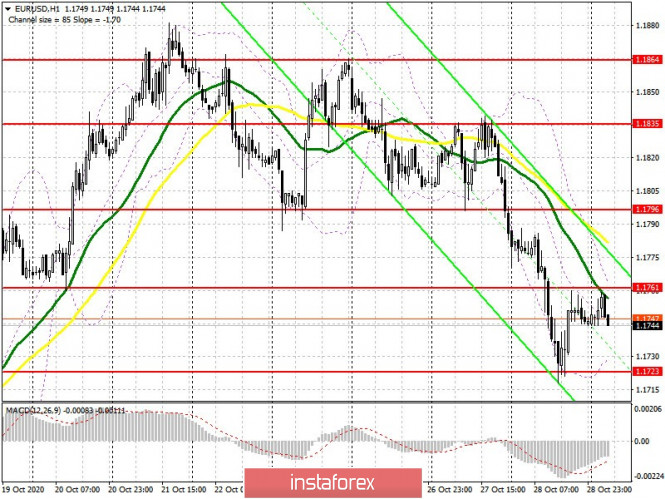 Indicator signals: Moving averages Trading is under the 30 and 50 moving averages, indicating a resumption of the bear market. Note: The period and prices of moving averages are considered by the author on the H1 hourly chart and differs from the general definition of the classic daily moving averages on the D1 daily chart. Bollinger Bands A breakout of the lower border of the indicator around 1.1723 will increase pressure on the euro. A breakout of the upper border of the indicator in the 1.1761 area will lead to a small upward correction of the pair. Description of indicators - Moving average (moving average, determines the current trend by smoothing out volatility and noise). Period 50. It is marked in yellow on the chart.
- Moving average (moving average, determines the current trend by smoothing out volatility and noise). Period 30. It is marked in green on the chart.
- MACD indicator (Moving Average Convergence/Divergence — convergence/divergence of moving averages) Quick EMA period 12. Slow EMA period to 26. SMA period 9
- Bollinger Bands (Bollinger Bands). Period 20
- Non-commercial speculative traders, such as individual traders, hedge funds, and large institutions that use the futures market for speculative purposes and meet certain requirements.
- Long non-commercial positions represent the total long open position of non-commercial traders.
- Short non-commercial positions represent the total short open position of non-commercial traders.
- Total non-commercial net position is the difference between short and long positions of non-commercial traders.
GBP/USD: plan for the European session on October 29. COT reports. Pound buyers losing their nerves, no positive news on trade talks 2020-10-29 To open long positions on GBP/USD, you need: The British pound showed its best side yesterday. It was not possible to earn money and wait for a signal to open short positions in the morning. The same cannot be said for the afternoon, where a great long entry point was formed. Let's take a look at the 5-minute chart and break it down. If you read yesterday's afternoon review, you will see that I advised you to open long positions immediately on a rebound from support at 1.2919, which is what happened. After the very first test of this level, the pound turned around and rushed back up to the resistance of 1.2997, allowing it to take more than 80 points of profit from the market. 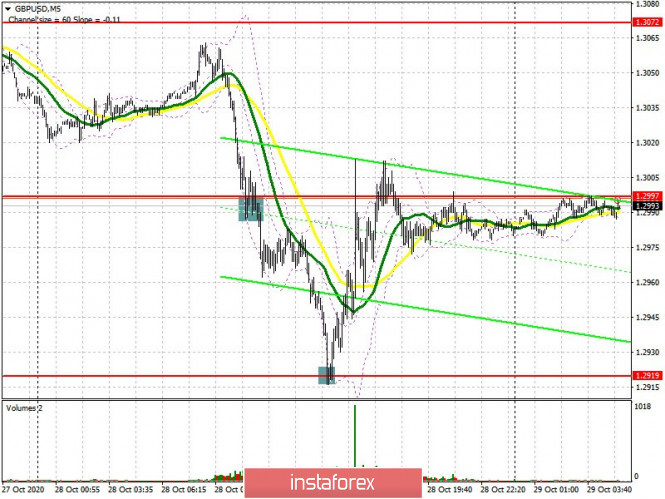 Now for the buyers and today's technical picture. The lack of Brexit news seems to put pressure on the bulls, and as long as the situation remains uncertain, the more likely it is for no compromise between the parties. All that buyers of the pound can expect now is to return resistance at 1.2997, since being able to settle above this level will lead to a buy signal that can return GBP/USD to the resistance area of 1.3058, where I recommend taking profits. A high of 1.3120 will be the next goal, but it will only be possible to reach it if we receive progress in trade talks between the UK and the EU. If the pressure on the pound persists in the first half of the day after the release of a number of fundamental reports on the UK, then I recommend opening long positions again, but only from a large local low of 1.2919, and only if a false breakout is formed there. In case bulls are not active at this level, you can buy GBP/USD from a more recent low of 1.2865, counting on a correction of 20-30 points within the day. The Commitment of Traders (COT) report for October 20 showed a reduction in short positions and a sharp increase in long positions. Long non-commercial positions rose from 36,195 to 39,836. At the same time, short non-commercial positions fell from 45,997 to 41,836. As a result, the negative value of the non-commercial net position slightly increased and reached -2,000, against - 9,802 a week earlier, which indicates that the sellers of the pound retain control and also shows their minimal advantage in the current situation. To open short positions on GBP/USD, you need: The primary task for pound sellers is to protect resistance at 1.2997. Forming a false breakout on it will be a signal to sell the pound in order to continue the current downward trend. Pessimistic news on Brexit could raise pressure on the pair, leading to another fall and a breakout of support at 1.2919. However, you can only open short positions from there, subject to being able to settle below this level and a reverse test from the bottom up, which forms an additional entry point into selling GBP/USD. In this case, aim for a low of 1.2865, where I recommend taking profits. In case GBP/USD grows above the resistance of 1.2997 in the first half of the day, against the background of the release of positive fundamental statistics for the UK, I recommend postponing short deals until we have tested a high of 1.3058, counting on a correction of 20-30 points. 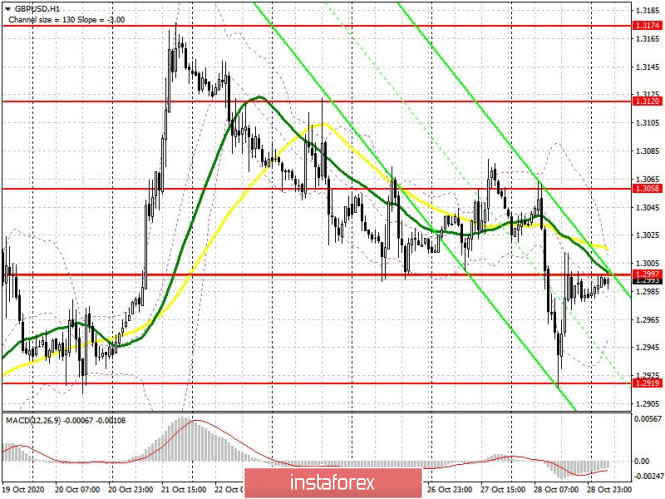 Indicator signals: Moving averages Trading is carried out slightly below the 30 and 50 moving averages, which indicates that the pressure on the pair remains. Note: The period and prices of moving averages are considered by the author on the H1 hourly chart and differs from the general definition of the classic daily moving averages on the D1 daily chart. Bollinger Bands A breakout of the upper border of the indicator in the 1.3000 area will lead to a new wave of growth of the pound. In case the pair falls, support will be provided by the lower border of the indicator in the 1.2955 area. Description of indicators - Moving average (moving average, determines the current trend by smoothing out volatility and noise). Period 50. It is marked in yellow on the chart.
- Moving average (moving average, determines the current trend by smoothing out volatility and noise). Period 30. It is marked in green on the chart.
- MACD indicator (Moving Average Convergence/Divergence — convergence/divergence of moving averages) Quick EMA period 12. Slow EMA period to 26. SMA period 9
- Bollinger Bands (Bollinger Bands). Period 20
- Non-commercial speculative traders, such as individual traders, hedge funds, and large institutions that use the futures market for speculative purposes and meet certain requirements.
- Long non-commercial positions represent the total long open position of non-commercial traders.
- Short non-commercial positions represent the total short open position of non-commercial traders.
- Total non-commercial net position is the difference between short and long positions of non-commercial traders.
Brief trading recommendations for EUR/USD on 10/29/20 2020-10-29 
Yesterday, the EUR/USD pair held the downward tact set by the market earlier. As a result, the quote overcame the variable benchmark of 1.1760 and headed towards the main support level of 1.1700, which reflects the area of 1.1690/1.1710. The current downward interest comes from a number of technical and fundamental factors: First, technical analysis considers the recovery process, relative to the four-week growth of 1.1612 - - - > 1.1880, where sellers have already recovered about 59% of the total scale. Meanwhile, the fundamental analysis comes from the information background regarding the second wave of COVID-19, where news about the tightening of quarantine measures in Europe puts pressure on the European currency. In regards with the quotes' current location, a slight pull back towards the level of 1.1760 can be observed, where there was another slowdown. We can assume that if the price is consolidated below the level of 1.1730, there will be another flow of sellers, which will lead the quote to the area 1.1690//1.1700//1.1710. The sellers' greatest activity will occur after the price consolidates below the level of 1.1690, which will lead to the next recovery stage, that is, towards 1.1650-1.1615. 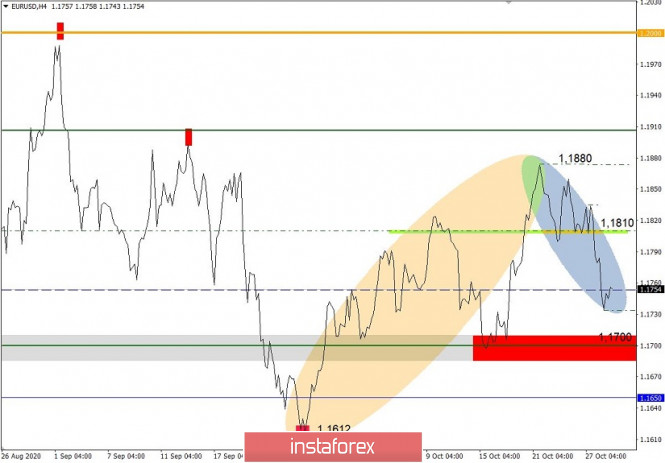
Indicator analysis. Daily review on EUR/USD for October 29, 2020 2020-10-29 The pair resumed its downward movement yesterday. While moving down, the price broke through the support line - 1.1750 (white bold line) and tested the pullback level of 61.8% - 1.1715 (red dotted line). As per the economic calendar, euro news is expected at 08.55, 12.45, and 13.30 UTC, while dollar news is expected at 12.30 and 14.00 UTC. It is possible to recoil the work upwards. Trend analysis (Fig. 1). Today, the market may start moving up from the level of 1.1745 (closing of yesterday's daily candlestick) with the goal of 1.1807, which is a pullback level of 50.0% (blue dotted line). When testing this level, further work up with the goal of 1.1853, which is a pullback level of 61.8% (blue dotted line). Much will depend on the news (12:45 and 13:30 UTC). 
Figure 1 (Daily chart) Comprehensive analysis: - Indicator analysis - up
- Fibonacci levels - up
- Volumes - down
- Candlestick analysis - up
- Trend analysis - up
- Bollinger bands - down
- Weekly chart - down
General conclusion: Today, the market from the level of 1.1745 (closing of yesterday's daily candlestick) may begin moving up with the goal of 1.1807, which is a pullback level of 50.0% (blue dotted line). When testing this level, further work up with the goal of 1.1853, which is a pullback level of 61.8% (blue dotted line). Alternative scenario: from the level of 1.1745 (closing of yesterday's daily candle), the price may start moving up with the target of 1.1757, which is the resistance line (white bold line). When testing this line, further work downward with the goal of 1.1715, which is a pullback level of 61.8% (red dotted line). Technical Analysis of EUR/USD for October 29, 2020 2020-10-29 Technical Market Outlook: The bearish pressure intensify on the EUR/USD as the market makes a new local low at the level of 1.1718 and breaks below the key short-term Fibonacci retracement seen at the level of 1.1761. The bounce from the target level at 1.1724 was shallow and was capped around the level of 1.1759 (lower channel line resistance). Weak and negative momentum supports short-term bearish outlook despite the oversold market conditions. The next target for bears is seen at the level of 1.1710 and 1.1696. Weekly Pivot Points: WR3 - 1.2123 WR2 - 1.1991 WR1 - 1.1943 Weekly Pivot - 1.1823 WS1 - 1.1766 WS2 - 1.1638 WS3 - 1.1589 Trading Recommendations: Since the middle of March 2020 the main trend is on EUR/USD pair has been up, which can be confirmed by almost 10 weekly up candles on the weekly time frame chart and 4 monthly up candles on the monthly time frame chart. The recent correction towards the level of 1.1612 seems to be completed and now market is ready for another wave up. This means any local corrections should be used to buy the dips until the key technical support is broken. The key long-term technical support is seen at the level of 1.1445. The key long-term technical resistance is seen at the level of 1.2555. 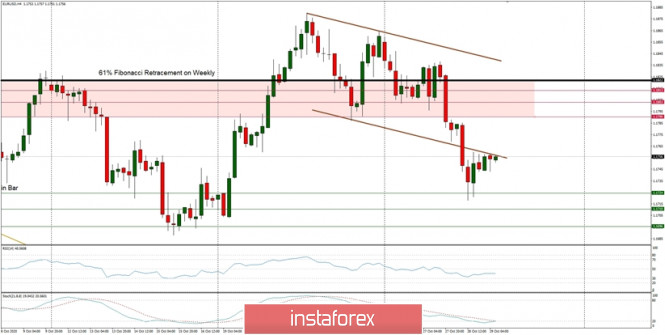
Technical Analysis of GBP/USD for October 29, 2020 2020-10-29 Technical Market Outlook: The GBP/USD pair had bounced from the key short-term technical support located at 1.2916. This level is located inside of the old main ascending channel. Currently, the bulls has managed to make a local high at the level of 1.3024, but this seems to be temporary and market might reverse any time soon. The key technical resistance seen at the level of 1.3078 is still not hit, so the bears might continue the down move. Weekly Pivot Points: WR3 - 1.3465 WR2 - 1.3320 WR1 - 1.3185 Weekly Pivot - 1.3039 WS1 - 1.2902 WS2 - 1.2757 WS3 - 1.2620 Trading Recommendations: The GBP/USD pair is in the down trend on the monthly time frame, but the recent bounce from the low at 1.1411 made in the middle of March 2020 loos very strong and might be a reversal swing. In order to confirm the trend change, the bulls have to break through the technical resistance seen at the level of 1.3518. All the local corrections should be used to enter a buy orders as long as the level of 1.2674 is not broken. 
Trading plan for the EUR/USD pair on October 29. Hard situation with the coronavirus; US market plummets ahead of elections. 2020-10-29 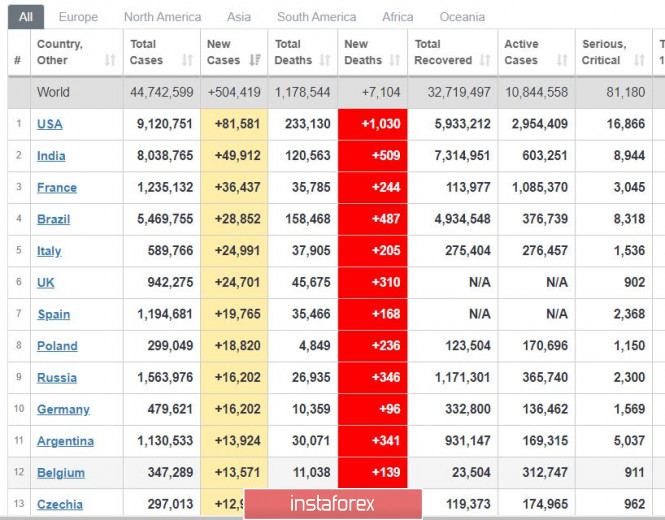
The coronavirus continues to haunt the world, as cases persistently rise in many states. For example, France has recorded 36 thousand new cases per day, while Italy and Britain both listed more than 24 thousand. Spain and Poland jot down 19 thousand, while Germany reported 16 thousand. Because of this, the EU will hold a special summit to discuss the fight against the coronavirus. 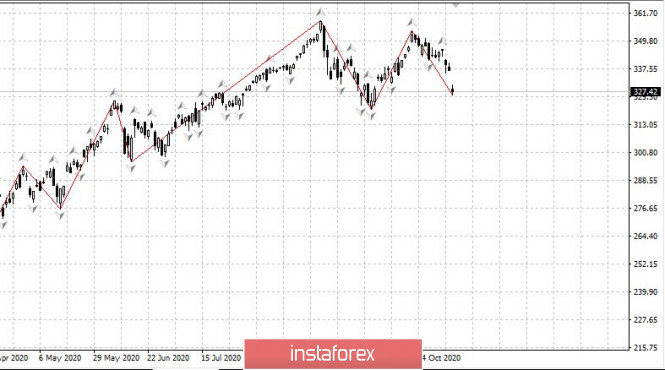
Meanwhile, the US market plunged ahead of the upcoming US elections. Many investors have closed their positions in order to avoid or minimize losses. 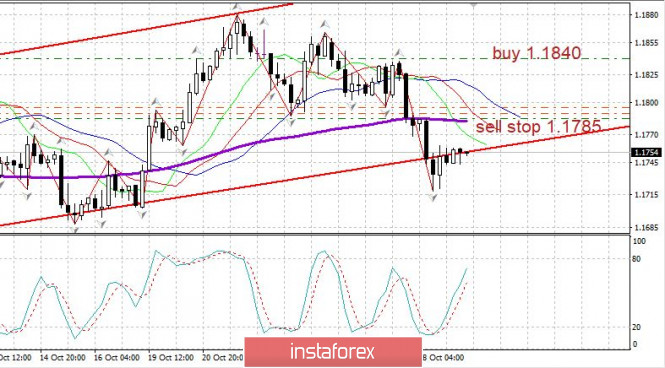
EUR/USD - The euro fell sharply yesterday and, at first glance, broke through the line of the upward channel. However, afterwards, it rebounded strongly in the market, which suggests that perhaps, there will be an upward turn. Set up short positions from 1.1785 to 1.1790. Open long positions from 1.1840. Trading plan for EUR/USD and GBP/USD on 10/29/2020 2020-10-29 There are talks about reintroducing quarantine measures, as soon as the number of new covid cases began to grow rapidly in Europe. This concerned the investors and unfortunately, their fears are getting real. Germany has introduced the so-called limited quarantine, which will take effect on November 2 and there is an assumption that it will be in effect for a month. Angela Merkel said that the government will conduct monitoring in mid-November and a decision will be made on the possible extension of this quarantine based on its results. Of course, unless the COVID-19 situation improves. As Germany is introducing such measures, then other countries of the European Union should also follow. The situation in some countries is significantly worse than in Germany. Therefore, France hastened to follow its neighbor's example and imposed even stricter restrictions. In addition to closing bars and restaurants, shops in France are also closing, except those that sell essential goods. Moreover, severe restrictions on movement are being introduced. In particular, going between regions of France is prohibited. Leaving the house is also not allowed unless urgently needed. But apparently, the current quarantine does not seem so harsh as the one introduced this spring. On the other hand, Italy and Spain will follow Germany and France. According to rumors, Boris Johnson also insists on re-introduction of quarantine measures, but so far, he is meeting with sharp resistance, including from his fellow party members. But looking at what's happening across the channel, the UK is unlikely to avoid re-closure. The worst thing is that amid all this, the business has not yet recovered from the spring quarantine, and small and medium-sized businesses will simply not survive the second. Therefore, it is no surprise that investors are rapidly getting rid of their European assets, including the pound with the euro. 
It is clear that against this background, macroeconomic statistics did not bother anyone at all, especially since it wasn't there yesterday unlike today. For example, data on the lending market is published in the UK, which is expected to be quite good. The only thing that can somehow disappoint is the dynamics of approved mortgage loans, with a forecasted growth of 76,0 thousand. Last month, 84.7 thousand of them were approved. Nevertheless, the volume of consumer lending should grow by 0.7 billion pounds, while the volume of mortgage lending can grow by as much as 3.5 billion pounds. As we can see, the lending market is still growing. However, this does not interest the market at all, since the UK is seriously threatened by the re-introduction of the quarantine. After that, all the current success of the banking sector can be safely ignored. Number of approved mortgages (UK): 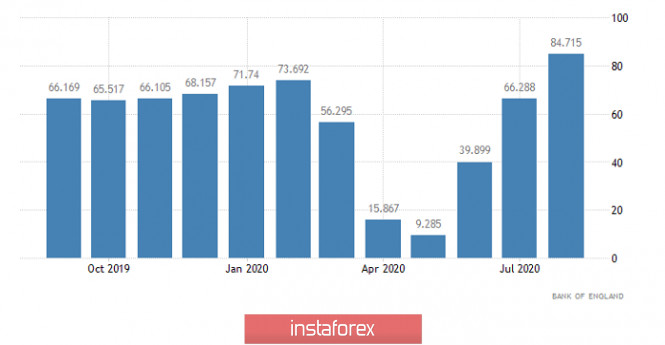
Today's main event will be held in Frankfurt, where ECB's next meeting will take place. The interest rates will remain unchanged, but it doesn't make it any easier. The fact is that when the first quarantine was introduced in the spring, the European Central Bank significantly expanded the program to stimulate the European economy. For this, a separate asset purchase program was created in the form of direct redemption of government bonds. In other words, the ECB has increased the volume of direct financing of the countries of the European Union in the form of monetary easing. This program will operate at least until the end of next year. But considering the COVID-19 situation in Europe, Ms. Lagarde may increase the volume of this program. Although the interest rates will remain unchanged, the printing press will actively work much more. In fact, this is roughly the same as reducing interest rates. The result of such actions will lead to a greater decline in the yield of European bonds, which means that investors need to look for some other places to invest their own funds. 
Looking at the US statistics, the first estimate of the US GDP for the third quarter is being published, which may show that the American economy has grown by 30.0%. This is not surprising, since GDP sank by -31.4% during the Q2. Therefore, this is just a kind of a rebound. This is the reaction of the economy to the end of the quarantine, which was essentially just in the second quarter. Moreover, the number of applications for unemployment benefits is expected to further decline. In particular, the number of initial applications should be reduced from 787 thousand to 750 thousand, while the number of repeated requests may decline from 8,373 thousand to 7,900 thousand. In general, the dollar has clearly reason to grow even without the pandemic. GDP Growth Rate (United States): 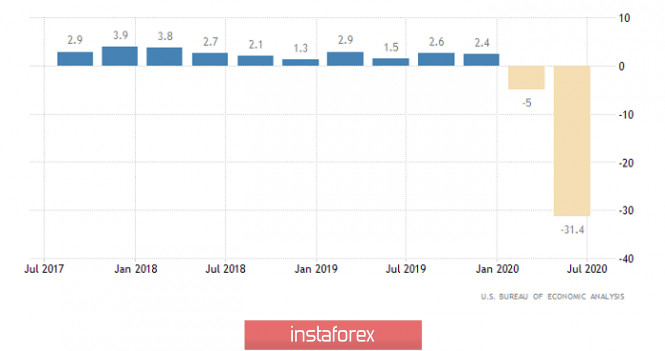
The EUR/USD pair found support at the level of 1.1718, where a stop occured, followed by a pullback. We can assume that if the price hold below 1.1730, there will be another round of short positions below the support level of 1.1700, relative to which the next movement in the market will be clear. 
The GBP/USD pair declined, which resulted in a local surge in short positions that was noticed in the direction of the low (1.2910) on October 20, where the quote found a variable support and how it formed a pullback. We can assume that holding the quote below the level of 1.3000 will give sellers a chance to decline further towards 1.2910-1.2860. Alternatively, a subsequent pullback towards 1.3060 can be considered. 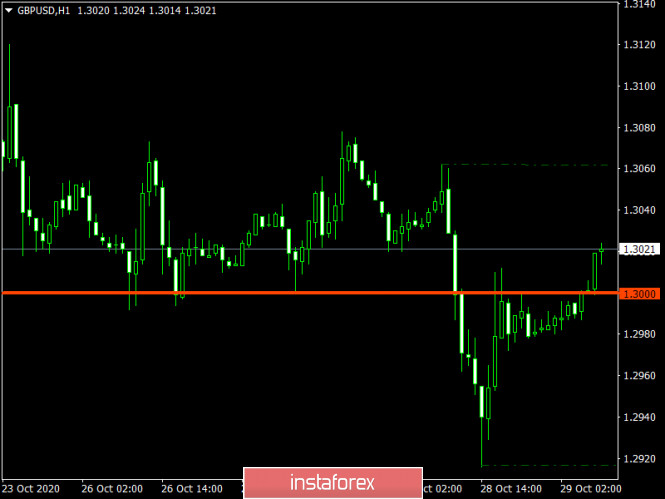
Simplified wave analysis and forecast for GBP/USD, USD/JPY, and EUR/JPY on October 29 2020-10-29 GBP/USD Analysis: Since October 21, the rate of movement of the British pound sterling is set by a downward wave. It corrects the previous bullish trend wave. The price has reached the upper limit of the preliminary target zone. The upward movement that started yesterday has a reversal potential. Forecast: Today, the pair's price is expected to move in the side corridor between the nearest counter zones. After attempts to put pressure on the resistance zone, you can expect a change of course and a repeated decline in the support area. Potential reversal zones Resistance: - 1.3040/1.3070 Support: - 1.2940/1.2910 Recommendations: the British pound will be interesting for trading today only for intraday supporters. It is recommended to make deals with a reduced lot, according to the expected sequence. 
USD/JPY Analysis: The active depreciation of the Japanese yen in the main pair in recent weeks exceeded the correction level in the calculated upward wave. Thus, the updated markup shows an incomplete bearish wave from October 7. In its framework, an incorrect correction is formed from the 21st day. It lacks the final part. Forecast: The probable range of price movement today is limited by counter zones. At the European session, there may be repeated pressure on the support zone. The active growth phase of the exchange rate can be expected by the end of the day or tomorrow. Potential reversal zones Resistance: - 104.80/105.10 Support: - 104.20/103.90 Recommendations: In the conditions of the upcoming flat, trading the yen may be risky. It is safer to wait for the end of the price rise and look for sell signals at the end of it. 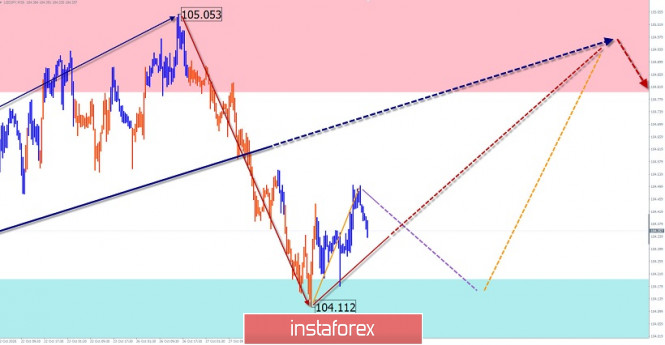
EUR/JPY Analysis: The incomplete bearish wave on the chart of the cross of the Japanese yen to the euro counts down from August 13. Its last section on the main course started on October 9. The structure shows a clear zigzag. Now the final part is being formed. Forecast: In the next trading sessions, you can expect a continuation of the bearish rate. In the European session, a short-term price rise is possible, not above the resistance zone. Calculated support runs along the upper border of the preliminary target zone. Potential reversal zones Resistance: - 123.00/123.30 Support: - 121.90/121.60 Recommendations: There are no conditions for purchases on the pair's market today. In the area of resistance, it is recommended to track the reversal for selling the instrument. 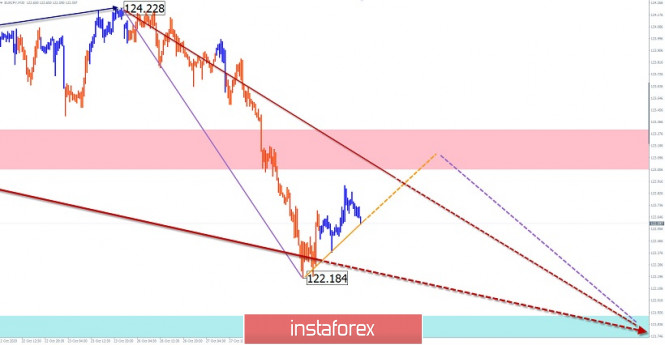
Explanation: In the simplified wave analysis (UVA), waves consist of 3 parts (A-B-C). The last incomplete wave is analyzed. The solid background of the arrows shows the formed structure, and the dotted background shows the expected movements. Note: The wave algorithm does not take into account the duration of the instrument's movements in time! Indicator analysis: Daily review for the GBP/USD currency pair 29/10/2020 2020-10-29 Trend analysis (Fig. 1) Today, the market, from the level of 1.2986 (the closing of yesterday's daily candle) can start working up with the goal of 1.3078 which is a pullback level of 50.0% (blue dotted line). When this level is reached, continue working up with the goal of 1.3173 which is a rollback level of 61.8% (blue dotted line). 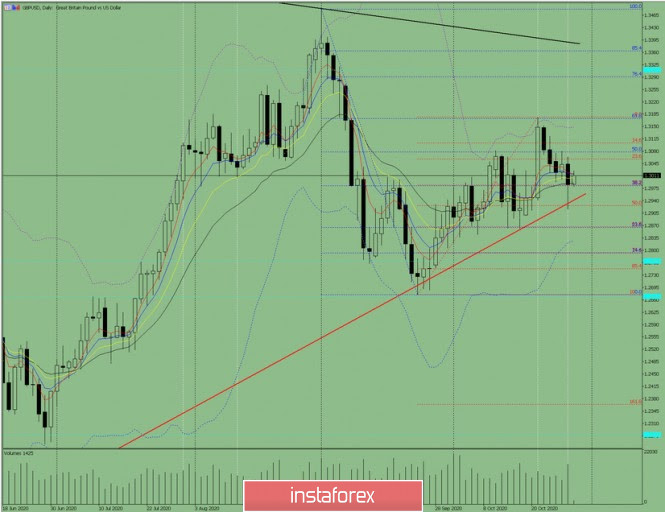 Figure 1 (daily chart) Complex analysis - Indicator Analysis – up
- Fibonacci Levels – up
- Volumes – up
- Candle Analysis – up
- Trend Analysis – up
- Bollinger Bands – up
- Weekly Chart – down
General conclusion: Today the price will try to make an upward movement with the goal of 1.3078 which is a pullback level of 50.0% (blue dotted line). When this level is reached, continue working up with the goal of 1.3173 which is a rollback level of 61.8% (blue dotted line). Alternative scenario: The market will try to move up from the level of 1.2986 (the closing of yesterday's daily candle) with the goal of 1.3078 which is a pullback level of 50.0% (blue dotted line) and go down from this level with the goal of 1.2943 support line (red bold line). EUR/USD: A soft policy will intensify the pressure on the European currency. 2020-10-29 The dollar climbed up in the market yesterday amid a high likelihood of lockdowns in many European states. This puts very serious pressure on investors, who until recently were betting on the strengthening of risky assets, inspired by the positive revision of many economic forecasts. Now, the outlook for German GDP for the 4th quarter is of increasing concern, not to mention other economically weaker countries in the eurozone. 
Contrary to her previous statements, German Chancellor Angela Merkel announced that Germany is closing restaurants and bars to curb the spread of the coronavirus, but will leave shops, schools and kindergartens open. Theaters, fitness studios and cinemas will also be closed for one month, and foreign tourists will not be allowed to stay in hotels. According to Merkel, the current measures are necessary to prevent the further spread of the virus, especially against the background of increasing daily incidences. Then, immediately after the announcement of new restrictive measures, the German government relayed its plans to take a new package of measures worth € 10 billion. This will be done to partially relieve the burden on businesses, but it is unclear yet how it will affect the German economy. As for other European countries, many are also considering new lockdowns amid rising incidence and deaths from COVID-19. According to the latest data from the European Center for Disease Prevention and Control, the number of deaths from coronavirus in the European Union and the United Kingdom is close to 2.39 per million inhabitants. For example, in the US, this indicator is at the level of 2.43. Thus, it is already expected that after Germany, French President Emmanuel Macron will announce new measures aimed at preventing the spread of COVID-19. This week, France recorded a 50% increase in the number of people infected with the coronavirus. This also leads to the conclusion that the ECB will further soften its monetary policy. In this coming summit, many expect Christine Lagarde to shed light on the future of key interest rates, which are in danger of going negative next year. However, this may not be enough, especially in light of what is happening now. The EU could rely on its emergency fund, but it is unlikely to be enough to keep the economy from sinking if the EU undergoes another lockdown. 
Therefore, any hints of a negative interest rate will induce large sell-offs in risky assets and lead to another reallocation of funds towards safe-haven assets, which means that it is unwise to open long positions before the ECB announces its decisions. However, it is also important to know that speculators could take advantage of this moment, since at the upcoming meeting, the ECB is unlikely to announce new stimulus measures, which could lead to a partial rebound of the euro upwards. Nevertheless, at the moment, an upward correction could occur in the EUR/USD pair provided that the quote returns to the resistance level of 1.1761. Such will lead to the demolition of a number of sell stop orders, as well as on the growth of the euro towards the level of 1.1800. And if the ECB does not soften its monetary policy in today's meeting, the pair could reach the highs 1.1880 and 1.1960. But if the policy is softened, the euro will return to the level of 1.1720, and the bears will have an easier time to bring the quote to lows 1.1690 and 1.1640. With regards to the current state of economies, a report published yesterday indicated that German companies are cautiously optimistic about hiring new workers, further confirming the more conservative approach of employers and their attitude towards the future. This data from the Ifo says Germany's employment indicator rose very slightly from 96.3 points to 96.5 points, however, the rising risks associated with the coronavirus will unfortunately put negative pressure on the figure in the future. GBP/USD. October 29. COT report. Another batch of rumors about progress in negotiations between London and Brussels did not help the pound 2020-10-29 GBP/USD – 1H. 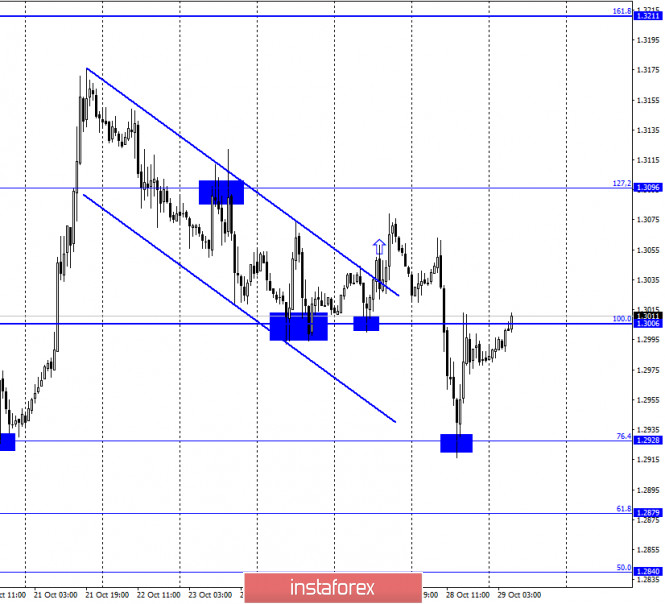
According to the hourly chart, the quotes of the GBP/USD pair fell to the corrective level of 76.4% (1.2928), rebounded from it, and turned in favor of the British with further growth to the Fibo level of 100.0% (1.3006). Fixing the pair's rate above this level will allow traders to expect continued growth in the direction of the next corrective level of 127.2% (1.3096). The British, like the Europeans, continues to trade quite chaotically. If the European clearly shows a side corridor, then the British still have an upward slope, however, it is extremely weak and also looks like a side corridor. Simply put, there is no clear trend right now. Traders are confused and frantically trying to figure out how to trade the pound. Major traders (according to the COT report) are closing more contracts for the British dollar than opening new ones. The information background could help traders, however, it is not available now. Throughout the current week, the markets receive information about progress in negotiations on a trade agreement. Each time, European publications refer to some sources close to the European and British governments. However, it is extremely difficult to judge whether this is true. I would recommend waiting for official information on this issue and not paying attention to rumors. The same opinion is shared by most traders, as the pound continues to trade in different directions. Traders are also wary of rising levels of COVID in the UK. GBP/USD – 4H. 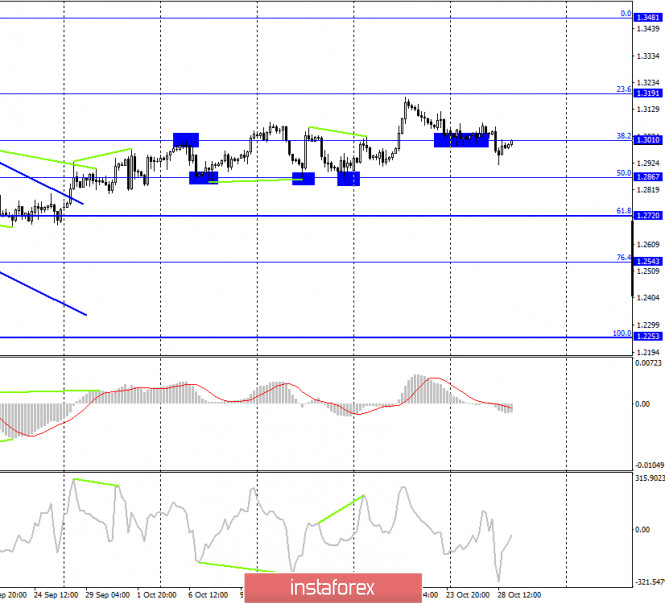
On the 4-hour chart, the GBP/USD pair has secured a corrective level of 38.2% (1.3010), however, it may close above it in the next few hours. Thus, as we can see, the special value of fixing/rebounding is not played now. Traders do not have a clear strategy, thus, the pound moves mainly in different directions. Accordingly, I recommend paying more attention to the lowest chart, the hourly chart, and trading relative to its levels. GBP/USD – Daily. 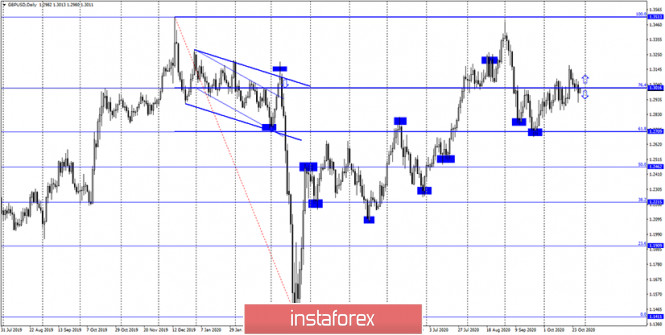
On the daily chart, the pair's quotes were fixed above the corrective level of 76.4% (1.3016), and a couple of days later – below it. So the conclusions are the same as for the 4-hour chart. It is best to trade using the lower chart now. GBP/USD – Weekly. 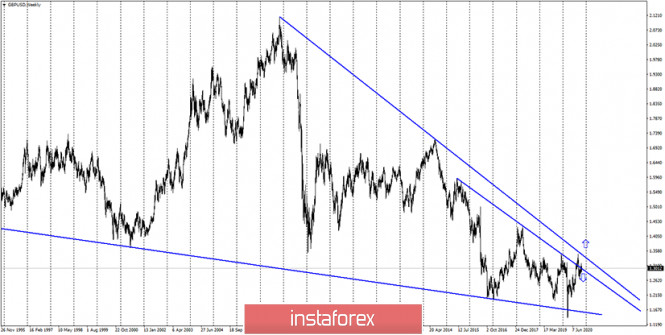
On the weekly chart, the pound/dollar pair closed under the lower downward trend line, thus, a false breakout of this line followed earlier. However, in recent weeks, it has made new attempts to gain a foothold over both trend lines. Overview of fundamentals: On Wednesday, the UK again did not have any economic reports. There was also no official information about the progress of negotiations between the UK and the European Union. News calendar for the US and the UK: US - change in GDP for the quarter (12:30 GMT). US - number of primary and secondary applications for unemployment benefits (12:30 GMT). On October 29, the UK news calendar again does not contain a single report or event, but at any time there may be important information from London about whether Michel Barnier and David Frost have agreed or not this time. Also today, an important report on GDP in America for the third quarter will be released. COT (Commitments of Traders) report: 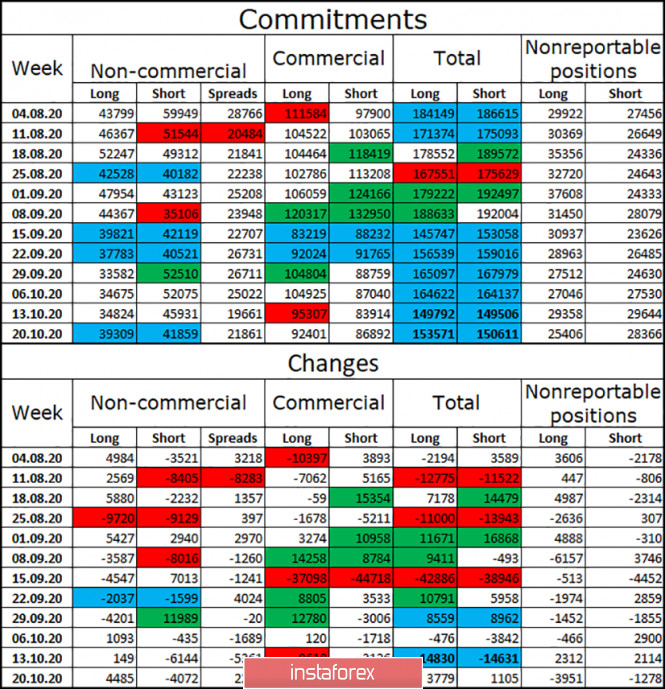
The latest COT report on the British pound that was released last Friday showed that the mood of the "Non-commercial" category of traders has become more "bullish". Speculators immediately increased to 4.5 thousand long-contracts and got rid of 4 thousand short-contracts. Thus, after three weeks of "bearish" advantage, speculators are again inclined to buy the British. However, I believe that such a change in mood does not mean anything specific. In a week or two, major players can start building up short contracts again. And the total number of long and short contracts focused on their hands is almost the same. Thus, I would conclude that the major players are now in disarray. Forecast for GBP/USD and recommendations for traders: Today, I recommend selling the GBP/USD pair with a target of 1.2928, if a new consolidation is made under the corrective level of 100.0% (1.3006) on the hourly chart. I recommend buying the British dollar with a target of 1.3096, as the close was made above the level of 100.0% on the hourly chart. Terms: "Non-commercial" - major market players: banks, hedge funds, investment funds, private, large investors. "Commercial" - commercial enterprises, firms, banks, corporations, companies that buy currency not for speculative profit, but for current activities or export-import operations. "Non-reportable positions" - small traders who do not have a significant impact on the price. Technical analysis of GBP/USD for October 29, 2020 2020-10-29 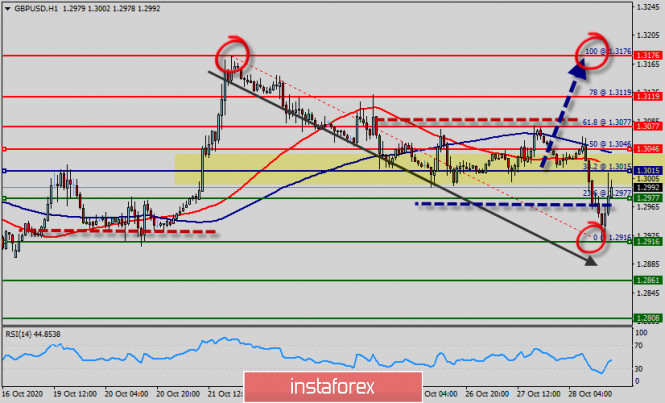 Overview : - Trend : Neutral on H1 chart.
- Pivot point : 1.3015.
Uptrend outlook : The GBP/USD pair is trading around the zone of 1.3015 the level of 1.3015 represents a daily pivot point (key level). The pair has already formed minor resistance at 1.3046 and the strong resistance is seen at the level of 1.3077 because it coincides with the golden ratio (61.8% of Fibonacci retracement level). So, major resistance is seen at 1.3077, while immediate support is found at 1.3046. This resistance (1.3077) has been rejected two times confirming the validity of a downtrend. Please notice that this scenario will be invalidated if the price reverses above the wave 2 highs at the level of 1.3077. If the pair closes below the golden ratio of 1.3077, the GBP/USD pair may resume it movement to 1.2916 to test the double bottom. From this point, we expect the GBP/USD pair to move between the levels of 1.2916 and 1.3077 in coming minutes. Equally important, the RSI is still calling for a strong bearish market, because the Relative Strength Index on the one-hour chart is flirting with the 30 level – nearing oversold conditions. As well as the current price is also below the moving average 100. Momentum remains to the downside and the GBP/USD pair is trading below the 100 and 50 Simple Moving Averages. If the GBP/USD pair will be able to break out key price at the levels of 1.3015, time to buy right now around the spot of 1.3015 - 1.3046. Price has finally broken our ascending support line triggering a strong bearish drop as expected from the are of 1.3015 - 1.3077. We look to sell on strength below major resistance at 1.3077. Beginning of a downward trend (Reason for the trading strategy : technically) : If the GBP/USD pair is able to break out the first support at 1.2977, the market will decline further to 1.2919. In the H1 time frame, the pair will probably go down because the downtrend is still strong. Consequently, the market is likely to show signs of a bearish trend. Hence, it will be good to sell below the level of 1.3015 with the first target at 1.2916 and further to 1.2861, then 1.2808. Since there is nothing new in this market, it is not bullish yet as long as the price is still moving below the pivot (1.3015). Sell deals are recommended below the level of 1.3015 with the targets indicated above. Major support is already set at the point of 1.2916. The pair is likely to move downwards continuing the development of a bearish trend to the level of 1.2861 and 1.2808 in order to test the weekly support 3. However, stop loss should always be taken into account, accordingly, it will be of beneficial to set the stop loss above the last bullish wave at the level of 1.3119. But, we still expect the bearish trend for the upcoming sessions as long as the price is below the 1.3015 price. Important levels : - Resistance 3 : 1.3176
- Resistance 2 : 1.3119
- Resistance 1 : 1.3077
- Pivot point : 1.3015
- Support 1 : 1.2916
- Support 2 : 1.2861
- Support 3 : 1.2808
Trading idea for the EUR/USD pair 2020-10-29 The European Central Bank is scheduled to have a meeting today, during which the members will decide on the regulator's monetary policy, as well as interest rate. 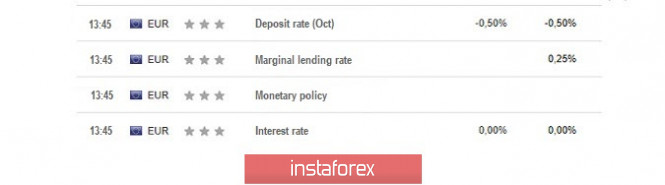 Aside from that, there are also assumptions that the ECB will introduce new stimulus measures, which will lead to more intense pressure for the European currency. If this happens, the euro has a high chance of falling further in price.  In fact, the quotes have already formed an ABC pattern on the daily chart, in which wave A is the downward movement recorded for the last two days. If short positions were continued to be opened in the EUR/USD pair, price will most likely reach the bulls' stops at 1.16900. Of course, risks are also needed to be monitored and controlled to avoid losing profit. As we all know, trading in this market is very precarious and uncertain, but also very profitable if we use the right techniques "Price Action" and "Stop Hunting" were used for the strategy. Good luck! Technical analysis of EUR/USD for October 29, 2020 2020-10-29 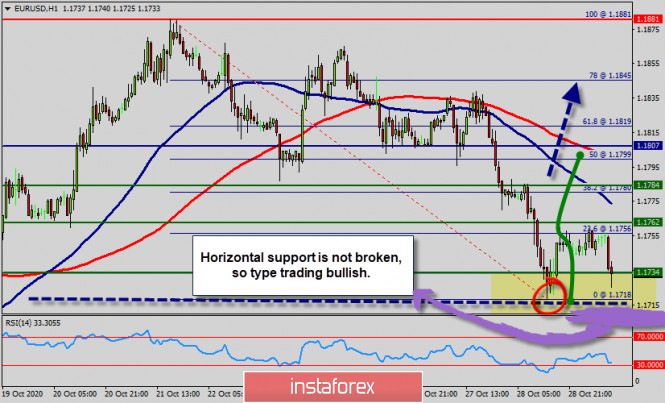 Overview : The major support of the EUR/USD has set at the level of 1.1718. So, horizontal support is not broken yet, probably we will see a strong bounce from the area of 1.1718. So, the strong support has already faced at the level of 1.1718 and the pair is likely to try to approach it in order to test it again and form a double bottom. Hence, the EUR/USD pair is continuing to trade in a bullish trend from the new support level of 1.1718; to form a bullish channel. According to the previous events, we expect the pair to move between 1.1718 and 1.1807. Also, it should be noted major resistance is seen at 1.1807, while immediate resistance is found at 1.1784. Then, we may anticipate potential testing of 1.1762 to take place soon. Moreover, if the pair succeeds in passing through the level of 1.1734, the market will indicate a bullish opportunity above the level of 1.1734. A breakout of that target will move the pair further upwards to 1.1807. Buy orders are recommended above the area of 1.1734 with the first target at the level of 1.1762; and continue towards 1.1784 and 1.1807. This is confirmed by the RSI indicator signaling that we are still in a bullish trending market. The price is still above the moving average (100) and (50), Therefore, if the trend is able to break out through the first resistance level of 1.1734 , we should see the pair climbing towards the daily resistance at 1.1807 to test it. On the other hand, if the EUR/USD pair fails to break out through the resistance level of 1.1807; the market will decline further to the level of 1.1718 so as to return to this last bearish wave. Overall, we still prefer the bullish scenario. Risk management strategy : - - Take profit = 119 pips and Stop loss = 49 pips.
- - Take profit = X.Stop loss <-> X = Take profit / Stop loss <-> 119/49 = 2.43.
- - Risk reward ratio of 1:2.43 is recommended.
Please do not risk any money with any of my strategies before you have proven that you do comprehend it and trade it successfully on demo at least two months. Do not try to retaliate against the market because certainly it will conquer you. Today's sell-offs present buying opportunities for gold and silver in the long term 2020-10-29 
Massive sell-offs were recently observed in gold and silver, and chief market strategist of Blue Line Futures, Phil Streible, said the reason for this is that investors are looking for security outside of precious metals. "The increase of bonds, as well as the rally of the Japanese yen, together with the sharp fall of gold and silver, suggests that investors are looking for security, but not on precious metals," Streible said. To add to that, the restrictions in Europe will necessitate more money to support the EU economy. Thus, the increase of supplies will inevitably lead to the depreciation of the euro. There are also rumors that the ECB will announce new stimulus measures, however, this is actually unlikely to happen since bond purchases remain calm in the markets so far. As for the United States, getting a fiscal stimulus will also be difficult if there is a contested election. And if economic activity continues to grow in the country, the dollar will resume its sharp strengthening in the market. Today, at 8:30 am ET, the Bureau of Economic Analysis will release its preliminary third-quarter gross domestic product (GDP) report, which is expected to reveal good growth amid the rise in personal consumption, which increased by almost 39% in the third quarter. In spite of this though, long-term fundamentals are still with gold. "Although the pendulum is currently swinging against gold and silver, the long-term scenario remains: the Federal Reserve will keep interest rates near zero, which will be an incentive for gold and silver to grow again," Streible said. Thus, today's sell-offs present buying opportunities in the long term. "We should use these pullbacks to gain positions. Being a consensus trader is a big no. Don't chase highs, instead, buy corrections like what we're seeing today. Many may be seeing red, but for me, I see a great thing." Technical analysis of USD/JPY for October 29, 2020 2020-10-29 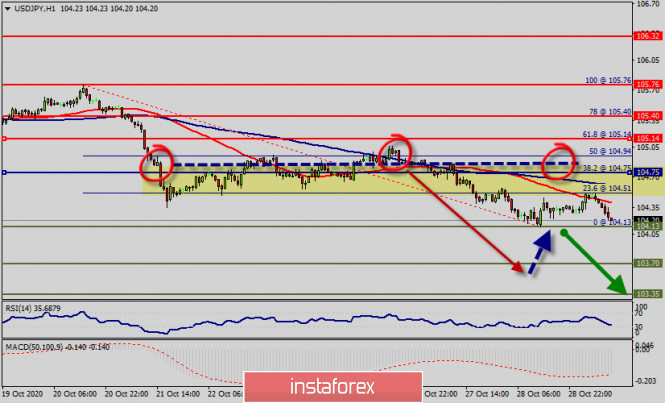 Overview : The USD/JPY pair continues to move downwards from the level of 104.75. Yesterday, the pair dropped from the level of 104.75 to the bottom around 104.13. But the pair has rebounded from the bottom of 104.13 to close at 104.23. Today, the first support level is seen at 104.13, the price is moving in a bearish channel now. Furthermore, the price has been set below the strong resistance at the level of 104.75, which coincides with the 38.6% Fibonacci retracement level. This resistance has been rejected several times confirming the veracity of a downtrend. Additionally, the RSI starts signaling a downward trend. This would suggest a bearish market because the RSI indicator is still in a negative spot and does not show any trend-reversal signs. The pair is expected to drop lower towards at least 104.13 in order to test the last bearish wave of yesterday. Thus, amid the previous events, the price is still moving between the levels of 104.75 and 104.13. If the USD/JPY pair fails to break through the resistance level of 104.75, the market will decline further to 104.13 as as the first target. Therefore, there is a possibility that the USD/JPY pair will move downside and the structure of a fall does not look corrective. The trend is still below the 100 EMA for that the bearish outlook remains the same as long as the 100 EMA is headed to the downside. As a result, if the USD/JPY pair is able to break out the first support at 104.13, the market will decline further to 103.70 in order to test the weekly support 2. Consequently, the market is likely to show signs of a bearish trend. So, it will be good to sell below the level of 104.13 with the first target at 103.70 and further to 103.35. However, stop loss should always be taken into account, accordingly, it will be beneficial to set the stop loss above the last bullish trend at 105.14. Taking everything into account, we still prefer the bearish scenario which suggests that the pair will stay below the zone of 104.75 this week. Analysis tip : If the trend is be able to hit the daily pivot point (because of a market bounce in next day), it will of the wisdom to sell as the we did on the weekly strategy. Sometimes, it uses in a daily trade to stop long position and open a new short position. It should be noted that we combine the daily pivot point, weekly pivot point strategies and sentiment analysis to trade.
Author's today's articles: Torben Melsted  Born in November 1962. Graduated from CBS, got Diploma in Finance. Began trading on Forex in 1986 and since that time held various positions such as advising clients, hedging client flows on FX and commodity markets. Also worked for major corporations as Financial Risk Manager. Uses Elliott wave analysis in combination with classic technical analysis, and has been using a Calmar Ratio of 5.0 for over 3 years. Has his own blog, where he uses Elliott wave and technical analysis on all financial markets. Born in November 1962. Graduated from CBS, got Diploma in Finance. Began trading on Forex in 1986 and since that time held various positions such as advising clients, hedging client flows on FX and commodity markets. Also worked for major corporations as Financial Risk Manager. Uses Elliott wave analysis in combination with classic technical analysis, and has been using a Calmar Ratio of 5.0 for over 3 years. Has his own blog, where he uses Elliott wave and technical analysis on all financial markets. Maxim Magdalinin  In 2005 graduated from the Academy of the Ministry of Internal Affairs of the Republic of Belarus, law faculty. Worked as a lawyer for three years in one of the biggest country's company. Besides the trading, he develops trading systems, writes articles and analytical reviews. Works at stock and commodity markets explorations. On Forex since 2006. In 2005 graduated from the Academy of the Ministry of Internal Affairs of the Republic of Belarus, law faculty. Worked as a lawyer for three years in one of the biggest country's company. Besides the trading, he develops trading systems, writes articles and analytical reviews. Works at stock and commodity markets explorations. On Forex since 2006. Vladislav Tukhmenev  Vladislav graduated from Moscow State University of Technologiy and Management. He entered the forex market in early 2008. Vladislav is a professional trader, analyst, and manager. He applies a whole gamut of analysis – technical, graphical, mathematical, fundamental, and candlestick analysis. Moreover, he forecasts the market movements using his own methods based on the chaos theory. Vladimir took part in development of trading systems devoted to fractal analysis. In his free time, Vladimir blogs about exchange markets. Hobbies: active leisure, sporting shooting, cars, design, and marketing. "I do not dream only of becoming the best in my field. I also dream about those who I will take with me along the way up." Vladislav graduated from Moscow State University of Technologiy and Management. He entered the forex market in early 2008. Vladislav is a professional trader, analyst, and manager. He applies a whole gamut of analysis – technical, graphical, mathematical, fundamental, and candlestick analysis. Moreover, he forecasts the market movements using his own methods based on the chaos theory. Vladimir took part in development of trading systems devoted to fractal analysis. In his free time, Vladimir blogs about exchange markets. Hobbies: active leisure, sporting shooting, cars, design, and marketing. "I do not dream only of becoming the best in my field. I also dream about those who I will take with me along the way up." Sergey Belyaev  Born December 1, 1955. In 1993 graduated from Air Force Engineering Academy. In September 1999 started to study Forex markets. Since 2002 has been reading lectures on the technical analysis . Is fond of research work. Created a personal trading system based on the indicator analysis. Authored the book on technical analysis "Calculation of the next candlestick". At present the next book is being prepared for publishing "Indicator Analysis of Forex Market. Trading System Encyclopedia". Has created eleven courses on indicator analysis. Uses classical indicators. Works as a public lecturer. Held numerous seminars and workshops presented at international exhibitions of financial markets industry. Is known as one of the best specialists in the Russian Federation researching indicator analysis. Born December 1, 1955. In 1993 graduated from Air Force Engineering Academy. In September 1999 started to study Forex markets. Since 2002 has been reading lectures on the technical analysis . Is fond of research work. Created a personal trading system based on the indicator analysis. Authored the book on technical analysis "Calculation of the next candlestick". At present the next book is being prepared for publishing "Indicator Analysis of Forex Market. Trading System Encyclopedia". Has created eleven courses on indicator analysis. Uses classical indicators. Works as a public lecturer. Held numerous seminars and workshops presented at international exhibitions of financial markets industry. Is known as one of the best specialists in the Russian Federation researching indicator analysis. Sebastian Seliga  Sebastian Seliga was born on 13th Oсtober 1978 in Poland. He graduated in 2005 with MA in Social Psychology. He has worked for leading financial companies in Poland where he actively traded on NYSE, AMEX and NASDAQ exchanges. Sebastian started Forex trading in 2009 and mastered Elliott Wave Principle approach to the markets by developing and implementing his own trading strategies of Forex analysis. Since 2012, he has been writing analitical reviews based on EWP for blogs and for Forex websites and forums. He has developed several on-line projects devoted to Forex trading and investments. He is interested in slow cooking, stand-up comedy, guitar playing, reading and swimming. "Every battle is won before it is ever fought", Sun Tzu Sebastian Seliga was born on 13th Oсtober 1978 in Poland. He graduated in 2005 with MA in Social Psychology. He has worked for leading financial companies in Poland where he actively traded on NYSE, AMEX and NASDAQ exchanges. Sebastian started Forex trading in 2009 and mastered Elliott Wave Principle approach to the markets by developing and implementing his own trading strategies of Forex analysis. Since 2012, he has been writing analitical reviews based on EWP for blogs and for Forex websites and forums. He has developed several on-line projects devoted to Forex trading and investments. He is interested in slow cooking, stand-up comedy, guitar playing, reading and swimming. "Every battle is won before it is ever fought", Sun Tzu Mihail Makarov  - - Alexandr Davidov  No data No data Vyacheslav Ognev  Vyacheslav was born on August 24, 1971. In 1993, he graduated from Urals State University of Economics in the Russian city of Ekaterinburg holding a degree in Commerce and Economics of Trade. In 2007, he started concentrating on the Russian stock market, trading stocks on the RTS Stock Exchange and futures contracts on FORTS. Since 2008 he has been engaged in analyzing Forex market and trading currencies. He is an author of a simplified wave analysis method. He has also developed a trading strategy. At present, Vyacheslav is a co-author of training materials on two web portals dedicated to Forex trading education. Interests: fitness, F1 "Experience is the best of schoolmasters, only the school fees are heavy." - Thomas Carlyle Vyacheslav was born on August 24, 1971. In 1993, he graduated from Urals State University of Economics in the Russian city of Ekaterinburg holding a degree in Commerce and Economics of Trade. In 2007, he started concentrating on the Russian stock market, trading stocks on the RTS Stock Exchange and futures contracts on FORTS. Since 2008 he has been engaged in analyzing Forex market and trading currencies. He is an author of a simplified wave analysis method. He has also developed a trading strategy. At present, Vyacheslav is a co-author of training materials on two web portals dedicated to Forex trading education. Interests: fitness, F1 "Experience is the best of schoolmasters, only the school fees are heavy." - Thomas Carlyle Pavel Vlasov  No data No data Grigory Sokolov  Born 1 January, 1986. In 2008 graduated from Kiev Institute of Business and Technology with "Finance and Credit" as a major. Since 2008 has studied the behavior of various currency pairs and their correlation on Forex. In his works and trading practice he uses candlestick analysis and Fibonacci technique. Since 2009 has written analytical reviews and articles which are published on popular Internet resources. Interests: music, computers and cookery. "Out of five deadly sins of business and as a rule, the most widespread, excessive striving to get profit is the worst". P. Drucker Born 1 January, 1986. In 2008 graduated from Kiev Institute of Business and Technology with "Finance and Credit" as a major. Since 2008 has studied the behavior of various currency pairs and their correlation on Forex. In his works and trading practice he uses candlestick analysis and Fibonacci technique. Since 2009 has written analytical reviews and articles which are published on popular Internet resources. Interests: music, computers and cookery. "Out of five deadly sins of business and as a rule, the most widespread, excessive striving to get profit is the worst". P. Drucker Mourad El Keddani  Was born in Oujda, Morocco. Currently lives in Belgium. In 2003 obtained B.S. in Experimental Sciences. In 2007 obtained a graduate diploma at Institut Marocain Specialise en Informatique Applique (IMSIA), specialty – Software Engineering Analyst. In 2007–2009 worked as teacher of computer services and trainer in a professional school specializing in computer technologies and accounting. In 2005 started Forex trading. Authored articles and analytical reviews on Forex market on Forex websites and forums. Since 2008 performs Forex market research, and develops and implements his own trading strategies of Forex analysis (especially in Forex Research & Analysis, Currency Forecast, and Recommendations and Analysis) that lies in: Numerical analysis: Probabilities, equations and techniques of applying Fibonacci levels. Classical analysis: Breakout strategy and trend indicators. Uses obtained skills to manage traders' accounts since 2009. In April 2009 was certified Financial Technician by the International Federation of Technical Analysts. Winner of several social work awards: Education Literacy and Non-Formal Education (in Literacy and Adult Education in The National Initiative for Human Development). Was born in Oujda, Morocco. Currently lives in Belgium. In 2003 obtained B.S. in Experimental Sciences. In 2007 obtained a graduate diploma at Institut Marocain Specialise en Informatique Applique (IMSIA), specialty – Software Engineering Analyst. In 2007–2009 worked as teacher of computer services and trainer in a professional school specializing in computer technologies and accounting. In 2005 started Forex trading. Authored articles and analytical reviews on Forex market on Forex websites and forums. Since 2008 performs Forex market research, and develops and implements his own trading strategies of Forex analysis (especially in Forex Research & Analysis, Currency Forecast, and Recommendations and Analysis) that lies in: Numerical analysis: Probabilities, equations and techniques of applying Fibonacci levels. Classical analysis: Breakout strategy and trend indicators. Uses obtained skills to manage traders' accounts since 2009. In April 2009 was certified Financial Technician by the International Federation of Technical Analysts. Winner of several social work awards: Education Literacy and Non-Formal Education (in Literacy and Adult Education in The National Initiative for Human Development).
Languages: Arabic, English, French and Dutch.
Interests: Algorithm, Graphics, Social work, Psychology and Philosophy. Andrey Shevchenko  Andrey Shevchenko Andrey Shevchenko
Subscription's options management Theme's:
Fundamental analysis, Fractal analysis, Wave analysis, Technical analysis, Stock Markets
Author's :
A Zotova, Aleksey Almazov, Alexander Dneprovskiy, Alexandr Davidov, Alexandros Yfantis, Andrey Shevchenko, Arief Makmur, Dean Leo, Evgeny Klimov, Fedor Pavlov, Grigory Sokolov, I Belozerov, Igor Kovalyov, Irina Manzenko, Ivan Aleksandrov, l Kolesnikova, Maxim Magdalinin, Mihail Makarov, Mohamed Samy, Mourad El Keddani, Oleg Khmelevskiy, Oscar Ton, Pavel Vlasov, Petar Jacimovic, R Agafonov, S Doronina, Sebastian Seliga, Sergey Belyaev, Sergey Mityukov, Stanislav Polyanskiy, T Strelkova, Torben Melsted, V Isakov, Viktor Vasilevsky, Vladislav Tukhmenev, Vyacheslav Ognev, Yuriy Zaycev, Zhizhko Nadezhda
Edit data of subscription settings
Unsubscribe from the mailing list Sincerely,
Analysts Service | If you have any questions, you can make a phone call using one of the
InstaForex Toll free numbers right now:
|  | InstaForex Group is an international brand providing online trading services to the clients all over the world. InstaForex Group members include regulated companies in Europe, Russia and British Virgin Islands. This letter may contain personal information for access to your InstaForex trading account, so for the purpose of safety it is recommended to delete this data from the history. If you have received this letter by mistake, please contact InstaForex Customer Relations Department. |


No comments:
Post a Comment