| Elliott wave analysis of EUR/JPY for October 28, 2020 2020-10-28 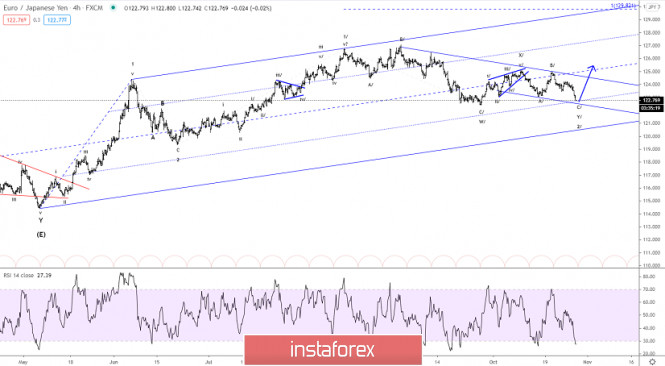
The correction in wave 2/ took us by surprise and broke below short-term key support at 123.38, which invalidated the possible triangle consolidation. It calls for more downside pressure towards 122.38 and maybe even closer to 120.39 before wave 2/ finally comes to an end. This is exactly what makes correction so annoying. They can shift shape from day to day and the options are endless. Resistance is now seen at 123.19 which should be able to act as a cap for the decline to 122.38. R3: 123.38 R2: 123.19 R1: 123.00 Pivot: 122.82 S1: 122.52 S2: 122.38 S3: 121.83 Trading recommendation: Our stop at 123.35 was hit for a 20 pips loss. We will sideline for now. Elliott wave analysis of GBP/JPY for October 28, 2020 2020-10-28 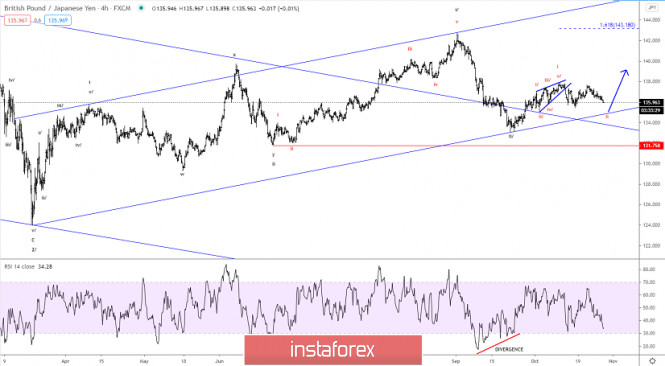
GBP/JPY broke below short-term key-support at 136.26 indicating that red wave ii is in motion. This call for a dip to at least 135.37 and likely even lower to 135.18 before red wave 2 finally comes to its end and a new impulsive rally can take hold. The former support now acts as resistance at 136.26 for the dip to 135.37 and maybe even lower. R3: 136.50 R2: 136.26 R1: 136.12 Pivot: 136.05 S1: 135.88 S2: 135.75 S3: 135.37 Trading recommendation: Our stop+revers was hit at 136.20 for a nice little 65 pip profit. We have placed our new stop at 136.70 and we will take 50% profit at 135.45. AUD/USD. Sales are still trending: Australian inflation won't save the Aussies 2020-10-28 Australian inflation did not disappoint: the main indicators came out either at the level of forecasts or exceeded the forecast values. Aussie received a reason for its corrective growth, although this growth is quite modest. The AUD/USD pair is still trading within the 71st figure, without leaving the boundaries of the established price range of 0.7100 - 0.7170. The ceiling of the specified range coincides with the lower boundary of the Kumo cloud on the daily chart and the resistance level. The lower border of the corridor (support level) coincides with the Tenkan-sen line on the same timeframe Aussie alternately pushes off from the boundaries of this range showing a wide-range flat. Given the first reaction of traders for today's release, we can assume that the pair will not leave the flat corridor this time. The AUD/USD pair grew by only 50 points, reaching the middle of the 71st figure according to today's release result. This relatively calm market reaction is explained by the fact that the published indicators mostly coincided with the forecast values. Thus, the overall consumer price index in quarterly terms went up to 1.6% (the forecast was slightly lower-1.5%). On an annual basis, the indicator came out of the negative area and reached 0.7% (fully coinciding with forecasts). The core inflation index also did not surprise the market with a breakthrough growth – the components as a whole came out at the level of General expectations.  In other words, the key indicators of today's release did not let traders down – thanks to this factor because the Aussie did not remain afloat, but also showed corrective growth. But this is clearly not enough to break the trend, so investors are not in a hurry to invest in the Australian, given the array of negative fundamental factors. And it's not just about the "dovish" intentions of the RBA, whose members plan to lower the interest rate next week. The commodity market is also causing concern. First of all, we are talking about iron ore. As we all know, this is a strategically important raw material product for Australia, while China is the world's largest consumer of raw materials. It is worth noting that despite the prolonged political conflict between Australia and China, Australians continued to actively export iron ore to the Chinese throughout the year. However, at the moment there were problems of a non-political nature wherein the supply began to exceed the demand. However, the price of iron ore in China fell significantly against the background of a record increase in stocks in seaports since February according to Reuters. At the beginning of this week, the price of iron ore futures on the Dalian commodity exchange fell by three percent to $ 113 per ton – the lowest figure for the past month. On the Singapore exchange, futures for this commodity also fell by 1.3% to 111 dollars per ton. This trend is due to the fact that stocks of imported iron ore in Chinese ports are growing for the fifth week in a row. As per the experts from ANZ,, this is due to a decrease in the volume of smelting at steel mills against the background of pressure on the margins of enterprises. It is also worth Recalling that at the beginning of October, steel mills in China received an official verbal notification to stop importing Australian coal, which led to a drop in prices for marine coking coal. According to relevant media, Mongolia has replaced Australia as the leading supplier of coking coal to China. In this case, the motives of the Chinese are political in nature, but this does not change the essence. 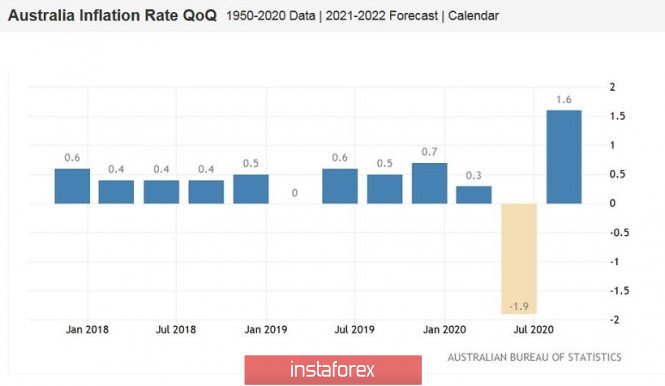 Thus, the fundamental background for the AUD/USD pair has not changed after today's release. The growth in inflation indicators suggests that the regulator will limit the rate cut by 15 basis points, rather than 25. The head of the RBA, Philip Lowe, said in one of his speeches that the regulator could lower the rate to 0.1%. At the same time, according to the minutes of the last meeting of the Central Bank, members of the regulator discussed the option of reducing the rate to zero. I believe that after the release of inflation data, the Central Bank will limit itself to the first option, which was voiced by Lowe. But the very fact of monetary policy easing, the political conflict with China, the decline in the commodity market and the existing problems in the Australian labor market will continue to put pressure on the Australian dollar. This means that short positions are still a priority – especially when approaching the upper boundary of the flat corridor 0.7100-0.7170 (i.e., the lower boundary of the Kumo cloud on D1). The stop loss can be placed slightly higher at 0.7230 - this is the upper line of the Bollinger Bands indicator on the same timeframe. If buyers can overcome this target (this scenario is possible only with a large-scale weakening of the US dollar throughout the market), the southern scenario will lose its relevance. However, if we exclude the option of such unforeseeable circumstances, then selling AUD/USD will look like the most optimal trading solution. Analytics and trading signals for beginners. How to trade EUR/USD on October 28? Plan for opening and closing trades on Wednesday 2020-10-28 Hourly chart of the EUR/USD pair 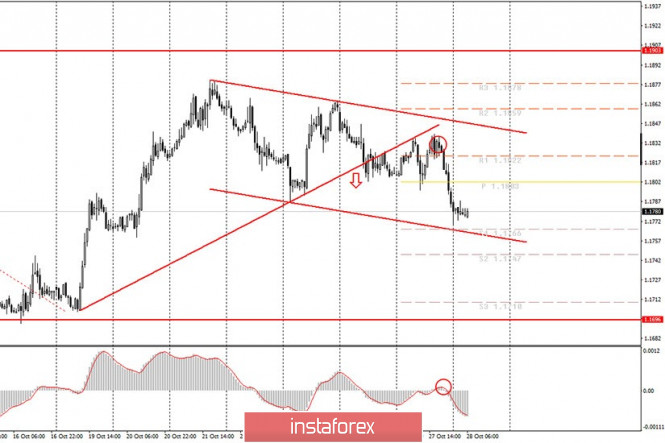 The EUR/USD pair began a new round of downward movement last Tuesday night, which we talked about and waited for last night. The MACD indicator generated a sell signal after the article was written and, accordingly, novice traders could open short positions while aiming for the lower border of the new descending channel. In this case, they made profit by around 30 points. And the price has almost reached the lower border of the channel, so an upward reversal is very likely now. Therefore, we recommend closing short positions and waiting for new sell signals to appear. The pair will likely attempt to return to the upper border of the channel or, at least, to correct slightly upward. Take note that the pair continues to trade within the $1.17-1.19 channel all this time (for about three months already). Therefore, we do not expect strong trend movements right now. Basically, what we are doing now is catching short-term trends inside the horizontal channel. The fundamental background for the EUR/USD pair is still the same. This means that the very background that contributed to the strengthening of the euro currency by 13 cents in the last six months is still present to this day. Thus, traders simply have no reason to buy the US dollar at this time. Especially until the stage of the presidential elections is over. After all, elections are always uncertain. Therefore, the euro/dollar pair can continue to trade in a horizontal channel, at least until November 3, and even until the time when all votes are counted and the new president is announced, who will take office on January 20, 2021. Macroeconomic reports do not have any particular influence. Yesterday's relatively important report on durable goods orders was completely ignored. And as of today, not a single macroeconomic report or event is included in the news calendar. Therefore, novice traders, like all other traders, will continue to be hungry for news rations. In principle, we can not even say that some other topics have an impact on the euro or dollar. For example, the epidemiological situation in the European Union continues to deteriorate, which inevitably threatens to slow down the European economy. However, the markets are not paying attention to this either, since the euro has not depreciated much in recent days or weeks. Possible scenarios for October 28: 1) Buy positions on the EUR/USD pair are currently irrelevant, since the ascending trend line has been overcome, and the price is currently trading within the descending channel. Therefore, you may consider long deals, but the price should settle above the descending channel first, and even then, you have to be very careful, with targets of 1.1878 and 1.1903. 2) Trading for a fall at this time is more relevant, since the price is inside the descending channel. However, at the moment we are waiting for a new round of correction. Therefore, novice traders are advised to wait for an upward pullback, form a new sell signal from the MACD, and then resume trading downward with targets at 1.1766 and 1.1747. On the chart: Support and Resistance Levels are the Levels that serve as targets when buying or selling the pair. You can place Take Profit near these levels. Red lines are the channels or trend lines that display the current trend and show in which direction it is better to trade now. Up/down arrows show where you should sell or buy after reaching or breaking through particular levels. The MACD indicator (14,22,3) consists of a histogram and a signal line. When they cross, this is a signal to enter the market. It is recommended to use this indicator in combination with trend lines (channels and trend lines). Important announcements and economic reports that you can always find in the news calendar can seriously influence the trajectory of a currency pair. Therefore, at the time of their release, we recommended trading as carefully as possible or exit the market in order to avoid a sharp price reversal. Beginners on Forex should remember that not every single trade has to be profitable. The development of a clear strategy and money management are the key to success in trading over a long period of time. Brief trading recommendations for EUR/USD on 10/28/20 2020-10-28 
The EUR/USD pair showed an active downward interest yesterday, As a result, the quote broke through the support level of 1.1810, and then declined entirely below the low (1.1787) on October 23. Looking at the general scale of fluctuations, there are no significant changes, but if we proceed from market ticks, then a correction can be seen. It should be noted that there was a four-week growth in the market from the local low of 1.1612, where buyers managed to return the euro rate to the level of 1.1880. After that, buyers' eagerness subsided and there was a consistent recovery process from short positions (sell positions). Yesterday, sellers managed to resume the recovery process, breaking through the low (1.1787) on October 23. Thus, the market still has a chance to let the euro decline further. Regarding the quote's current location, it can be seen that market participants are consolidating below 1.1787, where stagnation formed within the level of 1.1770, followed by a pullback. We can assume that market participants, particularly sellers, will need some time for the new levels to settle, which will lead to a local slowdown within 1.1760/1.1795. This process will be regarded in the market as an accumulation, which is highly likely to lead to acceleration. Sellers' greatest activity will occur after the price is consolidated below 1.1760, which will lead to the next recovery stage, that is, towards the level of 1.1700. An alternative scenario of the market development will be considered if the price returns above the level of 1.1840, which may interrupt the recovery process. 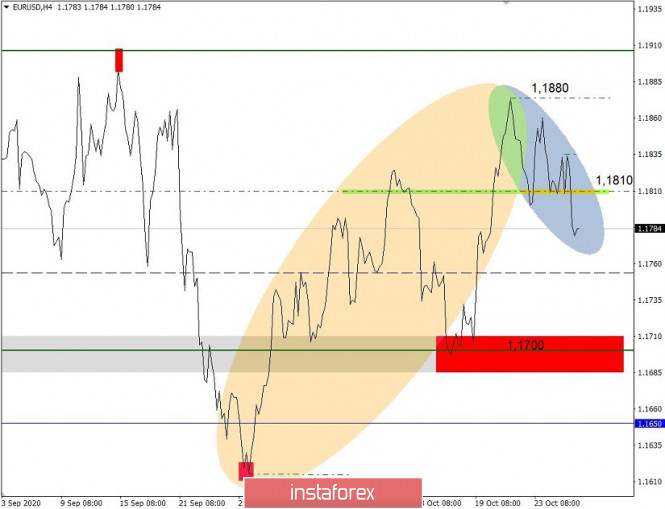
Trading plan for the EUR/USD pair on October 28. Persistent rise of COVID-19 incidence in Europe; Low demand for the European currency. 2020-10-28 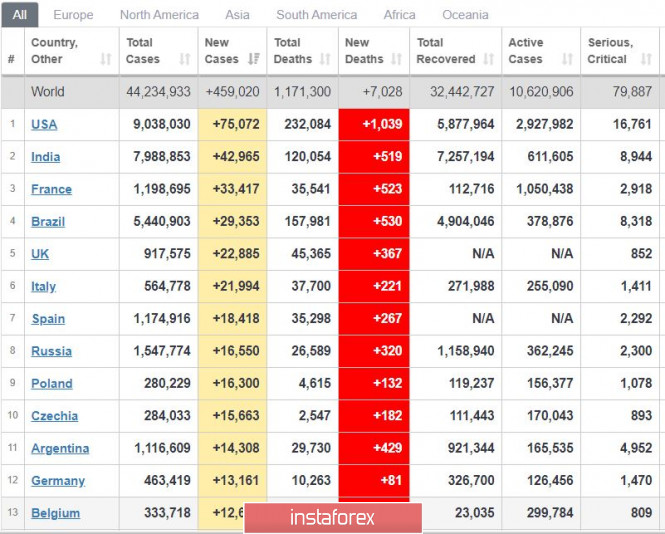
COVID-19 cases continue to surge in Europe. At the moment, France has already risen third place on the largest incident rate around the world, having recorded 33 thousand new infections a day. Next is Italy and Spain with about 20 thousand, followed by Poland and Czech Republic at 16 thousand. Lastly, Germany and Belgium has a record of 13 thousand 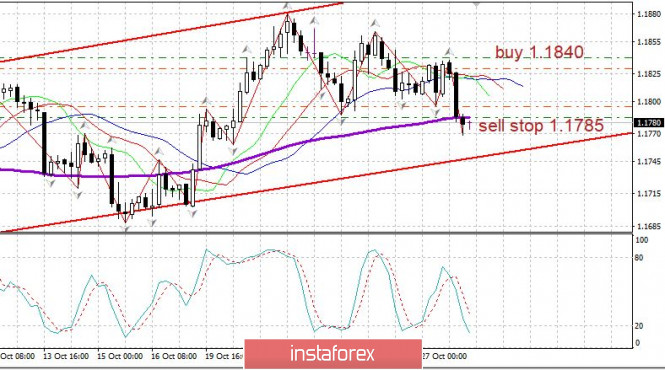
EUR/USD - Demand for the euro has fallen sharply in the market. As a result, the quote has dropped below the level of 1.1785, emitting a strong bearish signal. However, this could also turn out to be just a false breakout again. Open short positions from 1.1785 to 1.1830 In case of an upward reversal, open long positions from 1.1840 to 1.1795. News on the US GDP, as well as statements from the ECB, could affect the direction of the market. EUR/USD: plan for the European session on October 28. COT reports. Euro under pressure, several objective reasons for this 2020-10-28 To open long positions on EUR/USD, you need: Sell positions for the euro collapsed yesterday, and the bulls tried to regain resistance at 1.1826 and they even managed to form a good entry point from it. Let's take a look at the 5-minute chart. You can see how testing the 1.1826 level from top to bottom, which was supposed to be a confirmation and a signal to open long positions in EUR/USD, turned out to be unsuccessful and the pair quickly returned below the 1.1826 area. After that, the bears formed a fairly convenient entry point into short positions, which led to a new wave of short positions. However, the euro did not continue to fall and buyers still managed to gain a foothold above 1.1826 in the afternoon, but they did not wait for a good growth from this level. US President Donald Trump's statements and the spread of the coronavirus continued to put pressure on the euro, as did weak fundamental reports on the American economy, scaring away investors who are betting on risky assets. 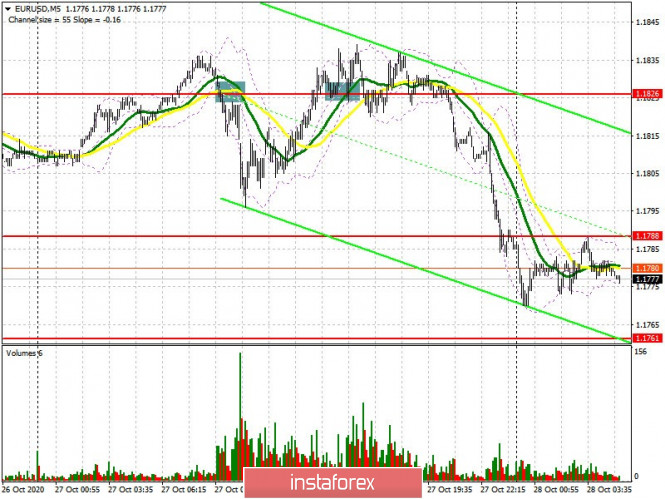 Today's focus will be on the resistance at 1.1796, which transformed from 1.1787. In order to talk about the resumption of the bull market, buyers need to settle above this range. Testing the 1.1796 area from top to bottom generates a signal to buy EUR/USD in order to return to yesterday's high at 1.1835, where I recommend taking profit. The 1.1864 level will be the next target. Buyers of the euro are unlikely to be as active since important fundamental data will not be released in the first half of the day. If the euro is still under pressure, I recommend waiting for EUR/USD to fall to the support area of 1.1761 and open long positions there if a false breakout is formed. You can buy the pair immediately on a rebound after the next low at 1.1732 has been tested, counting on a correction of 15-20 points within the day. The Commitment of Traders (COT) report for October 20 recorded an increase in long positions and short ones. However, there were more of the latter, which led to an even greater decrease in the positive delta. Despite this, the buyers of risky assets believe in the continuation of the bull market, but prefer to act with caution, as there is no good news for the eurozone yet. Thus, long non-commercial positions increased from 228,295 to 229,878, while short non-commercial positions increased from 59,658 to 63,935. The total non-commercial net position decreased to 165,943, against 168,637 a week earlier.... However, the bullish sentiment for the euro remains rather high in the medium term. The more the euro falls against the US dollar at the end of this year, the more attractive it is for new investors. To open short positions on EUR/USD, you need: Sellers should protect resistance at 1.1796, just above which the moving averages pass. Considering that we have a downward trend, it is better to expect that it would continue today. Therefore, forming a false breakout in the 1.1796 area forms a new entry point for short positions, and the main target will be a breakout and the pair will need to settle below the 1.1761 level. Testing it from the bottom up forms another signal to sell the euro, which will lead to a larger sale in the area of a low of 1.1732. The 1.1704 level will be the next target, where I recommend taking profits. If we don't hear positive news on Brexit today, it will keep the pressure on the euro even more. If the pair rises above 1.1796 and bears are not active there, I recommend postponing short positions and sell the euro immediately on a rebound from yesterday's high of 1.1835, counting on a correction of 15-20 points within the day. Indicator signals: Moving averages Trading is under the 30 and 50 moving averages, indicating a resumption of the bear market. Note: The period and prices of moving averages are considered by the author on the H1 hourly chart and differs from the general definition of the classic daily moving averages on the daily D1 chart. Bollinger Bands A breakout of the lower border of the indicator around 1.1761 will increase pressure on the euro. Growth will be limited by the upper level of the indicator in the 1.1840 area. Description of indicators - Moving average (moving average, determines the current trend by smoothing out volatility and noise). Period 50. It is marked in yellow on the chart.
- Moving average (moving average, determines the current trend by smoothing out volatility and noise). Period 30. It is marked in green on the chart.
- MACD indicator (Moving Average Convergence/Divergence — convergence/divergence of moving averages) Quick EMA period 12. Slow EMA period to 26. SMA period 9
- Bollinger Bands (Bollinger Bands). Period 20
- Non-commercial speculative traders, such as individual traders, hedge funds, and large institutions that use the futures market for speculative purposes and meet certain requirements.
- Long non-commercial positions represent the total long open position of non-commercial traders.
- Short non-commercial positions represent the total short open position of non-commercial traders.
- Total non-commercial net position is the difference between short and long positions of non-commercial traders.
GBP/USD: plan for the European session on October 28. COT reports. Peace of mind for the pound. The pair cannot leave the channel for the third day 2020-10-28 To open long positions on GBP/USD, you need: The pound formed an excellent sell signal yesterday afternoon, and I drew attention to the high probability of its appearance in my review. Let's take a look at the 5-minute chart and break down the trade. You can see how the bulls are approaching resistance at 1.3072 in the afternoon, and it is difficult to go above it. Each attempt to cling to this level leads to a quick return to the area below it. After some time, testing this area from the bottom up and closing below it led to forming a good entry point for short positions. The pound lost more than 40 points by the end of the day. 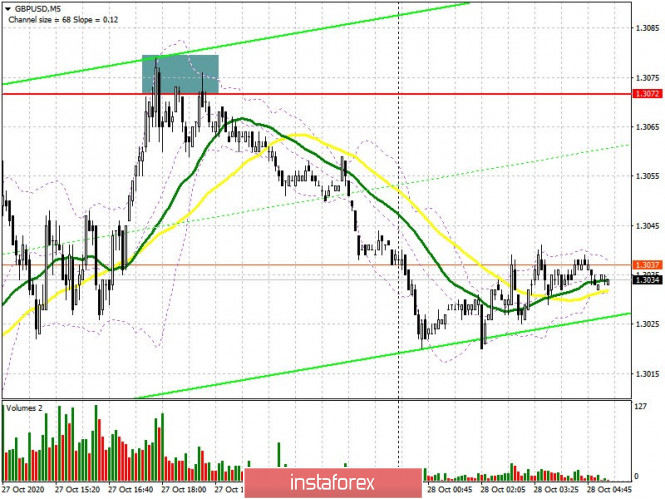 Everyone is waiting for decisions on the trade deal and any news related to it. Any insider information will lead to a sharp movement for the pound in one direction or another. Buyers still need to protect support at 1.2997, and forming a false breakout on it will be a signal to open long positions in order to return to yesterday's resistance at 1.3072. However, only a breakout and being able to settle at this level will result in producing a good additional entry point into long positions, and could also lead the pound to highs of 1.3120 and 1.3174, where I recommend taking profits. In case GBP/USD falls below the 1.2997 level, it is best not to rush into long deals, but to wait until the 1.2919 low has been updated, where you can open long positions only if a false breakout is formed. I recommend buying GBP/USD immediately on a rebound, but only in the area of large support at 1.2865, counting on a correction of 20-30 points within the day. You need to understand that in case we receive negative news on Brexit, trading against the newly formed trend even for a rebound from the mentioned levels will not be a completely correct decision. The Commitment of Traders (COT) report for October 20 showed a reduction in short positions and a sharp increase in long positions. Long non-commercial positions rose from 36,195 to 39,836. At the same time, short non-commercial positions fell from 45,997 to 41,836. As a result, the negative value of the non-commercial net position slightly increased and reached -2,000, against - 9,802 a week earlier, which indicates that the sellers of the pound retain control and also shows their minimal advantage in the current situation. To open short positions on GBP/USD, you need: Sellers of the pound will focus on the breakout and settle under the support of 1.2997, since this will increase the pressure on the pair and pull it down to the 1.2919 level, where I recommend taking profits. A stronger bearish momentum will only emerge if disagreements persist in the UK-EU trade deal. A break and being able to settle below 1.2919 forms a good entry point for short positions while expecting to update the lows of 1.2919 and 1.2865, where I recommend taking profits. If the pound is still in demand in the morning, then, just like yesterday, I do not recommend rushing with sell positions. It is best to open short positions from the resistance of 1.3072, subject to forming a false breakout there, similar to yesterday, or sell GBP/USD immediately on a rebound from the 1.3120 high, counting on a correction of 20-30 points within the day. 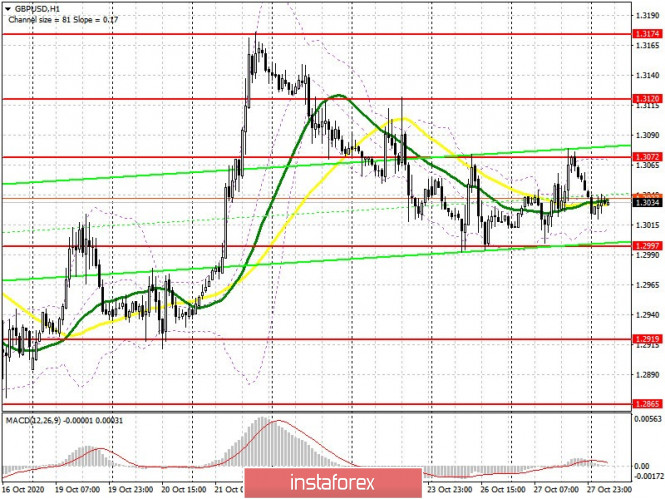 Indicator signals: Moving averages Trading is carried out in the area of 30 and 50 moving averages, which indicates some market uncertainty. Note: The period and prices of moving averages are considered by the author on the H1 hourly chart and differs from the general definition of the classic daily moving averages on the daily D1 chart. Bollinger Bands A breakout of the upper border of the indicator in the 1.3072 area will lead to a new wave of growth for the pound. A breakout of the lower border at 1.3010 will increase pressure on the pair. Description of indicators - Moving average (moving average, determines the current trend by smoothing out volatility and noise). Period 50. It is marked in yellow on the chart.
- Moving average (moving average, determines the current trend by smoothing out volatility and noise). Period 30. It is marked in green on the chart.
- MACD indicator (Moving Average Convergence/Divergence — convergence/divergence of moving averages) Quick EMA period 12. Slow EMA period to 26. SMA period 9
- Bollinger Bands (Bollinger Bands). Period 20
- Non-commercial speculative traders, such as individual traders, hedge funds, and large institutions that use the futures market for speculative purposes and meet certain requirements.
- Long non-commercial positions represent the total long open position of non-commercial traders.
- Short non-commercial positions represent the total short open position of non-commercial traders.
- Total non-commercial net position is the difference between short and long positions of non-commercial traders.
Technical Analysis of GBP/USD for October 28, 2020 2020-10-28 Technical Market Outlook: The GBP/USD pair keeps trading in a narrow consolidation located between the levels of 1.3021 - 1.3074. Recently the price has hit the level of 1.3021, which is a technical support, but it looks like the bears want to push it lower towards the level of 1.3011. This is the 61% Fibonacci retracement and if broken, then the market will slide lower towards the next technical support seen at 1.2982. Please notice, the price is back into the local ascending channel again, so the bears are now in control of the market. Weekly Pivot Points: WR3 - 1.3465 WR2 - 1.3320 WR1 - 1.3185 Weekly Pivot - 1.3039 WS1 - 1.2902 WS2 - 1.2757 WS3 - 1.2620 Trading Recommendations: The GBP/USD pair is in the down trend on the monthly time frame, but the recent bounce from the low at 1.1411 made in the middle of March 2020 loos very strong and might be a reversal swing. In order to confirm the trend change, the bulls have to break through the technical resistance seen at the level of 1.3518. All the local corrections should be used to enter a buy orders as long as the level of 1.2674 is not broken. 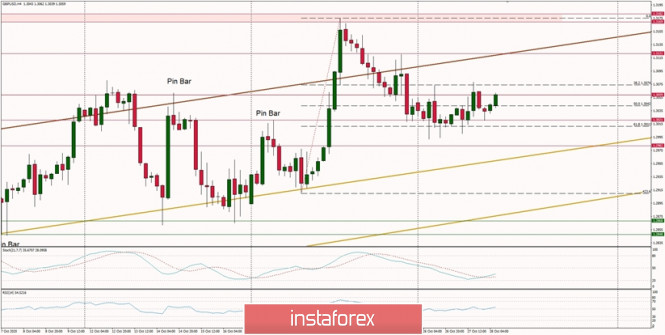
Technical Analysis of EUR/USD for October 28, 2020 2020-10-28 Technical Market Outlook: After the failure to rally above the short-term trend line resistance located around the level of 1.1845, the EUR/USD reversed and broken below the technical support seen at the level of 1.1790. The bearish pressure intensify as the market makes a new local low at the level of 1.1764 (at the time of writing the article) and is approaching the key short-term Fibonacci retracement seen at the level of 1.1761. Any violation of this level will lead to another wave down towards the level of 1.1724 and 1.1710. Weekly Pivot Points: WR3 - 1.2123 WR2 - 1.1991 WR1 - 1.1943 Weekly Pivot - 1.1823 WS1 - 1.1766 WS2 - 1.1638 WS3 - 1.1589 Trading Recommendations: Since the middle of March 2020 the main trend is on EUR/USD pair has been up, which can be confirmed by almost 10 weekly up candles on the weekly time frame chart and 4 monthly up candles on the monthly time frame chart. The recent correction towards the level of 1.1612 seems to be completed and now market is ready for another wave up. This means any local corrections should be used to buy the dips until the key technical support is broken. The key long-term technical support is seen at the level of 1.1445. The key long-term technical resistance is seen at the level of 1.2555. 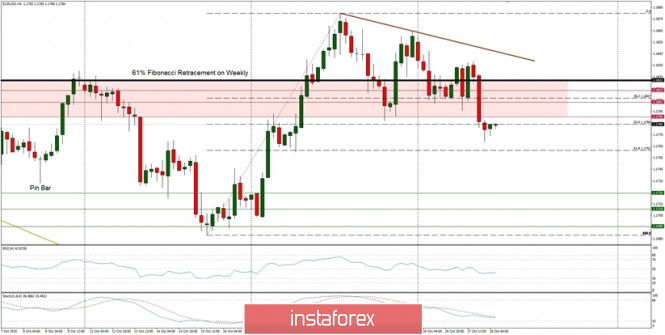
Indicator analysis. Daily review on EUR/USD for October 28, 2020 2020-10-28 Trend analysis (Figure 1) Today, from the level of 1.1786 (closing of yesterday's daily candlestick), the market may continue to move down with the goal of 1.1756 - the support line (white bold line). If this line is tested, further upward work is possible with the goal of 1.1807, which is the 50% pullback level (blue dotted line). From this level, it is possible to work upward. 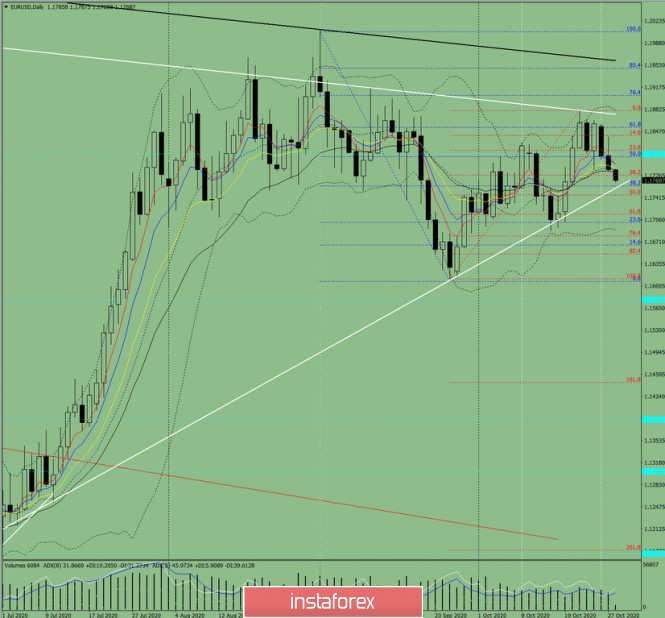
Figure 1 (Daily Chart) Comprehensive analysis: - Indicator analysis - down
- Fibonacci levels - down
- Volumes - down
- Technical analysis - down
- Trend analysis - down
- Bollinger Bands - down
- Weekly Chart - down
General conclusion: Today, the price may continue to move down with the target of 1.1756 - the support line (white bold line). If this line is tested, further upward work is possible with the goal of 1.1807, which is the 50% pullback level (blue dotted line). From this level, it is possible to work upward. Unlikely scenario: upon moving down and reaching the support line 1.1756 (white bold line), the price may start moving down to 1.1715 (red dotted line), which is the 61.8% pullback level. Indicator analysis: Daily review for the GBP/USD currency pair 28/10/2020 2020-10-28 Trend analysis (Fig. 1). Today, the market will try to continue moving up from the level of 1.3043 (closing of yesterday's daily candle) in order to reach the pullback level of 61.8% - 1.3173 (blue dotted line). If this level is tested, a pullback may begin down to the target of 1.3104 which is a pullback level of 14.6% (red dotted line). 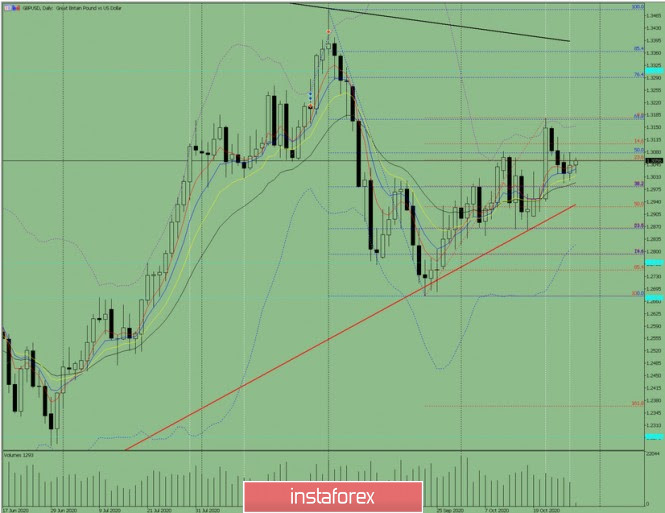 Figure 1 (daily chart). Complex analysis: - Indicator Analysis – up
- Fibonacci Levels – up
- Volumes – up
- Candle Analysis-up
- Trend Analysis – down
- Bollinger Bands – up
- Weekly Chart – up
General conclusion: The price, from the level of 1.3043 (closing of yesterday's daily candle), will try to continue moving up to reach the pullback level of 61.8% - 1.3173 (blue dotted line). If this level is tested, a pullback may begin down to the target of 1.3104 which is a pullback level of 14.6% (red dotted line). Unlikely scenario: The price, from the level of 1.3043 (closing of yesterday's daily candle), will work up to reach the 50% pullback level-1.3078 (blue dotted line). In the case of testing this level-work down to the goal of 1.2986 which is a pullback level of 38.2% (red dotted line) Simplified wave analysis and forecast for EUR/USD and AUD/USD on October 28 2020-10-28 EUR/USD Analysis: The direction of the medium-term trend of the European currency since March is set by an upward wave. Its last section counts down from September 25. The wave structure started forming a downward correction a week ago. The price is very close to a strong potential reversal zone. Forecast: Over the next 24 hours, we expect the end of the downward movement, the formation of a reversal, and the beginning of a price rise. A breakout of the upper limit of the resistance zone is possible today, but unlikely. Potential reversal zones Resistance: - 1.1850/1.1880 Support: - 1.1780/1.1750 Recommendations: Selling euros today is risky and not recommended. It is more promising to search for signals to buy the instrument in the area of settlement support. 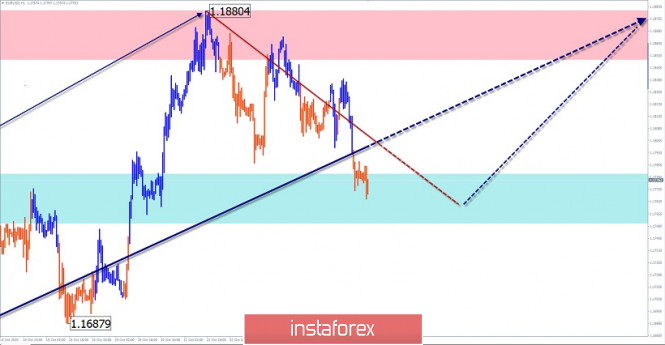
AUD/USD Analysis: The chart of the main pair of the Australian dollar is dominated by an upward trend. Short-term price fluctuations are set by the rising wave from September 25. In its structure, the formation of the final part (C) began on October 20. Since last week, the chart has been sideways flat. It forms the correction phase necessary before the subsequent upward surge. Forecast: Today, we expect the end of the sideways movement mood and the beginning of price growth. At the European session, a second decline in the support area is possible. The calculated resistance zone is intermediate and can only hold the price of the pair until the end of the day. Potential reversal zones Resistance: - 0.7190/0.7220 Support: - 0.7130/0.7100 Recommendations: There are no conditions for "Aussie" sales today. At the end of oncoming movements, it is recommended to track the emerging reversal signals to buy the pair. 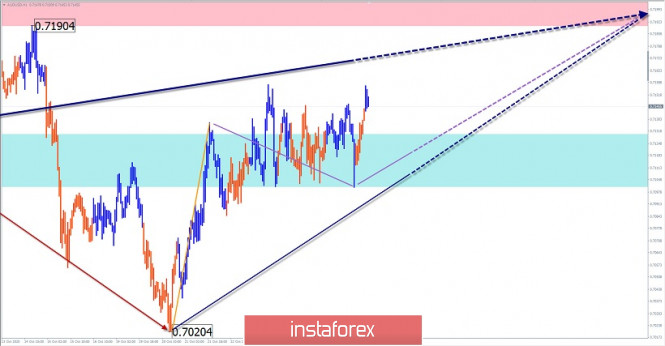
Explanation: In the simplified wave analysis (UVA), waves consist of 3 parts (A-B-C). The last incomplete wave is analyzed. The solid background of the arrows shows the formed structure, and the dotted background shows the expected movements. Note: The wave algorithm does not take into account the duration of the instrument's movements in time! GBP/USD. October 28. COT report. Coronavirus problems in the UK. The government is considering introducing a lockdown 2020-10-28 GBP/USD – 1H. 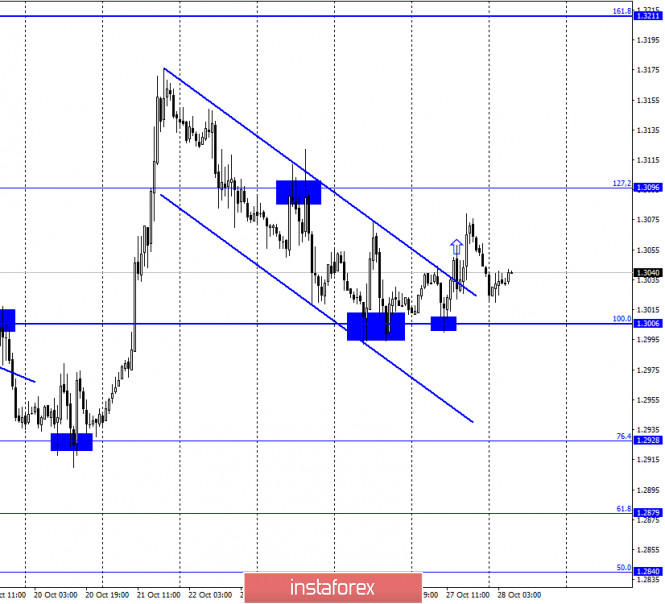
According to the hourly chart, the quotes of the GBP/USD pair performed the third fall to the corrective level of 100.0% (1.3006), the third rebound from this level, and a reversal in favor of the British currency. The pair's quotes completed the consolidation above the descending trend line corridor, thus the mood of the traders now can be described as "bullish". Traders can now expect growth in the direction of the corrective level of 127.2% (1.3096). The pound/dollar pair has not stood still in recent weeks. However, in general, we can not say that the pair's movements are somehow connected with the information background or its messages. No economic statistics have been coming from the UK for a long time. There is no news about the progress of the negotiations of the next ninth or tenth round of negotiations on a trade agreement. There is only news of the coronavirus that continues to terrorize Britain. According to the latest data, the number of daily illnesses in the country continues to grow and now ranges between 20 and 25 thousand. Thus, it is safe to say that Boris Johnson's three-tier system of quarantine restrictions is not working yet. Doctors and epidemiologists continue to recommend that the country be closed for total quarantine. So far, Johnson is resisting, however, there is no doubt that if the increase in the incidence continues, this government decision is not far off. GBP/USD – 4H. 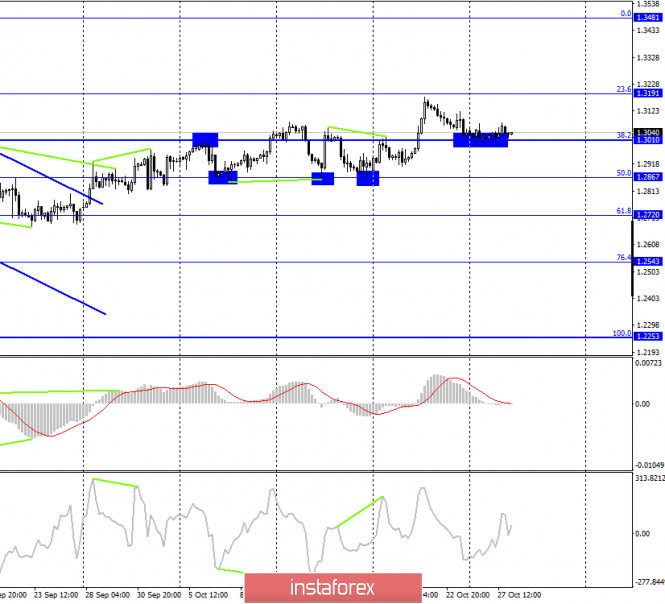
On the 4-hour chart, the GBP/USD pair performed a fall to the Fibo level of 38.2% (1.3010) and a kind of rebound from it, which allows traders to count on a reversal in favor of the British currency and new growth in the direction of the corrective level of 23.6% (1.3191). Fixing quotes below the level of 38.2% will increase the probability of continuing to fall in the direction of the next corrective level of 50.0% (1.2867). Today, the divergence is not observed in any indicator. GBP/USD – Daily. 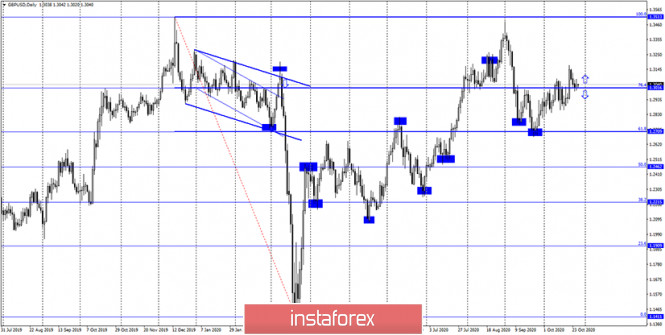
On the daily chart, the pair's quotes consolidated above the corrective level of 76.4% (1.3016), however, the reversal in favor of the US currency has already been completed and the fall has begun. More important now is the 4-hour chart and the corrective level of 38.2% on it. GBP/USD – Weekly. 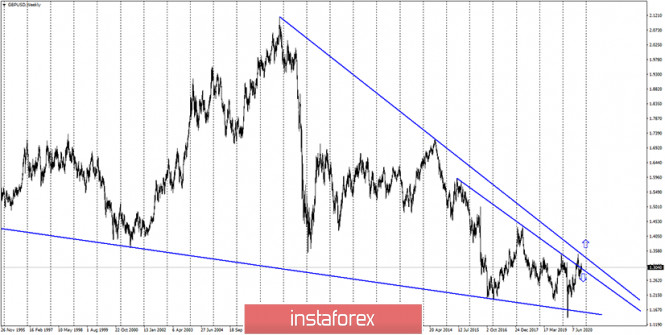
On the weekly chart, the pound/dollar pair closed under the lower downward trend line, thus, a false breakout of this line followed earlier. However, in recent weeks, it has made new attempts to gain a foothold over both trend lines. Overview of fundamentals: There were no economic reports in the UK on Tuesday. There was also no new information about the progress of negotiations between the UK and the European Union, which are currently ongoing in London and have been extended for several days. US and UK news calendar: On October 28, the UK and US news calendar does not contain a single report or event, but at any time there may be important information from London about whether Michel Barnier and David frost have agreed or not this time. COT (Commitments of Traders) report: 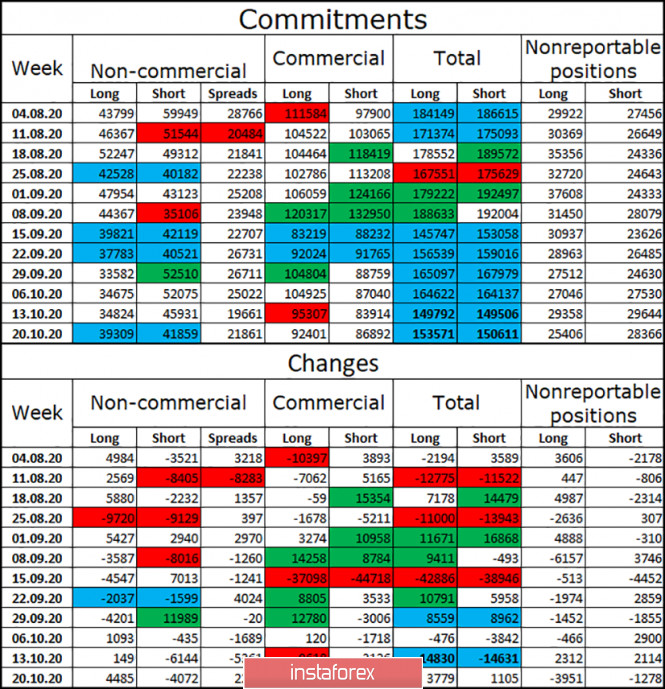
The latest COT report on the British pound that was released last Friday showed that the mood of the "Non-commercial" category of traders has become more "bullish". Speculators immediately increased to 4.5 thousand long-contracts and got rid of 4 thousand short-contracts. Thus, after three weeks of "bearish" advantage, speculators are again inclined to buy the British. However, I believe that such a change in mood does not mean anything specific. In a week or two, major players can start building up short contracts again. And the total number of long and short contracts focused on their hands is almost the same. Thus, I would conclude that the major players are now in disarray. Forecast for GBP/USD and recommendations for traders: Today, I recommend selling the GBP/USD pair with a target of 1.2928, if the consolidation is made under the corrective level of 100.0% (1.3009) on the hourly chart. I recommend buying the British dollar with a target of 1.3096, as the rebound from the level of 100.0% on the hourly chart and closing over the descending corridor was performed. Terms: "Non-commercial" - major market players: banks, hedge funds, investment funds, private, large investors. "Commercial" - commercial enterprises, firms, banks, corporations, companies that buy currency not for speculative profit, but for current activities or export-import operations. "Non-reportable positions" - small traders who do not have a significant impact on the price. EUR/USD. October 28. COT report. Donald Trump's latest warning. Americans continue to vote early 2020-10-28 EUR/USD – 1H. 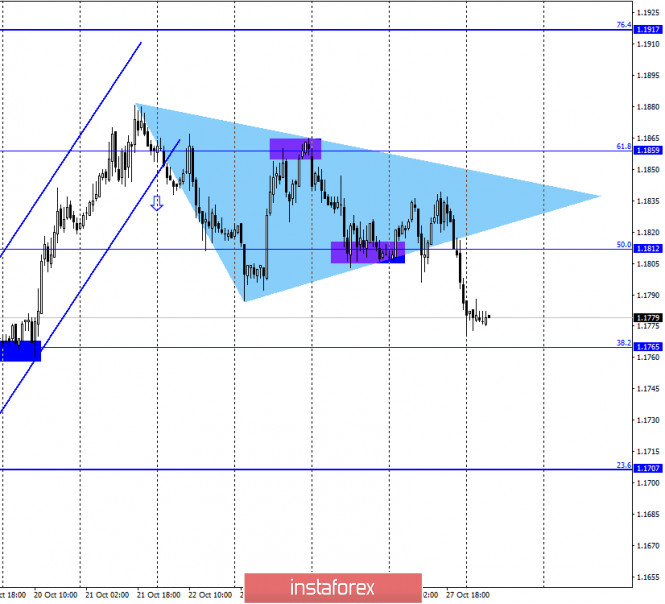
On October 27, the EUR/USD pair performed a reversal in favor of the US currency and resumed the process of falling in the direction of the corrective level of 38.2% (1.1765). Also, the pair's quotes performed a consolidation under the Fibo level of 50.0% (1.1812) and under the triangle in which they had spent several days before. The rebound of quotes from the level of 38.2% will work in favor of the EU currency and some growth in the direction of 1.1812, fixing under this level will increase the chances of a further fall. Meanwhile, Donald Trump continues to try to put pressure on Joe Biden less than a week before the official election date. This time, at one of his campaign speeches, Trump said that Americans are voting and will not vote for Trump or Biden, but for "super-recovery of the country or depression". Trump means that with him, the country will quickly recover from the pandemic crisis, and with Biden, it will plunge into a multi-year depression. However, the voters themselves think differently. A week before election day, Biden's campaign ratings remain higher at 11%. This is exactly the advantage the Democrat had a week ago and a month ago. Thus, the balance of power between the two contenders has not changed. And it is unlikely to change. Americans are already voting without waiting for November 3. More than 60 million voters have already voted across the country. And the euro/dollar pair is waiting for the results of these elections. Let's not be misled by the drop in quotes yesterday, the main thing is the side corridor on the 4-hour chart. EUR/USD – 4H. 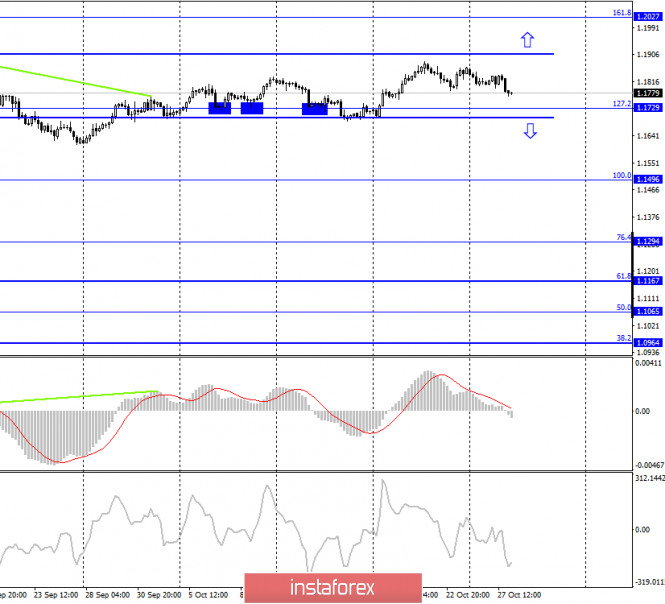
On the 4-hour chart, the graphical picture remains very boring, as the pair continues to trade inside the side corridor. There was no rebound of the pair's quotes from the upper border of the side corridor, so there was no signal to sell. Fixing the pair's rate above or below the corridor will allow traders to expect growth or fall, but so far the quotes are sitting tightly inside the corridor and do not think about leaving it. EUR/USD – Daily. 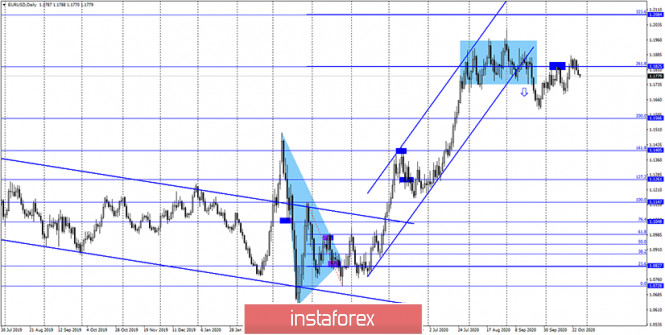
On the daily chart, the EUR/USD pair quotes returned to the corrective level of 261.8% (1.1825), which is not a strong level, and are now trading near it. However, on the 4-hour chart, the pair remains inside the side corridor, which is the most important thing right now. EUR/USD – Weekly. 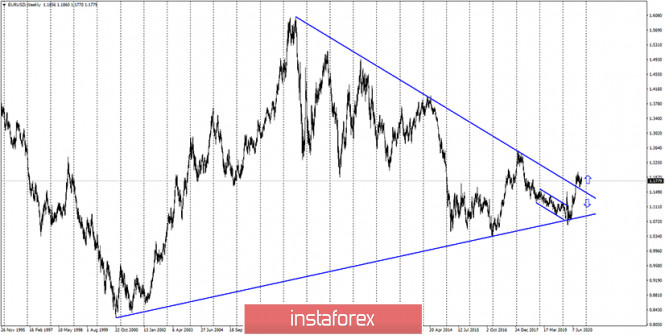
On the weekly chart, the EUR/USD pair has consolidated above the "narrowing triangle", which now allows us to count on further growth of the euro currency, which may be strong, but in the long term. Overview of fundamentals: On October 27, there were no news and reports in the European Union, and in America, there was a report on orders for durable goods, which, however, did not interest traders at all. News calendar for the United States and the European Union: On October 28, the calendars of economic events in the European Union and the United States are empty, so the influence of the information background will be absent today. COT (Commitments of Traders) report: 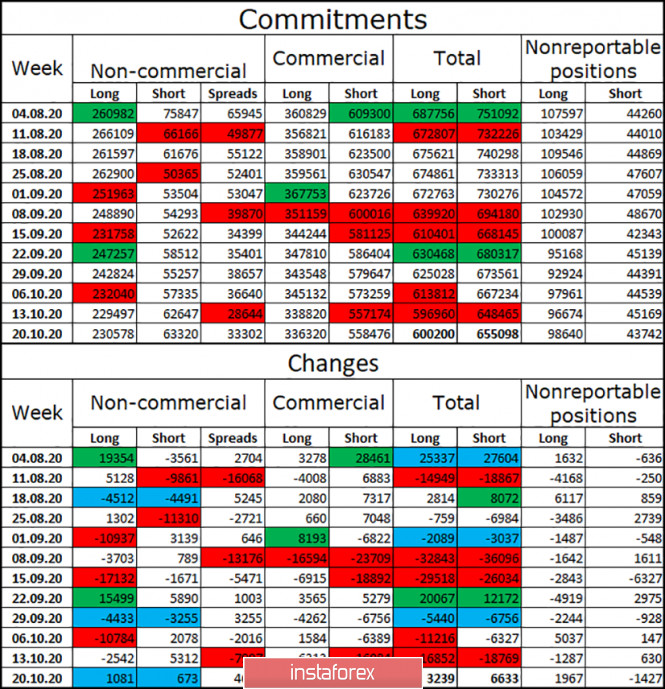
The latest COT report was rather boring and uninformative. The most important category of non-commercial traders increased only 1 thousand long contracts and 700 short contracts during the reporting week. Thus, changes in their mood can be described as minimal and insignificant. Over the past few weeks, changes in this category are generally quite weak. Only on October 6, a fairly strong drop in the number of long contracts was registered. However, it is the lack of serious changes among speculators that reflects what has been happening on the market in recent months. Namely, trade in the side corridor. We are less interested in other categories of traders, but in any case, there are no major changes that deserve attention. Forecast for EUR/USD and recommendations for traders: Today, I recommend selling the euro with a target of 1.1707, if the consolidation is made under the corrective level of 38.2% (1.1765) on the hourly chart. Purchases of the pair will be possible with targets of 1.1765 and 1.1812 if the quotes perform a rebound from the lower border of the side corridor on the 4-hour chart. Terms: "Non-commercial" - major market players: banks, hedge funds, investment funds, private, large investors. "Commercial" - commercial enterprises, firms, banks, corporations, companies that buy currency not for speculative profit, but for current activities or export-import operations. "Non-reportable positions" - small traders who do not have a significant impact on the price.
Author's today's articles: Torben Melsted  Born in November 1962. Graduated from CBS, got Diploma in Finance. Began trading on Forex in 1986 and since that time held various positions such as advising clients, hedging client flows on FX and commodity markets. Also worked for major corporations as Financial Risk Manager. Uses Elliott wave analysis in combination with classic technical analysis, and has been using a Calmar Ratio of 5.0 for over 3 years. Has his own blog, where he uses Elliott wave and technical analysis on all financial markets. Born in November 1962. Graduated from CBS, got Diploma in Finance. Began trading on Forex in 1986 and since that time held various positions such as advising clients, hedging client flows on FX and commodity markets. Also worked for major corporations as Financial Risk Manager. Uses Elliott wave analysis in combination with classic technical analysis, and has been using a Calmar Ratio of 5.0 for over 3 years. Has his own blog, where he uses Elliott wave and technical analysis on all financial markets. Irina Manzenko  Irina Manzenko Irina Manzenko Stanislav Polyanskiy  Graduated from Odessa State Economic University. On Forex since 2006. Writes analytical reviews about international financial markets for more than 3 years. Worked as a currency analyst in different finance companies for a long time including the biggest companies of Russia and Ukraine. Graduated from Odessa State Economic University. On Forex since 2006. Writes analytical reviews about international financial markets for more than 3 years. Worked as a currency analyst in different finance companies for a long time including the biggest companies of Russia and Ukraine. Vladislav Tukhmenev  Vladislav graduated from Moscow State University of Technologiy and Management. He entered the forex market in early 2008. Vladislav is a professional trader, analyst, and manager. He applies a whole gamut of analysis – technical, graphical, mathematical, fundamental, and candlestick analysis. Moreover, he forecasts the market movements using his own methods based on the chaos theory. Vladimir took part in development of trading systems devoted to fractal analysis. In his free time, Vladimir blogs about exchange markets. Hobbies: active leisure, sporting shooting, cars, design, and marketing. "I do not dream only of becoming the best in my field. I also dream about those who I will take with me along the way up." Vladislav graduated from Moscow State University of Technologiy and Management. He entered the forex market in early 2008. Vladislav is a professional trader, analyst, and manager. He applies a whole gamut of analysis – technical, graphical, mathematical, fundamental, and candlestick analysis. Moreover, he forecasts the market movements using his own methods based on the chaos theory. Vladimir took part in development of trading systems devoted to fractal analysis. In his free time, Vladimir blogs about exchange markets. Hobbies: active leisure, sporting shooting, cars, design, and marketing. "I do not dream only of becoming the best in my field. I also dream about those who I will take with me along the way up." Mihail Makarov  - - Maxim Magdalinin  In 2005 graduated from the Academy of the Ministry of Internal Affairs of the Republic of Belarus, law faculty. Worked as a lawyer for three years in one of the biggest country's company. Besides the trading, he develops trading systems, writes articles and analytical reviews. Works at stock and commodity markets explorations. On Forex since 2006. In 2005 graduated from the Academy of the Ministry of Internal Affairs of the Republic of Belarus, law faculty. Worked as a lawyer for three years in one of the biggest country's company. Besides the trading, he develops trading systems, writes articles and analytical reviews. Works at stock and commodity markets explorations. On Forex since 2006. Sebastian Seliga  Sebastian Seliga was born on 13th Oсtober 1978 in Poland. He graduated in 2005 with MA in Social Psychology. He has worked for leading financial companies in Poland where he actively traded on NYSE, AMEX and NASDAQ exchanges. Sebastian started Forex trading in 2009 and mastered Elliott Wave Principle approach to the markets by developing and implementing his own trading strategies of Forex analysis. Since 2012, he has been writing analitical reviews based on EWP for blogs and for Forex websites and forums. He has developed several on-line projects devoted to Forex trading and investments. He is interested in slow cooking, stand-up comedy, guitar playing, reading and swimming. "Every battle is won before it is ever fought", Sun Tzu Sebastian Seliga was born on 13th Oсtober 1978 in Poland. He graduated in 2005 with MA in Social Psychology. He has worked for leading financial companies in Poland where he actively traded on NYSE, AMEX and NASDAQ exchanges. Sebastian started Forex trading in 2009 and mastered Elliott Wave Principle approach to the markets by developing and implementing his own trading strategies of Forex analysis. Since 2012, he has been writing analitical reviews based on EWP for blogs and for Forex websites and forums. He has developed several on-line projects devoted to Forex trading and investments. He is interested in slow cooking, stand-up comedy, guitar playing, reading and swimming. "Every battle is won before it is ever fought", Sun Tzu Sergey Belyaev  Born December 1, 1955. In 1993 graduated from Air Force Engineering Academy. In September 1999 started to study Forex markets. Since 2002 has been reading lectures on the technical analysis . Is fond of research work. Created a personal trading system based on the indicator analysis. Authored the book on technical analysis "Calculation of the next candlestick". At present the next book is being prepared for publishing "Indicator Analysis of Forex Market. Trading System Encyclopedia". Has created eleven courses on indicator analysis. Uses classical indicators. Works as a public lecturer. Held numerous seminars and workshops presented at international exhibitions of financial markets industry. Is known as one of the best specialists in the Russian Federation researching indicator analysis. Born December 1, 1955. In 1993 graduated from Air Force Engineering Academy. In September 1999 started to study Forex markets. Since 2002 has been reading lectures on the technical analysis . Is fond of research work. Created a personal trading system based on the indicator analysis. Authored the book on technical analysis "Calculation of the next candlestick". At present the next book is being prepared for publishing "Indicator Analysis of Forex Market. Trading System Encyclopedia". Has created eleven courses on indicator analysis. Uses classical indicators. Works as a public lecturer. Held numerous seminars and workshops presented at international exhibitions of financial markets industry. Is known as one of the best specialists in the Russian Federation researching indicator analysis. Vyacheslav Ognev  Vyacheslav was born on August 24, 1971. In 1993, he graduated from Urals State University of Economics in the Russian city of Ekaterinburg holding a degree in Commerce and Economics of Trade. In 2007, he started concentrating on the Russian stock market, trading stocks on the RTS Stock Exchange and futures contracts on FORTS. Since 2008 he has been engaged in analyzing Forex market and trading currencies. He is an author of a simplified wave analysis method. He has also developed a trading strategy. At present, Vyacheslav is a co-author of training materials on two web portals dedicated to Forex trading education. Interests: fitness, F1 "Experience is the best of schoolmasters, only the school fees are heavy." - Thomas Carlyle Vyacheslav was born on August 24, 1971. In 1993, he graduated from Urals State University of Economics in the Russian city of Ekaterinburg holding a degree in Commerce and Economics of Trade. In 2007, he started concentrating on the Russian stock market, trading stocks on the RTS Stock Exchange and futures contracts on FORTS. Since 2008 he has been engaged in analyzing Forex market and trading currencies. He is an author of a simplified wave analysis method. He has also developed a trading strategy. At present, Vyacheslav is a co-author of training materials on two web portals dedicated to Forex trading education. Interests: fitness, F1 "Experience is the best of schoolmasters, only the school fees are heavy." - Thomas Carlyle Grigory Sokolov  Born 1 January, 1986. In 2008 graduated from Kiev Institute of Business and Technology with "Finance and Credit" as a major. Since 2008 has studied the behavior of various currency pairs and their correlation on Forex. In his works and trading practice he uses candlestick analysis and Fibonacci technique. Since 2009 has written analytical reviews and articles which are published on popular Internet resources. Interests: music, computers and cookery. "Out of five deadly sins of business and as a rule, the most widespread, excessive striving to get profit is the worst". P. Drucker Born 1 January, 1986. In 2008 graduated from Kiev Institute of Business and Technology with "Finance and Credit" as a major. Since 2008 has studied the behavior of various currency pairs and their correlation on Forex. In his works and trading practice he uses candlestick analysis and Fibonacci technique. Since 2009 has written analytical reviews and articles which are published on popular Internet resources. Interests: music, computers and cookery. "Out of five deadly sins of business and as a rule, the most widespread, excessive striving to get profit is the worst". P. Drucker
Subscription's options management Theme's:
Fundamental analysis, Fractal analysis, Wave analysis, Technical analysis, Stock Markets
Author's :
A Zotova, Aleksey Almazov, Alexander Dneprovskiy, Alexandr Davidov, Alexandros Yfantis, Andrey Shevchenko, Arief Makmur, Dean Leo, Evgeny Klimov, Fedor Pavlov, Grigory Sokolov, I Belozerov, Igor Kovalyov, Irina Manzenko, Ivan Aleksandrov, l Kolesnikova, Maxim Magdalinin, Mihail Makarov, Mohamed Samy, Mourad El Keddani, Oleg Khmelevskiy, Oscar Ton, Pavel Vlasov, Petar Jacimovic, R Agafonov, S Doronina, Sebastian Seliga, Sergey Belyaev, Sergey Mityukov, Stanislav Polyanskiy, T Strelkova, Torben Melsted, V Isakov, Viktor Vasilevsky, Vladislav Tukhmenev, Vyacheslav Ognev, Yuriy Zaycev, Zhizhko Nadezhda
Edit data of subscription settings
Unsubscribe from the mailing list Sincerely,
Analysts Service | If you have any questions, you can make a phone call using one of the
InstaForex Toll free numbers right now:
|  | InstaForex Group is an international brand providing online trading services to the clients all over the world. InstaForex Group members include regulated companies in Europe, Russia and British Virgin Islands. This letter may contain personal information for access to your InstaForex trading account, so for the purpose of safety it is recommended to delete this data from the history. If you have received this letter by mistake, please contact InstaForex Customer Relations Department. |


No comments:
Post a Comment