| EUR/USD: plan for the European session on October 19. COT reports. Euro buyers leave the market. Breakout of 1.1722 necessary to resume growth 2020-10-19 To open long positions on EUR/USD, you need: Sell positions on the euro could only be observed during the European session, where the bulls were actively defending the 1.1722 area. I analyzed this signal in more detail in last Friday's review. No signals to enter the market in the afternoon, and the breakout of 1.1722, which took place before the good US retail sales growth report was released, did not form a convenient long entry point, since there was no downward test at 1.1722. As a result, by the end of the day the market returned to the area below the aforementioned range, keeping the market under the control of sellers. Before talking about today's prospects for the pair's movement, let's look at the situation in the futures market, which tells us that the number of people willing to buy euros has decreased in October this year. The weak prospects for European economic recovery, expectations of a new monetary stimulus program from the European Central Bank and a new wave of COVID-19 in many EU countries are forcing traders to take a wait-and-see attitude, as well as reduce their long positions in the European currency. The Commitment of Traders (COT) report for October 13 showed a decrease in long positions and an increase in short ones, which led to an even greater decline in the delta. Despite this, buyers of risky assets believe that the bull market will continue, but they prefer to act with caution, as there is no good news for the eurozone yet. Thus, long non-commercial positions decreased from 231,369 to 228,295, while short non-commercial positions increased from 57,061 to 59,658. The total non-commercial net position decreased to 168,637, against 174,308 a week earlier. which indicates a wait-and-see attitude from new players, however, bullish sentiments for the euro remain rather high in the medium term. The more the euro will decline against the US dollar at the end of this year, the more attractive it will be for new investors. 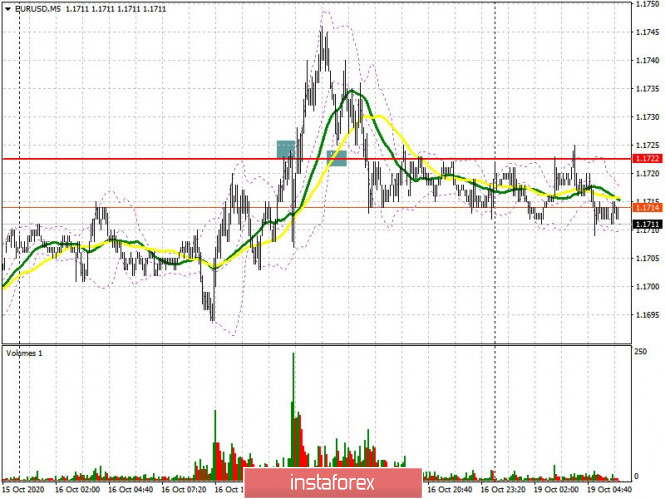 As for the technical picture of the pair, it hasn't changed much compared to last Friday. Bulls are focused on the 1.1722 level and the pair's direction for the long term will depend on their actions in this range. Now the bulls are trying to gain a foothold above this area, but only a real breakout and a test of this range from top to bottom, which buyers could not show during last Friday's US session, forms a signal to open long positions in anticipation of sustaining the upward correction to the resistance area of 1.1756, where I recommend taking profits. If the bears manage to protect this range in the first half of the day, and today we only have speeches from the heads of the European Central Bank and the Federal Reserve, then it is best to postpone taking buy positions and wait for an update of the weekly low of 1.1688, where forming a false breakout will be a signal to open long positions. It is dangerous to buy from this level immediately on a rebound, since this will be the fifth consecutive test. Otherwise, I recommend buying EUR/USD only for a rebound from the new low of 1.1644, counting on a correction of 15-20 points within the day. To open short positions on EUR/USD, you need: Sellers will continue to try to protect resistance at 1.1722, but there is no need to rush to sell from this level. It is best to wait until bulls make another unsuccessful attempt to go beyond 1.1722 and then to return to this range. This scenario will lead to producing a larger downward wave to the support area at 1.1688. An equally important task for continuing the bear market is a breakout of this range, settling in the area below it produces a new signal for selling the euro with the main goal of testing a new low around 1.1644, where I recommend taking profit. The pressure on the euro could significantly increase if ECB President Christine Lagarde speaks directly about easing monetary policy in today's speech. If the bulls turn out to be stronger in the first half of the day, then it is best to postpone sell positions until the high of 1.1756 has been updated, counting on a correction from it by 15-20 points within the day. 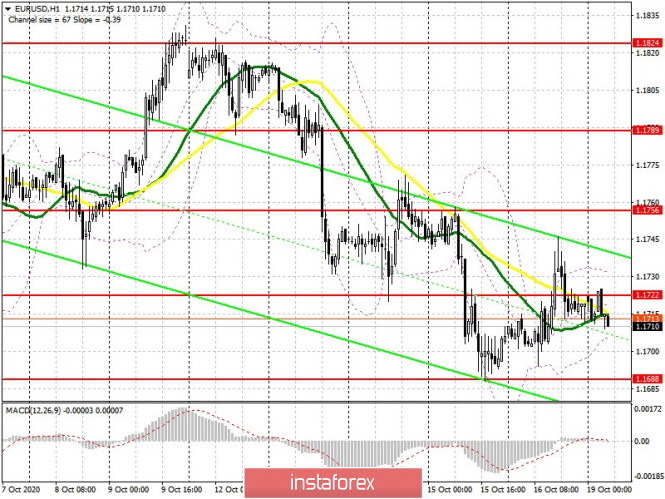 Indicator signals: Moving averages Trading is carried out in the area of 30 and 50 moving averages, which indicates market uncertainty regarding its direction for the long term, but with a slight advantage for sellers of the euro. Note: The period and prices of moving averages are considered by the author on the H1 hourly chart and differs from the general definition of the classic daily moving averages on the daily D1 chart. Bollinger Bands A breakout of the lower border of the indicator around 1.1705 will increase pressure on the euro. The breakout of the upper border in the 1.1730 area will lead to another attempt to strengthen the pair. Description of indicators - Moving average (moving average, determines the current trend by smoothing out volatility and noise). Period 50. It is marked in yellow on the chart.
- Moving average (moving average, determines the current trend by smoothing out volatility and noise). Period 30. It is marked in green on the chart.
- MACD indicator (Moving Average Convergence/Divergence — convergence/divergence of moving averages) Quick EMA period 12. Slow EMA period to 26. SMA period 9
- Bollinger Bands (Bollinger Bands). Period 20
- Non-commercial speculative traders, such as individual traders, hedge funds, and large institutions that use the futures market for speculative purposes and meet certain requirements.
- Long non-commercial positions represent the total long open position of non-commercial traders.
- Short non-commercial positions represent the total short open position of non-commercial traders.
- Total non-commercial net position is the difference between short and long positions of non-commercial traders.
GBP/USD: plan for the European session on October 19. COT reports. Traders leave the pound as uncertainty grows on Brexit trade deal 2020-10-19 To open long positions on GBP/USD, you need: The bulls had to defend support at 1.2865 last Friday afternoon, but this level was not reached, and we missed it by around a dozen points. The same cannot be said about the resistance of 1.2945, from which I recommended opening short positions. Speeches by British Prime Minister Boris Johnson on the Brexit trade deal are weighing on the pound, which could decline earlier this week. There were no particular changes in the futures market, but it is worth noting the fact that traders are closing positions and prefer to be out of the market. Bears are still in control of the situation, and the horizontal channel, in which the pair has been spending the last few weeks, has remained. Uncertainty about Brexit and the prospects for the recovery of the British economy, together with risks that the Bank of England might impose negative risks and the introduction of restrictive and quarantine measures due to the surge in the number of coronavirus infections, will continue to restrain demand for the pound and put pressure on it. The Commitment of Traders (COT) reports for October 13 showed that both long and short non-commercial positions have decreased. Long non-commercial positions declined from 40,698 to 36,195. At the same time, short non-commercial positions significantly dropped from 51,996 to 45,997. As a result, the negative value of the non-commercial net position slightly increased to -9 802 , against -11,298 a week earlier, which indicates that sellers of the British pound retain control and also shows their slight advantage in the current situation. 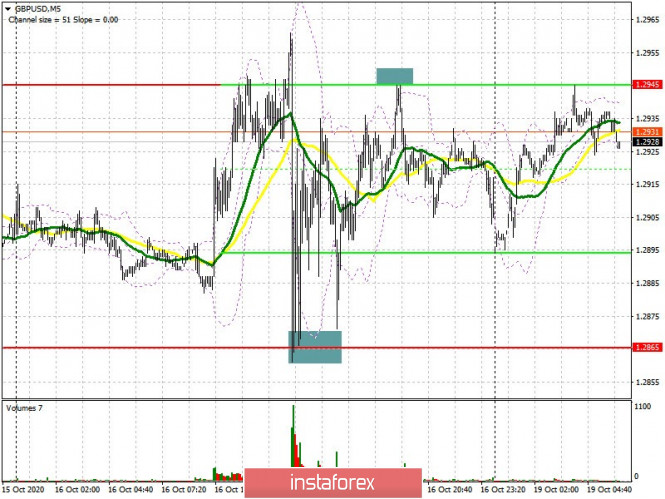 From a technical point of view, there have been no global changes in the pair. Buyers of the pound will continue to focus on resistance at 1.2945, since they failed to go above this area last Friday. Getting the pair to settle at this level will open the possibility for a new wave of GBP/USD growth in the 1.3007 area, but a lot will depend on how the Brexit issue will progress. We can expect a slight decrease in tension on this issue, which will provide short-term support for the pound at the beginning of the week. Therefore, settling above 1.3007 will lead to a test of the 1.3080 high, where I recommend taking profits. Protecting support at 1.2865, which the bulls coped with at the end of last week, will also be an important task. In case the pair repeatedly falls there, and this will be the fifth consecutive test, forming a false breakout in this area will be a signal to open new long positions in hopes to strengthen GBP/USD. In case bulls are not active in this range, it is better not to rush to buy, but to wait until the nearest large support level in the 1.2807 area has been tested. You can also open long positions immediately on a rebound from the low of 1.2749, counting on a correction of 20-30 points within the day. To open short positions on GBP/USD, you need: Sellers need to defend resistance at 1.2945, but a lot will depend on news regarding the Brexit trade deal, since we do not have fundamental reports on Monday. Forming a false breakout at 1.2945 creates a sell signal for the pound, but big bearish pressure requires bad Brexit news, similar to the one we heard from Boris Johnson last Friday. We can only expect a significant fall from the pound when we have gotten the pair to settle in the area below support at 1.2865, afterwards it could return to the 1.2807 area. A low of 1.2749 will be a distant target, which is where I recommend taking profit. In case the pair grows in the first half of the day and there is no activity in the resistance area of 1.2945, it is best to postpone short positions until the high of 1.3008 has been tested, where you can sell the pound immediately on a rebound, counting on a 20-30 point correction within the day. 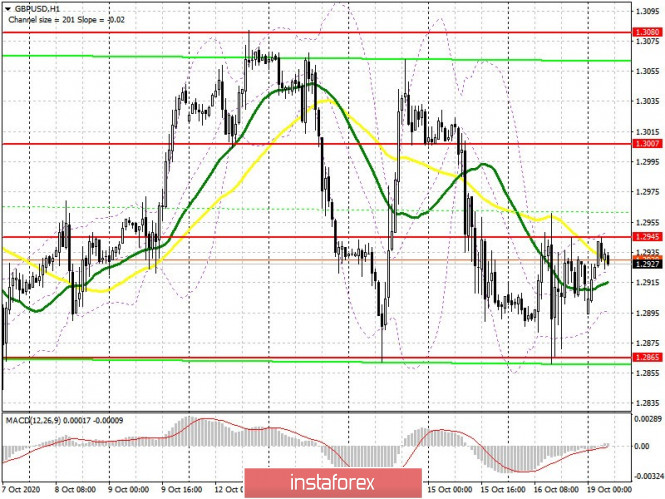 Indicator signals: Moving averages Trading is carried out in the area of 30 and 50 moving averages, which indicates how buyers and sellers find the pair's succeeding direction quite difficult. Note: The period and prices of moving averages are considered by the author on the H1 hourly chart and differs from the general definition of the classic daily moving averages on the daily D1 chart. Bollinger Bands A breakout of the upper border of the indicator in the 1.2945 area will lead to a new wave of growth for the pound. A breakout of the lower boundary at 1.2895 will lead to renewed pressure on the pair. Description of indicators - Moving average (moving average, determines the current trend by smoothing out volatility and noise). Period 50. It is marked in yellow on the chart.
- Moving average (moving average, determines the current trend by smoothing out volatility and noise). Period 30. It is marked in green on the chart.
- MACD indicator (Moving Average Convergence/Divergence — convergence/divergence of moving averages) Quick EMA period 12. Slow EMA period to 26. SMA period 9
- Bollinger Bands (Bollinger Bands). Period 20
- Non-commercial speculative traders, such as individual traders, hedge funds, and large institutions that use the futures market for speculative purposes and meet certain requirements.
- Long non-commercial positions represent the total long open position of non-commercial traders.
- Short non-commercial positions represent the total short open position of non-commercial traders.
- Total non-commercial net position is the difference between short and long positions of non-commercial traders.
Technical Analysis of EUR/USD for October 19, 2020 2020-10-19 Technical Market Outlook: The EUR/USD pair has been seen moving lower at the beginning of the trading week. The last lower low was made at the level of 1.1688, just below the technical support seen at the level of 1.1696 and this is the next target for the bears. The nearest technical resistance is seen at the level of 1.1746. Despite the oversold conditions, the momentum remains weak and negative, which support the short-term bearish outlook. Weekly Pivot Points: WR3 - 1.1924 WR2 - 1.1873 WR1 - 1.1783 Weekly Pivot - 1.1733 WS1 - 1.1641 WS2 - 1.1593 WS3 - 1.1509 Trading Recommendations: Since the middle of March 2020 the main trend is on EUR/USD pair has been up, which can be confirmed by almost 10 weekly up candles on the weekly time frame chart and 4 monthly up candles on the monthly time frame chart. Nevertheless, weekly chart is recently showing some weakness in form of a several Pin Bar candlestick patterns at the recent top seen at the level of 1.2004. This means any corrections should be used to buy the dips until the key technical support is broken. The key long-term technical support is seen at the level of 1.1445. The key long-term technical resistance is seen at the level of 1.2555. 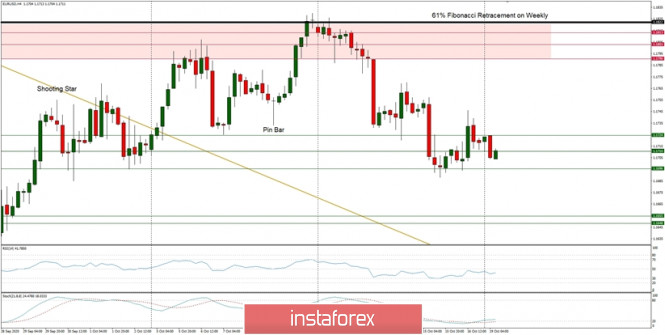
Technical Analysis of GBP/USD for October 19, 2020 2020-10-19 Technical Market Outlook: The GBP/USD pair keeps testing the upper channel line after the market had been rejected from the supply zone located between the levels of 1.3059 - 1.3081. This zone will be the key short-term zone for both bulls and bears and only a clear and sustained breakout will show the traders the next direction for Pound. In a case of a bullish scenario, the next target would be 1.3121 and the next target for bears is seen at the level of 1.2868 and 1.2848. Weekly Pivot Points: WR3 - 1.3222 WR2 - 1.3147 WR1 - 1.3005 Weekly Pivot - 1.2924 WS1 - 1.2790 WS2 - 1.2718 WS3 - 1.2567 Trading Recommendations: On the GBP/USD pair the main, multi-year trend is down, which can be confirmed by the down candles on the monthly time frame chart. The key long-term technical resistance is still seen at the level of 1.3518. Only if one of these levels is clearly violated, the main trend might reverse (1.3518 is the reversal level) or accelerate towards the key long-term technical support is seen at the level of 1.1903 (1.2589 is the key technical support for this scenario). 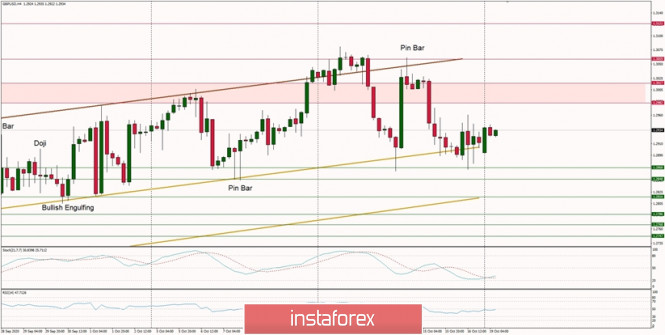
Brief trading recommendations for EUR/USD on 10/19/20 2020-10-19 
Last Friday, the EURUSD currency pair found a foothold near the support level of 1.1700, where a stop occurred naturally, followed by a pullback in the direction of 1.1745. The level of 1.1700 has been acting as a support in the market for a long time, where there is a regular stop with a successive pullback. It is worth considering that although the market is strong, it can also not stand with a large number of sellers, as happened in September. Thus, in such situations, it is worth working both for a rebound and for a breakdown just like last Friday. Regarding the current location of the quote, you can see a variable price fluctuation within the support level of 1.1700, where the quote re-tests the pivot point for strength. Based on the location of the quote and the reference support level, you can make a trading forecast from several possible market development scenarios. First, a repeated approach with the level leads to a slowdown. The quote already reached the level of 1.1700, where a variable fluctuation in the range of 1.1695/1.1730 is possible, which will lead to the accumulation of trading forces and consecutive acceleration. Second, the volume of sellers increased. The repeated approach to the level of 1.1700 led to an increase in the volume of short positions (sell positions), which caused the key level to break down. The best entry point is the level of 1.1685, with a development prospect of 1.1650-1.1615. 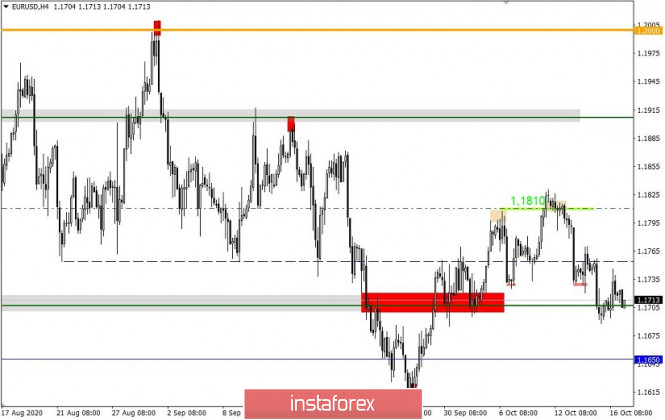
GBP/USD: How could the pound survive negative rates? 2020-10-19  The pound can be confused by the problem of negative rates that the Bank of England is facing. At the moment, the pound is looking for growth opportunities, but there are fewer of them. Analysts say that the indicated currency has almost no trump cards left, which is worsened by the high probability of a "no-deal" Brexit. Britain's economy will be greatly affected by Brexit without a deal. Experts believe that the pound will suffer the most if the trade deal with the countries of the European bloc is canceled, which could decline from 1.7% to 4.7% in the GBP/USD pair. Moreover, they cannot exclude the possibility of a decline to the critical level of 1.2300, although it is currently far from these indicators. Today, the GBP/USD pair is trading near the range of 1.2928-1.2929, trying to consolidate at this level. According to economists, there will be a problem with economic stability if both parties do not compromise and prolong the transition period, which ends on December 31, 2020. A key role in this issue is played by BoE's potential introduction of negative rates. This probability increases in case of a chaotic Brexit or a sharp deterioration in the COVID-19 situation. If this scenario is implemented, the lower yield limit on 10-year government bonds, which is currently at 0%, will be lifted. Experts estimate the probability of introducing negative rates in November as low, but do not exclude this in the medium term. A full transition to zero rates (a reduction of 10 bps) is also unlikely, but this option should not be ruled out. Next year, the Bank of England may move to negative rates, although many experts believe that the regulator will delay this decision until the last moment. Moreover, the department is not sure of the sufficient effectiveness of the new measure, so the monetary authorities are not in a hurry to move into the negative zone. Much will depend on the establishment of trade relations with the EU as well as the situation with COVID-19. It should be noted that the pound is not surprised by negative rates, although it is risky. Based on preliminary calculations, negative rates of -0.25%, along with additional quantitative easing in the amount of £ 100 billion, will significantly affect the fair value of 10-year government bonds. As a result, the lower limit of the yield on government securities, which is at the level of 0%, will disappear. Against this background, the fair value of 10-year government bonds will be at a low of -0.20% by mid 2021. Economists draw attention to the most important fact related to BoE's possibility of introducing negative rates. In the current situation, the circumstances under which they are implemented are very important. The "core" of such a decision is the likelihood of a "hard" Brexit. If this happens, the pound may suffer much more than from the direct introduction of negative rates. Analysts are unanimous about the extremely negative impact of a no-deal Brexit on its further dynamics; nevertheless, we can say that Brexit without a deal will affect the pound more compared to the impact of negative rates. Moreover, negative rates are already embedded in the pound's dynamics, which is considered by the market. If such a decision is made, it will not come as a surprise to traders and investors. What's vital for the pound is the reason for the rate cut, which lies in the no-deal Brexit. The implementation of such a scenario entails a number of devastating consequences: a decline both in mutual trust and prospects for the British economy, a decline in the rate of economic growth in the country and future labor productivity. The lack of a compromise between London and Brussels will hit the fair value of the pound, which will lead to its collapse in the medium and long term. In turn, the predictability of a "hard" Brexit does not negate a possible shock to the British economy. Such an outcome may temporarily paralyze the market, which will take a long time to recover. At the same time, the negative consequences for the GBP is caused by the rate cut, in view of shocks provoked by the UK's withdrawal from the Eurobloc. Thus, experts conclude that a possible rejection of the trade agreement will be fatal for the pound, and breaking through the downward trend will be long and difficult. Technical analysis of EUR/USD for October 19, 2020 2020-10-19 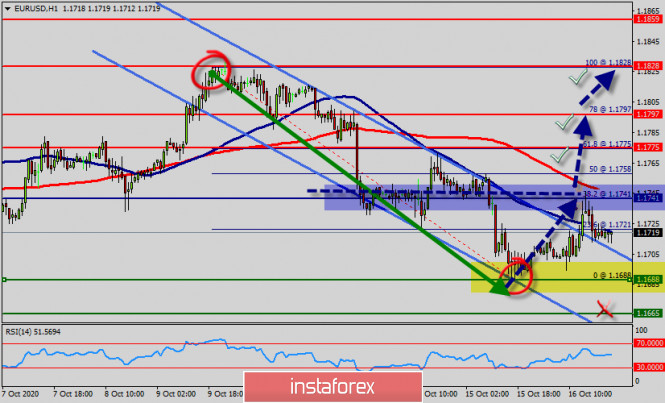 A general review : Last week, the EUR/USD pair ended the weekly session at 1.1719, in a area of a very strong mid-term support, which has stopped its decline many times over the past 5 days. The EURUSD pair clears major supprt at 1.1688 levels over the past week. The structure remains constructive for a continued decline but an impulse looks to be complete. The saturation state is clear for the region of 1.1688. The EURUSD pair dropped sharply from the level of 1.1828 towards 1.1688. Now, the price is set at 1.1741 to act as a weekly pivot point. It should be noted that volatility is very high for that the EURUSD pair is still moving between 1.1688 and 1.1797 in coming hours. The EURUSD pair is expected to produce a corrective drop towards 1.1688 at least, before resuming its rally higher. It is not a certainty but probability remains high for a corrective drop before the rally could resume. Price has dropped strongly after breaking our ascending support line and has reached our profit target perfectly. We prepare to buy on dips above the 1.1688 level (support) for a bounce up to at least 1.1741 resistance (38.2% Fibonacci retracement, pivot point). We shall wait for a confirmation of a bullish reversal after breaking up the wekly pivot point of 1.1741. Today, the EUR/USD pair will be prbably continuing to move upwards from the level of 1.1688. So, the pair will rebound from the bottom of 1.1688 in order to call for a strong bullish market this week. The first support level is seen at 1.1688, the price is moving in a bullish channel now. Furthermore, the price has been setting above the strong support at the level of 1.1688. This support (1.1688) has rejected several times confirming the veracity of an uptrend. Additionally, RSI starts signaling an upward trend. RSI (14) sees major descending support line acting as support to push price up from the zone of 1.1688 - 1.1700. As a result, if the EUR/USD pair is able to break out the first resistance at 1.1741, the market will rise further to 1.1775 so as to test the weekly resistance 2. Consequently, the market is likely to show signs of a bullish trend. So, it will be good to buy above the level of 1.1688 with the first target at 1.1741 and further to 1.1775. Since then, the currency has remained in control of bulls carving a series of higher lows and higher highs through 1.1775 handle. Also note that the above rally seems to be an impulse wave. Moreover, Buy-deals are recommended above 1.1741 with the first target seen at 1.1775. The movement is likely to resume to the point 1.1797 and further to the point 1.1828. However, The EURUSD pair rally could resume thereafter and head towards 1.1797 mark going further. Only a break below 1.1688 would change the above bullish structure. Overall, we still prefer the bullish scenario which suggests that the pair will stay above the spot of 1.1688. Conclusion : The EUR/USD pair is continuing to move in a bullish trend from the new support level of 1.1688, to form a bullish channel. Amid the previous events, we expect the pair to move between 1.1688 and 1.1797. Therefore, buy above the level of 1.1688 with the first target at 1.1741 with a view to test the daily resistance 1 and further to 1.1775 then we will see new objectives of 1.1797 and 1.1828. Nevertheless, if the pair fails to pass through the level of 1.1741, the market will indicate a bearish opportunity below the level of 1.1741. The market will decline further to 1.1688. Technical analysis of AUD/USD for October 19, 2020 2020-10-19 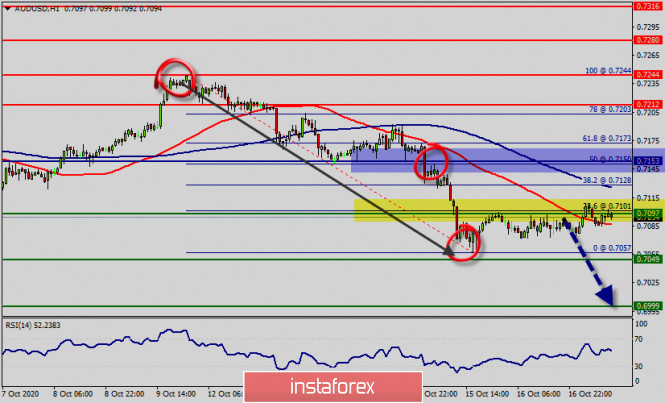 Overview : Pivot : 0.7153. The AUD/USD pair declined from the 0.7153 level towards 0.7057, then closed at 0.7097. The level of 0.7153 acts as a daily pivot point. The pair is trading below its pivot point. It is likely to trade in a lower range as long as it remains below the pivot point. Short positions are recommended with the first target at 0.7097. A break of that target will move the pair further downwards to 0.7049. The pivot point stands at 0.7153. It should be noted that the volatility is very high for that the price of the AUD/USD pair is still moving between 0.7153 and 0.6999 in the coming hours. Furthermore, the price has set below the strong resistance at the levels of 0.7153 and 0.7188 which coincide with the 38.2% and 61.8% Fibonacci retracement levels respectively. Additionally, currently the price is in a bearish channel. According to the previous events, the pair is still in a downtrend. From this point, the AUD/USD pair is continuing in a bearish trend from the new resistance of 0.7153. Thereupon, the price spot of 0.7153 and 0.7188 remains a significant resistance zone. Therefore, the possibility that the Aussie will have a downside momentum is rather convincing and the structure of the fall does not look corrective. In order to indicate a bearish opportunity below 0.7097, it will be a good signal to sell below 0.7097 with the first target of 0.7040. It is equally important that it will call for downtrend in order to continue bearish trend towards 0.6999. On the contrary, stop loss should be placed at the price of 0.7212 (above the daily resistance). The bullish outlook remains the same as long as the RSI indicator is pointing to the upside on the one-hour chart. Hence, the stop loss should be located above the level of 0.7215. Trading plan for the EUR/USD pair on October 19. Second pandemic wave in Europe and the November US presidential election. 2020-10-19 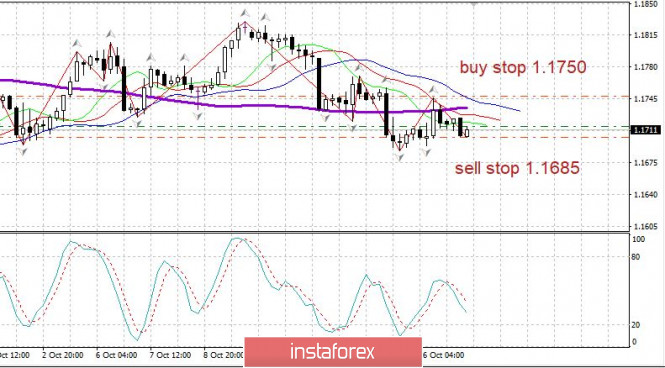
EUR / USD: The euro is currently under pressure due to the second pandemic wave in Europe, but then the outlook for the dollar is also unclear. As a result, the EUR / USD pair has no clear direction yet in the market. Set long positions from 1.1750 to 1.1705. Set short positions from 1.1685 to 1.1730. Keep in mind that around 1.1608, there is strong support on the daily scale. 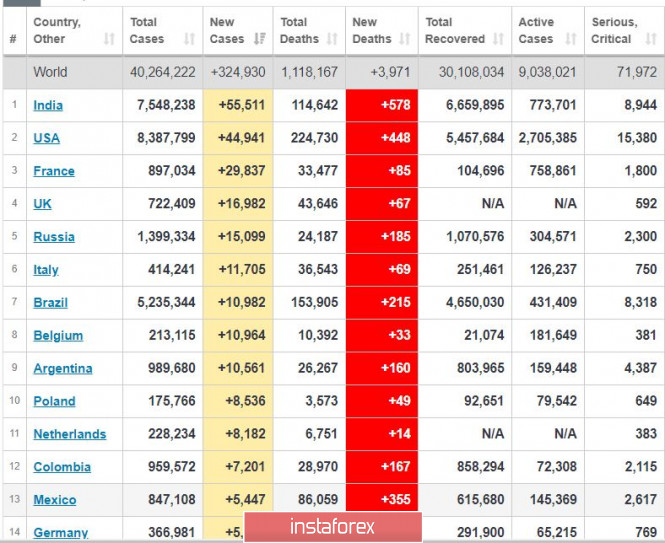
Everything is bad in Europe. France has already reached third place in the highest rate of incidence worldwide, having recorded 30 thousand new coronavirus patients a day. Germany and Poland have also been added to the list, after listing 5-8 thousand new cases a day. Meanwhile, there was a decline in cases in the United Kingdom, to below 45 thousand a day. 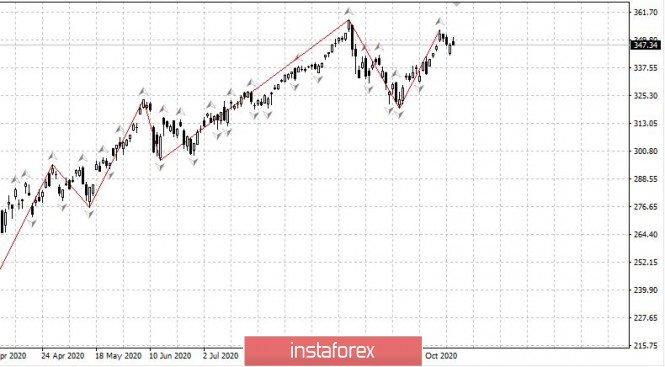
US market: As expected, sales appeared around the yearly highs. You may continue selling around it because in the coming US presidential election, it is likely that Biden will win, which means that tax and budget policies will be revised, and this will bring negative effects to the market. Trading idea for the GBP/USD pair 2020-10-19  Brexit negotiations ended again without much progress, and this is because both parties still failed to compromise over a trade agreement. Despite that, the GBP / USD pair remained afloat in the market, which is also very surprising, considering that other currencies, the euro for example, has fallen against the US dollar. Below is the result of the failed negotiations last Friday: 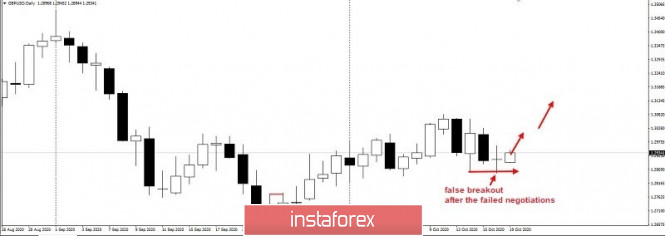 As we can see, instead of a large bearish candle in the daily chart, a "spinning top" pattern has formed, which speaks more about uncertainty, and not about the panic of investors from the pound. If we look at the shorter time frames, an even more interesting picture emerges: 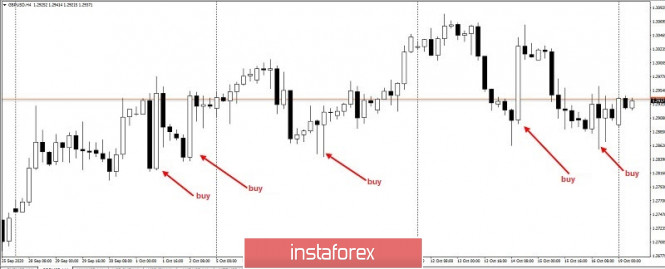 The pair is clearly being methodically bought around price levels 1.28-1.285, and this has been happening for three weeks already. Taking into account this scenario, the optimal strategy is to open long positions and set it towards the level of 1.35. In addition, there remains hope that a post-Brexit trade deal will be signed, as UK Prime Minister Borish Johnson continues to make it clear that the UK is open for a compromise. Michel Barnier and David Frost will also exchange dialogue again on this issue early next week. Best of luck!
Author's today's articles: Maxim Magdalinin  In 2005 graduated from the Academy of the Ministry of Internal Affairs of the Republic of Belarus, law faculty. Worked as a lawyer for three years in one of the biggest country's company. Besides the trading, he develops trading systems, writes articles and analytical reviews. Works at stock and commodity markets explorations. On Forex since 2006. In 2005 graduated from the Academy of the Ministry of Internal Affairs of the Republic of Belarus, law faculty. Worked as a lawyer for three years in one of the biggest country's company. Besides the trading, he develops trading systems, writes articles and analytical reviews. Works at stock and commodity markets explorations. On Forex since 2006. Sebastian Seliga  Sebastian Seliga was born on 13th Oсtober 1978 in Poland. He graduated in 2005 with MA in Social Psychology. He has worked for leading financial companies in Poland where he actively traded on NYSE, AMEX and NASDAQ exchanges. Sebastian started Forex trading in 2009 and mastered Elliott Wave Principle approach to the markets by developing and implementing his own trading strategies of Forex analysis. Since 2012, he has been writing analitical reviews based on EWP for blogs and for Forex websites and forums. He has developed several on-line projects devoted to Forex trading and investments. He is interested in slow cooking, stand-up comedy, guitar playing, reading and swimming. "Every battle is won before it is ever fought", Sun Tzu Sebastian Seliga was born on 13th Oсtober 1978 in Poland. He graduated in 2005 with MA in Social Psychology. He has worked for leading financial companies in Poland where he actively traded on NYSE, AMEX and NASDAQ exchanges. Sebastian started Forex trading in 2009 and mastered Elliott Wave Principle approach to the markets by developing and implementing his own trading strategies of Forex analysis. Since 2012, he has been writing analitical reviews based on EWP for blogs and for Forex websites and forums. He has developed several on-line projects devoted to Forex trading and investments. He is interested in slow cooking, stand-up comedy, guitar playing, reading and swimming. "Every battle is won before it is ever fought", Sun Tzu Vladislav Tukhmenev  Vladislav graduated from Moscow State University of Technologiy and Management. He entered the forex market in early 2008. Vladislav is a professional trader, analyst, and manager. He applies a whole gamut of analysis – technical, graphical, mathematical, fundamental, and candlestick analysis. Moreover, he forecasts the market movements using his own methods based on the chaos theory. Vladimir took part in development of trading systems devoted to fractal analysis. In his free time, Vladimir blogs about exchange markets. Hobbies: active leisure, sporting shooting, cars, design, and marketing. "I do not dream only of becoming the best in my field. I also dream about those who I will take with me along the way up." Vladislav graduated from Moscow State University of Technologiy and Management. He entered the forex market in early 2008. Vladislav is a professional trader, analyst, and manager. He applies a whole gamut of analysis – technical, graphical, mathematical, fundamental, and candlestick analysis. Moreover, he forecasts the market movements using his own methods based on the chaos theory. Vladimir took part in development of trading systems devoted to fractal analysis. In his free time, Vladimir blogs about exchange markets. Hobbies: active leisure, sporting shooting, cars, design, and marketing. "I do not dream only of becoming the best in my field. I also dream about those who I will take with me along the way up." l Kolesnikova  text text Mourad El Keddani  Was born in Oujda, Morocco. Currently lives in Belgium. In 2003 obtained B.S. in Experimental Sciences. In 2007 obtained a graduate diploma at Institut Marocain Specialise en Informatique Applique (IMSIA), specialty – Software Engineering Analyst. In 2007–2009 worked as teacher of computer services and trainer in a professional school specializing in computer technologies and accounting. In 2005 started Forex trading. Authored articles and analytical reviews on Forex market on Forex websites and forums. Since 2008 performs Forex market research, and develops and implements his own trading strategies of Forex analysis (especially in Forex Research & Analysis, Currency Forecast, and Recommendations and Analysis) that lies in: Numerical analysis: Probabilities, equations and techniques of applying Fibonacci levels. Classical analysis: Breakout strategy and trend indicators. Uses obtained skills to manage traders' accounts since 2009. In April 2009 was certified Financial Technician by the International Federation of Technical Analysts. Winner of several social work awards: Education Literacy and Non-Formal Education (in Literacy and Adult Education in The National Initiative for Human Development). Was born in Oujda, Morocco. Currently lives in Belgium. In 2003 obtained B.S. in Experimental Sciences. In 2007 obtained a graduate diploma at Institut Marocain Specialise en Informatique Applique (IMSIA), specialty – Software Engineering Analyst. In 2007–2009 worked as teacher of computer services and trainer in a professional school specializing in computer technologies and accounting. In 2005 started Forex trading. Authored articles and analytical reviews on Forex market on Forex websites and forums. Since 2008 performs Forex market research, and develops and implements his own trading strategies of Forex analysis (especially in Forex Research & Analysis, Currency Forecast, and Recommendations and Analysis) that lies in: Numerical analysis: Probabilities, equations and techniques of applying Fibonacci levels. Classical analysis: Breakout strategy and trend indicators. Uses obtained skills to manage traders' accounts since 2009. In April 2009 was certified Financial Technician by the International Federation of Technical Analysts. Winner of several social work awards: Education Literacy and Non-Formal Education (in Literacy and Adult Education in The National Initiative for Human Development).
Languages: Arabic, English, French and Dutch.
Interests: Algorithm, Graphics, Social work, Psychology and Philosophy. Mihail Makarov  - - Andrey Shevchenko  Andrey Shevchenko Andrey Shevchenko
Subscription's options management Theme's:
Fundamental analysis, Fractal analysis, Wave analysis, Technical analysis, Stock Markets
Author's :
A Zotova, Aleksey Almazov, Alexander Dneprovskiy, Alexandr Davidov, Alexandros Yfantis, Andrey Shevchenko, Arief Makmur, Dean Leo, Evgeny Klimov, Fedor Pavlov, Grigory Sokolov, I Belozerov, Igor Kovalyov, Irina Manzenko, Ivan Aleksandrov, l Kolesnikova, Maxim Magdalinin, Mihail Makarov, Mohamed Samy, Mourad El Keddani, Oleg Khmelevskiy, Oscar Ton, Pavel Vlasov, Petar Jacimovic, R Agafonov, S Doronina, Sebastian Seliga, Sergey Belyaev, Sergey Mityukov, Stanislav Polyanskiy, T Strelkova, Torben Melsted, V Isakov, Viktor Vasilevsky, Vladislav Tukhmenev, Vyacheslav Ognev, Yuriy Zaycev, Zhizhko Nadezhda
Edit data of subscription settings
Unsubscribe from the mailing list Sincerely,
Analysts Service | If you have any questions, you can make a phone call using one of the
InstaForex Toll free numbers right now:
|  | InstaForex Group is an international brand providing online trading services to the clients all over the world. InstaForex Group members include regulated companies in Europe, Russia and British Virgin Islands. This letter may contain personal information for access to your InstaForex trading account, so for the purpose of safety it is recommended to delete this data from the history. If you have received this letter by mistake, please contact InstaForex Customer Relations Department. |


No comments:
Post a Comment