

Every Friday I share a trading tip that illustrates one of the powerful tools you can use to improve your trading. The truth is, investing in YOU is the most effective way to increase your wins. If you are looking for an amazing opportunity to collect a ton of tips and trading ideas be sure to join me next week at the Online Trading Conference. It is free and I will be online with 39 other top trading educators, sharing our tips. Sign up here to make sure you don't miss it.
There is something very interesting about option trading. If everyone wanted to do it; if they all wanted the same thing, it wouldn’t change a thing. There is enough for all. And you in the right place. I am going to help you learn!
Here’s What Is Covered Below:
- Average Directional Index (ADX)
- Red and Green Lines- what do they mean?
- Which is best?
- Apply them to a chart strategy.
Today, we are going to discuss the Average Directional Index (ADX) and how to apply the information it shares.
In general terms, chart indicators paint a picture of what is happening with price. They tell you where price has been and where it will likely go next. Some indicators like ADX give a clue about the strength of the move.
On past Fridays, we have discussed different time frame charts and other indicators. I feel like ADX is an important indicator and it takes information to know how to read the chart indicator. It isn’t hard, it just takes an understanding of the lines incorporated within the indicator.
The ADX indictor includes or is made up of 3 lines: red, green and black.
Red line= Bear movement- drop in price- -DI
Green= Bullish movement- rise in price- +DI
Black= Strength
The chart below is for Amazon (AMZN) that I use as a great example of how ADX works:

Stockcharts.com

The chart above has two ADX indicators. The bottom one is just the ADX strength line and the one above had the Directional Index lines (+DI and -DI).
Let’s start with the ADX indicator (just the black line). It is a strength line. When it is rising, it means that there is lots of strength in the move. Notice the rise on December 5th. That is a strong move based on the ADX line and another strong move appears to be starting today as I type on the 12th.
The rising line shares information about strength, but it doesn’t tell us if the move is a strong drop in price or a rise and this is where the indicator with the DI lines comes in handy.
Look at the upper ADX indicator with the red/green lines. On December 5th, the line on top was red, which means price was having a strong drop. It is the same today on the 12th, the red line is on top.
If you look at December 9th, the ADX line rose for a short period while the green line was on top and then it flattened out. A flat is likely just exactly what you imagine. Flat price, no strength in either direction.
When the black line drops, it is showing that previous strength is fading which often gives the opposite DI line the opportunity to flex its muscles and move to the top.
If you are trading Put options, the strength behind the red line will be important to you. If you are trading Call options, the green line on top will show it is in control.
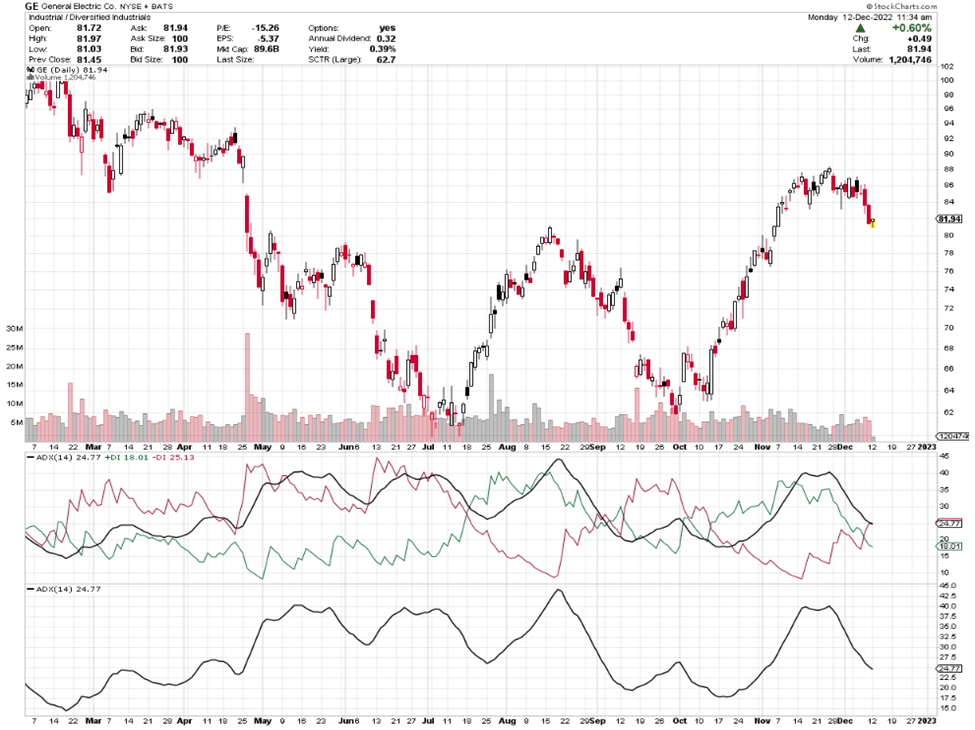
I will post another time frame chart for General Electric (GE), so you can start interpreting this information.
Stockcharts.com
This chart for GE is a daily chart, where each candle represents price movement for one day, where AMZN was a 30-minute chart and each candle showed 30-minute price moves.
You will notice on the chart above that price rose through the month of October and into November. The strength line (black) rose, and the green (+DI) line was on top.
As you study the charts, start to notice the DI line cross overs and when the ADX line starts to head up. These lines are sharing information with you.
I hope you find this information useful.
Friday is education day. My goal is to teach everyday people (like me) to successfully trade options. I do my best to write in an understandable way as if we are talking while sitting on the deck of my house in a relaxed atmosphere.
The trading tools you select, and use are important, and can make your trading easier and more effective.
You may be mesmerized by professional traders, their trophies, and daunting achievements that you aspire to achieve, and it is easy to forget that those achievers, more often than not, started with far less than they have now. Perhaps, less than you have. You are poised to achieve all that you desire!
Have a great weekend.
And I wish you the very best,
Wendy

See Related Articles on TradeWinsDaily.com
Confirm Price Direction And Reveal Trades
An Example Of What To Beware Of
Chart of the Day: Amazon (AMZN)
Hyatt Hotels Make New 52-Week High
ACGL Shares Signal Strong ‘Buy’
© 2022 Tradewins Publishing. All rights reserved. | Privacy Policy | Terms and Conditions | Contact Us
The information provided by the newsletters, trading, training and educational products related to various markets (collectively referred to as the "Services") is not customized or personalized to any particular risk profile or tolerance. Nor is the information published by Wendy Kirkland a customized or personalized recommendation to buy, sell, hold, or invest in particular financial products. Past performance is not necessarily indicative of future results. Trading and investing involve substantial risk and is not appropriate for everyone. The actual profit results presented here may vary with the actual profit results presented in other Wendy Kirkland publications due to the different strategies and time frames presented in other publications. Trading on margin carries a high level of risk, and may not be suitable for all investors. Other than the refund policy detailed elsewhere, Wendy Kirkland does not make any guarantee or other promise as to any results that may be obtained from using the Services. Wendy Kirkland disclaims any and all liability for any investment or trading loss sustained by a subscriber. You should trade or invest only "risk capital" - money you can afford to lose. Trading stocks and stock options involves high risk and you can lose the entire principal amount invested or more. There is no guarantee that systems, indicators, or trading signals will result in profits or that they will not produce losses.
Some profit examples are based on hypothetical or simulated trading. This means the trades are not actual trades and instead are hypothetical trades based on real market prices at the time the recommendation is disseminated. No actual money is invested, nor are any trades executed. Hypothetical or simulated performance is not necessarily indicative of future results. Hypothetical performance results have many inherent limitations, some of which are described below. Also, the hypothetical results do not include the costs of subscriptions, commissions, or other fees. Because the trades underlying these examples have not actually been executed, the results may understate or overstate the impact of certain market factors, such as lack of liquidity. Wendy Kirkland makes no representations or warranties that any account will or is likely to achieve profits similar to those shown. No representation is being made that you will achieve profits or the same results as any person providing a testimonial. Testimonials relate to various other products offered by Wendy Kirkland and not the product offered here, but all of these products are based on Wendy Kirkland's system. Performance results of other products described in such testimonials may be materially different from results for the product being offered and may have been achieved before the product being offered was developed.
Results described in testimonials from other products or the product being offered may not be typical or representative of results achieved by other users of such products. No representation is being made that any of the persons who provide testimonials have continued to experience the same level of profitable trading after the date on which the testimonial was provided. In fact, such persons may have experienced losses immediately thereafter or may have experienced losses preceding the period of time referenced in the testimonial. No representation is being made that you will achieve profits or the same results as any person providing a testimonial. Wendy Kirkland's experiences are not typical. Wendy Kirkland is an experienced investor and your results will vary depending on risk tolerance, amount of risk capital utilized, size of trading position, willingness to follow the rules and other factors.
|


No comments:
Post a Comment