| EUR/USD: plan for the European session on December 23. COT reports. Pressure on euro returns. Bears will fight for 1.2169 support 2020-12-23 To open long positions on EUR/USD, you need: Quite a lot of deals for entering the market appeared yesterday. Let's deal with them. In the first half of the day, you can see how the bears went below the 1.2226 level and settled below this range, testing it from the bottom up several times. This led to creating a clear signal to sell the euro. Moving from the 1.2226 level was around 20 points, afterwards buyers took control of this level, and tested it from top to bottom, which led to a buy signal. The upward movement was around 30 points. Unfortunately, I did not enter short positions during the US session after surpassing 1.2226, since this level was not tested similar to the morning sale. However, by the end of the day, there was a good signal to open short positions after settling below 1.2181 and this level was also tested from the bottom up. I selected all entry points on the chart. 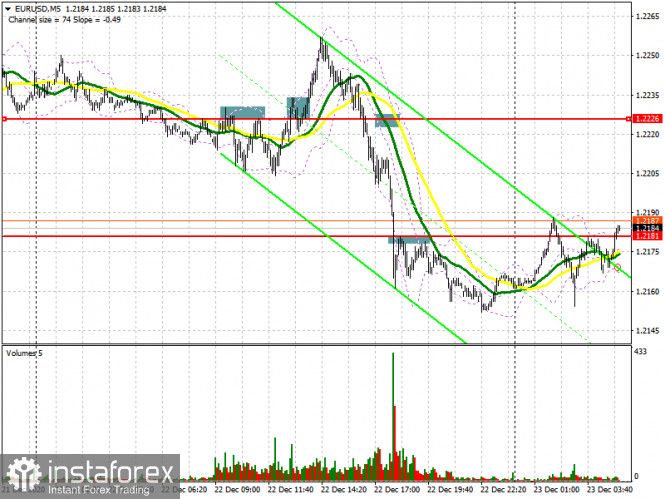
The picture has slightly changed at the moment. Buyers are now focused on protecting support at 1.2169. Forming a false breakout there in the first half of the day will lead to creating a signal to open long positions in the euro. However, given the absence of important fundamental statistics, and since the report on the German import price index is unlikely to shake the market, buyers are probably not in a hurry to take an active part. If bulls are not active and EUR/USD returns to the area under the support of 1.2169, I recommend postponing long positions until the week's low has been updated in the 1.2130 area. It is also possible to buy the euro immediately on a rebound from a new local low in the 1.2083 area, counting on a correction of 20-25 points within the day. It will be possible to say that buyers of the euro managed to regain control of the market only when the pair manages to settle above the resistance of 1.2209, where the moving averages are, playing on the side of sellers. Testing 1.2209 from top to bottom creates an additional signal to buy the euro with the main goal of returning resistance at 1.2242, where I recommend taking profits. To open short positions on EUR/USD, you need: Sellers of the euro hope to regain control over the 1.2169 level. Getting the pair to settle below this range and testing it from the other side will increase the pressure on the pair, which creates a good entry point for short positions. In this case, the main target will be this week's low at 1.2130. You can expect a breakthrough in this area if we receive news of infections with a new strain of coronavirus in Germany or France. In this case, it is possible to fall further towards the 1.2083 area, and the main target at the end of the week will be the 1.2042 area, where I recommend taking profits. If the bulls manage to defend support at 1.2169, you can expect the pair to slightly advance to a 1.2209 high. However, I recommend opening short positions from there only when a false breakout has been formed. It is best to count on selling on a rebound only after levels 1.2242 and 1.2271 have been tested, counting on a downward correction of 20-25 points within the day. 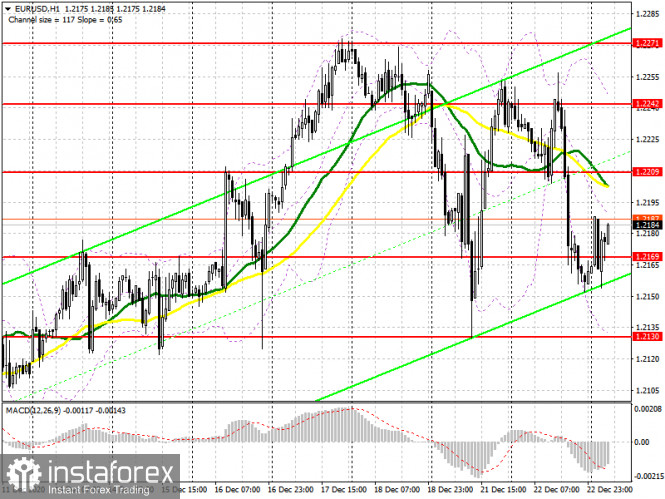
The Commitment of Traders (COT) report for December 15 showed an increase in short positions and a reduction in long ones. Although buyers of risky assets believe that the bull market will proceed, especially amid expectations of vaccinations in the eurozone, which will begin from December 25 to 27, however, the rush to buy at current highs has obviously decreased. Thus, long non-commercial positions fell from 222,521 to 218,710, while short non-commercial positions increased from 66,092 to 76,877. The total non-commercial net position fell from 156,429 to 141,833 a week earlier. The growth of the delta, which was observed for three consecutive weeks, has stopped, so one can hardly count on the euro's rapid growth at the end of this year. There will be no further major recovery until European leaders negotiate a new trade agreement with Britain. Indicator signals: Moving averages Trading is carried out just below 30 and 50 moving averages, which indicates the euro sellers' attempt to bring back the downward trend. Note: The period and prices of moving averages are considered by the author on the H1 hourly chart and differs from the general definition of the classic daily moving averages on the D1 daily chart. Bollinger Bands A breakout of the average border of the indicator in the 1.2189 area will lead to a new upward movement for the euro. The euro's decline will be limited by the lower level of the indicator around 1.2130. Description of indicators - Moving average (moving average, determines the current trend by smoothing out volatility and noise). Period 50. It is marked in yellow on the chart.
- Moving average (moving average, determines the current trend by smoothing out volatility and noise). Period 30. It is marked in green on the chart.
- MACD indicator (Moving Average Convergence/Divergence — convergence/divergence of moving averages) Quick EMA period 12. Slow EMA period to 26. SMA period 9
- Bollinger Bands (Bollinger Bands). Period 20
- Non-commercial speculative traders, such as individual traders, hedge funds, and large institutions that use the futures market for speculative purposes and meet certain requirements.
- Long non-commercial positions represent the total long open position of non-commercial traders.
- Short non-commercial positions represent the total short open position of non-commercial traders.
- Total non-commercial net position is the difference between short and long positions of non-commercial traders.
GBP/USD: plan for the European session on December 23. COT reports. Bears actively defend themselves, trying to build a new downward trend 2020-12-23 To open long positions on GBP/USD, you need: Yesterday, a lot of good signals appeared, both to buy and sell the British pound. Let's take a look at the chart and break down all the entry points. You can clearly see how the buyers tried to gain a foothold above the resistance of 1.3434 in the first half of the day, but nothing happened. The data on the UK GDP for the third quarter contributed to the pound's growth, however, the pair did not surpass 1.3434, which resulted in creating a sell signal. Testing the 1.3434 level from the bottom up caused the pound to fall by 70 points, and so it reached the support area of 1.3362. I advised you to open long positions there, which caused GBP/USD to return to a resistance of 1.3434. In my afternoon forecast, I advised you to act in exactly the same way as you did during the European session. As a result, another false breakout at 1.3434 and a sell signal, which pushes the pound to the support of 1.3359, afterwards a breakout. Getting the pair to settle below and updating the 1.3359 level, similar to morning sales, creates another entry point for short positions, afterwards the pound fell by another 50 points. 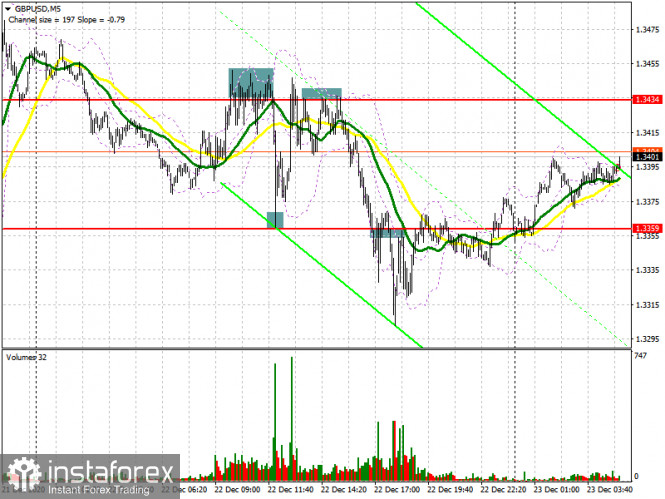
Despite the extremely high volatility from yesterday, buyers must still maintain control over the 1.3367 level. Forming a false breakout there will be a signal to open long positions in hopes for GBP/USD to recover in the short term towards the resistance of 1.3445. The main goal is to settle above this range. Testing this level from top to bottom creates an additional entry point into long positions in order to reach a high of 1.3525, where I recommend taking profits. The succeeding target will still be resistances at 1.3617 and 1.3690, but they will be available only if we receive good news on the Brexit agreement. In case bulls are not active in the support area of 1.3367, as it was yesterday afternoon, when buyers failed to defend the 1.3367 level after testing it for the second time, then it is best not to rush to buy, but wait until the 1.3290 low has been updated. However, I recommend opening long positions from this level only after forming a false breakout. A larger support area is seen around 1.3193, where you can buy GBP/USD immediately on a rebound, counting on a correction of 35-40 points. To open short positions on GBP/USD, you need: Bears have nothing to focus on this morning, so trading will be backed by rumors and talk around a trade deal that has no news yet. Forming a false breakout in the resistance area of 1.3445, similar to yesterday's sales, will return pressure to the pair and result in the pound's decline and a test of support at 1.3367, on which a lot depends at the moment. Surpassing this level and testing it from the bottom up creates a good signal to open short positions to sustain the downward trend in order for it to reach lows of 1.3290 and 1.3193, where we observed a strong demand at the beginning of the week. Only bad news on the trade agreement can plunge GBP/USD to a low of 1.3114. If the bulls manage to defend the 1.3367 level and surpass 1.3445. I recommend opening short positions immediately on a rebound from the high of 1.3525, counting on a downward correction of 30-35 points within the day. 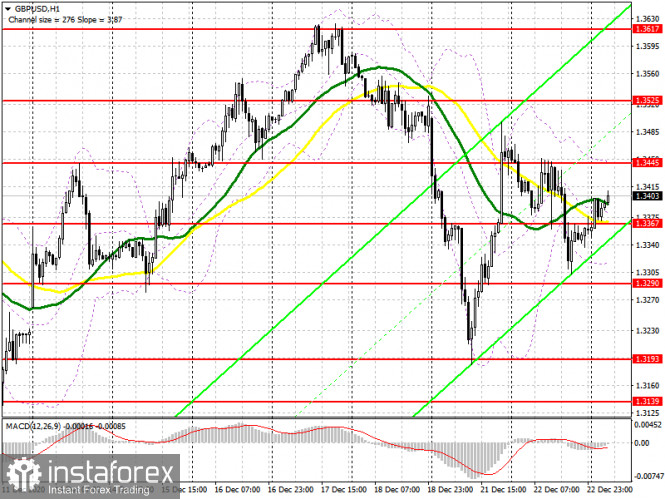
The Commitment of Traders (COT) reports for December 15, there is a decrease in interest in the British pound for both buyers and sellers. Long non-commercial positions decreased from 39,344 to 35,128. At the same time, short non-commercial positions decreased from 33,634 to 31,060. As a result, the non-commercial net position, although it remained positive, dropped to 4,068, against 5,710 versus a week earlier. All this suggests that traders are taking a wait-and-see attitude, although a small preponderance of buyers, even in the current situation, continues to be observed. Given that the UK has imposed tough quarantine measures due to a new strain of coronavirus that has gotten out of control and for which there is no vaccine yet, then expecting the pound to strengthen further at the end of this year will not be the right decision. Only good news on Brexit can bring new players back into the market, betting on GBP/USD growth. Indicator signals: Moving averages Trading is carried out in the area of 30 and 50 moving averages, which indicates some confusion in the market regarding the pair's succeeding direction. Note: The period and prices of moving averages are considered by the author on the H1 hourly chart and differs from the general definition of the classic daily moving averages on the D1 daily chart. Bollinger Bands If the pound rises, the upper border of the indicator at 1.3445 will act as a resistance. A breakout of the average border of the indicator in the 1.3367 area will increase the pressure on the pair. Description of indicators - Moving average (moving average, determines the current trend by smoothing out volatility and noise). Period 50. It is marked in yellow on the chart.
- Moving average (moving average, determines the current trend by smoothing out volatility and noise). Period 30. It is marked in green on the chart.
- MACD indicator (Moving Average Convergence/Divergence — convergence/divergence of moving averages) Quick EMA period 12. Slow EMA period to 26. SMA period 9
- Bollinger Bands (Bollinger Bands). Period 20
- Non-commercial speculative traders, such as individual traders, hedge funds, and large institutions that use the futures market for speculative purposes and meet certain requirements.
- Long non-commercial positions represent the total long open position of non-commercial traders.
- Short non-commercial positions represent the total short open position of non-commercial traders.
- Total non-commercial net position is the difference between short and long positions of non-commercial traders.
Indicator analysis. Daily review for the EUR/USD currency pair 12/23/20 2020-12-23 Trend analysis (figure 1). Today, the market will try to continue going up from the level of 1.2161 (closing of yesterday's daily candle) to reach the historical resistance level of 1.2234 (blue dotted line). After reaching this level, it will further go up with the target of 1.2277 at the pullback level of 85.4% (yellow dotted line). 
Figure 1 (daily chart). Comprehensive Analysis: General Conclusion: Today, the price may continue to go up to reach the historical resistance level of 1.2234 (blue dotted line). After reaching this level, it will further go up with the target of 1.2277 at the pullback level of 85.4% (yellow dotted line). Alternative scenario: when going up and reaching the historical resistance level of 1.2234 (blue dotted line), the price may start going down to the support level of 1.2177 (blue bold line). Indicator analysis. Daily review for the GBP/USD currency pair on 23/12/2020 2020-12-23 Trend analysis (figure 1). Today, from the level of 1.3357 (the closing of yesterday's daily candle), the market will try to continue moving up to reach the historical resistance level at 1.3481 (blue dotted line). If this level is tested, continue to work up with the target of 1.3563 which is the resistance line (red bold line).  Figure 1 (daily chart). Comprehensive Analysis: - Indicator Analysis – up
- Fibonacci Levels – up
- Volumes – up
- Candle Analysis – up
- Trend Analysis – up
- Bollinger Bands – up
- Weekly Chart – up
General Conclusion: Today, from the level of 1.3357 (the closing of yesterday's daily candle), the market will try to continue moving up with the target of the historical resistance level at 1.3481 (blue dotted line). If this level is tested, continue to work up with the target of 1.3563 which is the resistance line (red bold line). Alternative Scenario: From the level of 1.3455 (the closing of yesterday's daily candle), the market will try to continue its upward movement in order to reach the historical resistance level at 1.3481 (blue dotted line). In the case of testing this level, work downwards with the target of 1.3382– 21 average EMA (black thin line). GBP/USD. December 23. COT report. Michel Barnier to brief the ambassadors of all 27 EU countries today at 15:00 GMT 2020-12-23 GBP/USD - 1H. 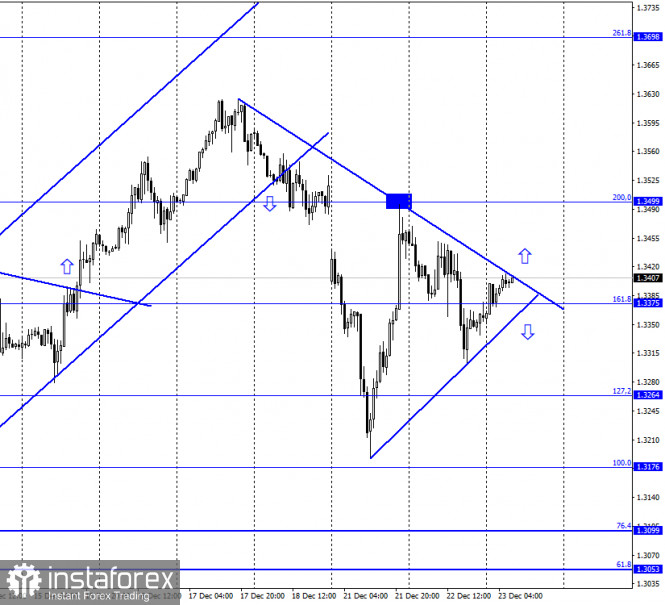
According to the hourly chart, the GBP/USD pair fell less strongly yesterday than the day before, after which a new growth process began. Now there are two trend lines on the chart - one ascending and the other descending. Thus, the quotes of the pair are between these two lines. However, to determine in which direction traders intend to move the pair, it is necessary to fix above or below one of the lines. In the first case, traders can count on growth in the direction of the corrective level of 200.0% (1.3499). In the second - for a fall in the direction of the corrective level of 127.2% (1.3264). Although almost every day there are new messages on Brexit-related issues, it is still very difficult to understand at what stage the negotiations between Michel Barnier and David Frost are, and also what are the chances of an agreement being concluded before December 31. Today, the chief negotiator from the EU, Michel Barnier, is to submit a report to the ambassadors of all 27 countries to the EU, in which he sets out the current state of the negotiations. Thus, traders can get very important information today. The latest information said that London and Brussels were already discussing only one issue - the issue of fishing. Does this mean that all other issues (fair competition, government support, dispute resolution, compliance with EU norms and rules) have already been resolved? Or is it not? A little more than a week remains at the negotiators' disposal to resolve all differences and ratify the deal. Honestly, it's hard to believe, but perhaps today Michel Barnier will be optimistic in his speech and will announce significant progress? GBP/USD - 4H. 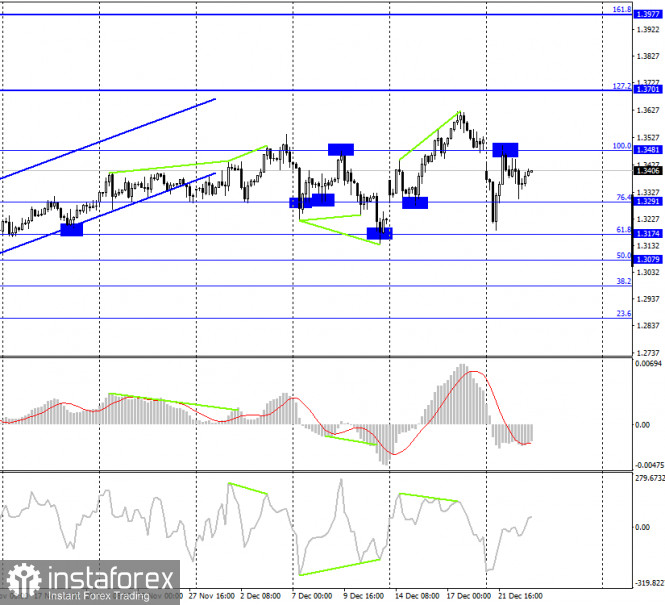
On the 4-hour chart, the GBP/USD pair rebounded from the Fibo level of 100.0% (1.3481) and reversed in favor of the American currency. As a result, the decline in quotes continues towards the corrective level of 76.4% (1.3291). None of the indicators have any emerging divergences. Fixing the pair above the level of 100.0% will work in favor of the EU currency and resumed growth in the direction of the corrective level of 127.2% (1.3701). GBP/USD - Daily. 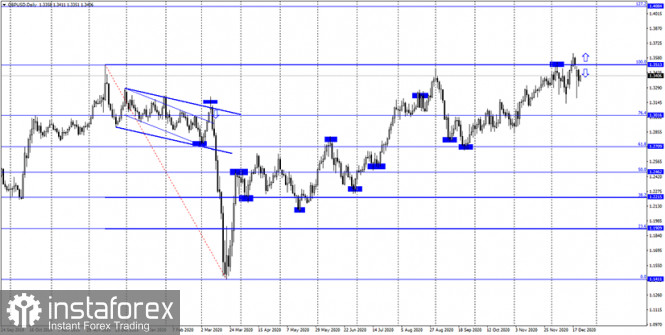
On the daily chart, the quotes of the pair fixed below the corrective level of 100.0% (1.3513), which now increases the likelihood of a new fall with a target of the Fib level of 76.4% (1.3016). GBP/USD - Weekly. 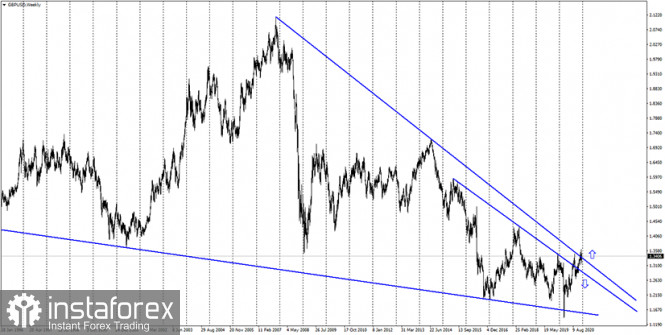
On the weekly chart, the pound/dollar pair has completed the rally towards the second downward trend line. A rebound from it in the long term will mean a reversal in favor of the US dollar and a prolonged drop in British quotes. Overview of fundamentals: On Tuesday, the UK and the US released third-quarter GDP reports and each exceeded traders' expectations. British accounted for + 16.0% q/q, American + 33.4% q/q. Thus, the British and the Americans were alternately receiving little support from traders. News calendar for USA and UK: US - changes in the volume of orders for durable goods (13:30 GMT). US - number of initial and repeated claims for unemployment benefits (13:30 GMT). On December 23, the calendar of economic events in the UK is empty, and in America, there will be a lot of reports, but the most important of them are those presented above. COT (Commitments of Traders) report: 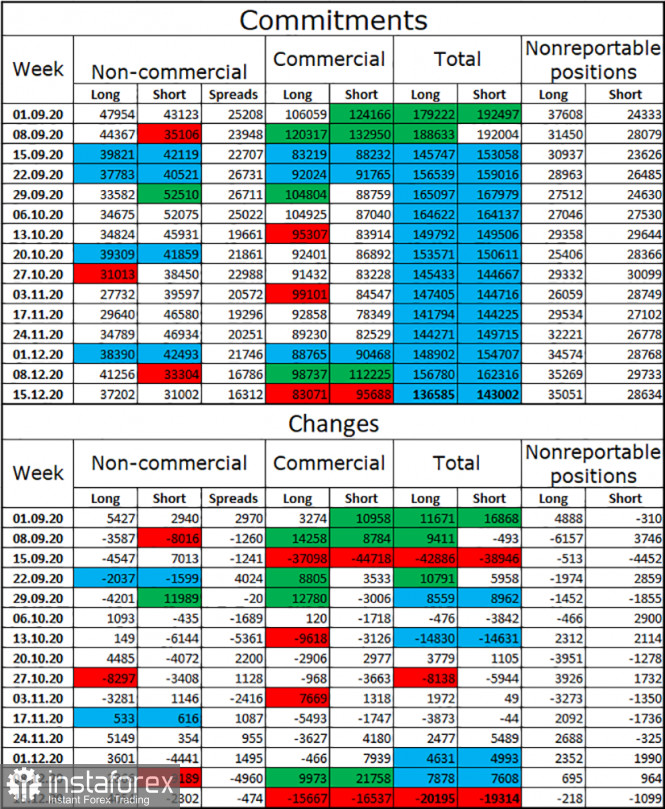
The latest COT report showed that speculators were getting rid of both long and short contracts. This again suggests that traders are afraid of the Briton and the information background that exists now. It is extremely difficult to predict what will happen to the UK economy in 2021. Therefore, the category of traders "Non-commercial" prefers to close deals rather than open new ones. This time, speculators have closed 4 thousand long contracts and 2.5 thousand short contracts. Thus, the mood of speculators has become much less bullish. At the same time, the Briton continued the growth process, thus, I can draw the same conclusion as for the euro currency. Major traders are preparing for a new fall in the pound sterling. Forecast for GBP/USD and recommendations for traders: I recommend buying the British when the quotes are fixed above the downward trend line on the hourly chart with the target of 1.3499. I recommend selling the pound sterling when it consolidates below the upward trend line on the hourly chart with the target of 1.3264. Terms: "Non-commercial" - major market players: banks, hedge funds, investment funds, private, large investors. "Commercial" - commercial enterprises, firms, banks, corporations, companies that buy currency not to obtain speculative profits, but to support current activities or export-import operations. "Non-reportable positions" - small traders who do not have a significant impact on the price. EUR/USD. December 23. COT report. Bear traders are still very weak. 2020-12-23 EUR/USD - 1H. 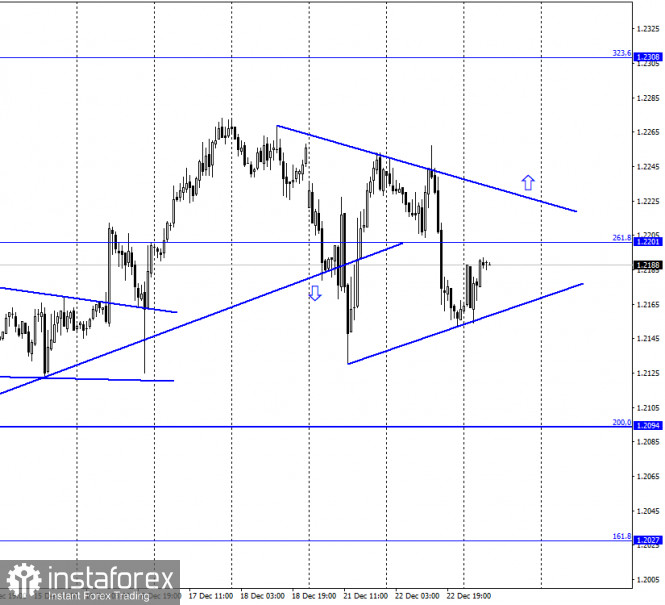
On December 22, the EUR/USD pair performed a new fall, however, it was less strong than the day before. However, this fall allowed the formation of a new upward trend line, which now works in pair with the downward one and forms a narrowing triangle with it. Just a few hours ago, the pair's quotes performed a rebound from the lower line, so now I am counting on the process of growth to the upper trend line, that is, to the level of 1.2220. Fixing the pair's rate under the upward trend line will increase the probability of further decline and over the downward trend line - the probability of further growth. Meanwhile, the information background at this time is very strange. At the very least, it is extremely difficult to write it down in the asset of a particular currency. At the beginning of the week, the US dollar rose significantly on news of a new strain of coronavirus in the UK, but on the same day, traders calmed down and took into account the fact that this is not the first new strain. A little later, the companies involved in the production of the vaccine against COVID-2019 said that their drugs are likely to cope with the new strain, and if not, the process of creating a new vaccine based on the existing one will not take much time. Thus, the panic associated with the new wave of the epidemic was somewhat premature. After that, the US currency received support from the report on GDP for the third quarter in the US, which unexpectedly turned out to be even higher than previously predicted. But at the same time, I can't tell everyone that the upward trend is over, and the US dollar will finally begin to show growth. EUR/USD - 4H. 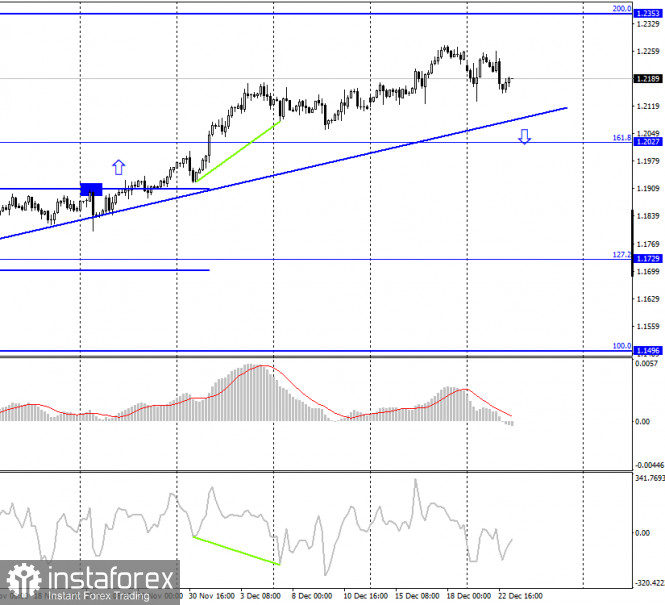
On the 4-hour chart, the pair's quotes performed a reversal in favor of the European currency, but in general, they are trading between the corrective level of 200.0% (1.2353) and the upward trend line, which keeps the current mood of traders "bullish". Thus, on this chart, it is not even possible to conclude the end of the upward trend. I believe that it is better now to pay more attention to the hourly schedule, where you can track changes more quickly. EUR/USD - Daily. 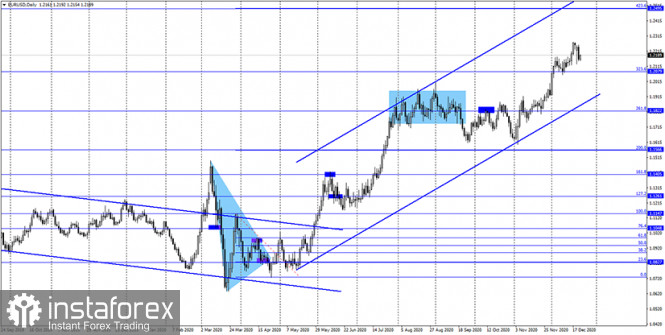
On the daily chart, the quotes of the EUR/USD pair continue the process of growth in the direction of the corrective level of 423.6% (1.2495). Until the moment when the pair performs consolidation under the level of 323.6%, there are still high chances of growth. EUR/USD-Weekly. 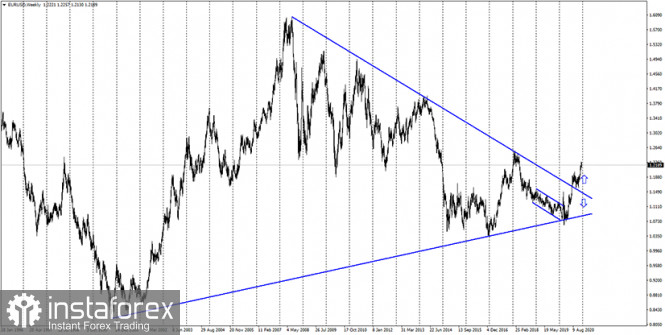
On the weekly chart, the EUR/USD pair performed a consolidation above the "narrowing triangle", which preserves the prospects for further growth of the pair in the long term. Overview of fundamentals: On December 22, the US released a report on GDP for the third quarter, which showed an increase of 33.4% compared to the second quarter and with lower expectations of traders. But the consumer confidence indicator was very low – 88.6, traders expected at least 97.1. News calendar for the United States and the European Union: US - change in the volume of orders for long-term goods (13:30 GMT). US - number of initial and repeated applications for unemployment benefits (13:30 GMT). On December 23, reports on orders for durable goods and applications for unemployment benefits will be released in America. The information background will be present on this day. COT (Commitments of Traders) report: 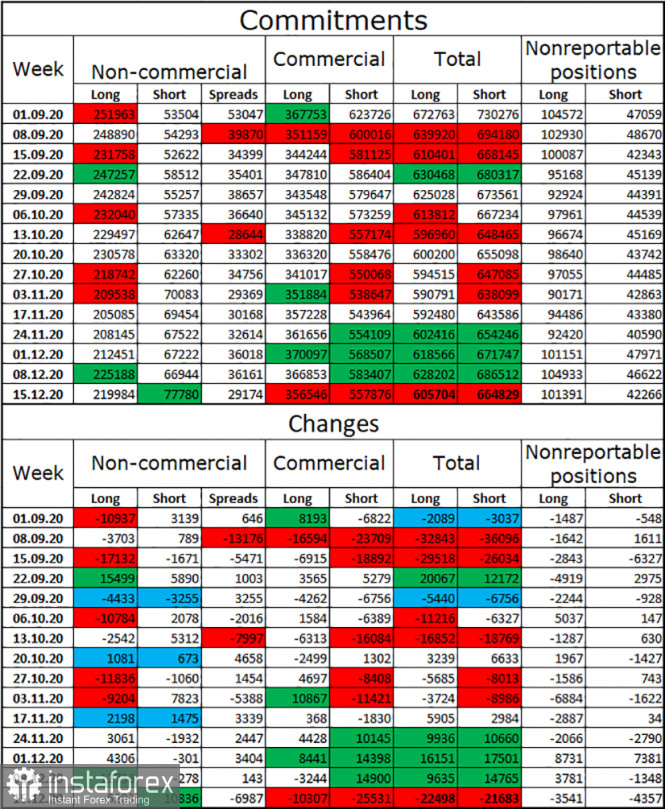
For four weeks in a row, the mood of the "Non-commercial" category of traders became more "bullish". This was stated by COT reports and it coincided with what was happening on the euro/dollar pair. However, in the reporting week, speculators opened as many as 11 thousand new short-contracts, and also closed 5,200 long-contracts. Thus, they significantly weakened their bullish mood. And despite this, the euro continues to show growth. However, a sharp change in the mood of the "Non-commercial" category of traders does not mean that the euro currency should immediately fall. The latest COT report shows that speculators are once again preparing for a fall in the euro currency, or at least for the end of its growth. EUR/USD forecast and recommendations for traders: Today, I recommend selling the euro currency with the nearest goals, if the rebound from the level of 261.8% (1.2201), from the upper trend line or fixing under the lower trend line is performed. New purchases of the pair can be opened with a target of 1.2308 when the quotes are fixed above the descending trend line on the hourly chart. Term: "Non-commercial" - major market players: banks, hedge funds, investment funds, private, large investors. "Commercial" - commercial enterprises, firms, banks, corporations, companies that buy currency, not for speculative profit, but to ensure current activities or export-import operations. "Non-reportable positions" - small traders who do not have a significant impact on the price. Technical Analysis of EUR/USD for December 23, 2020 2020-12-23 Technical Market Outlook: The EUR/USD pair might be making a Broadening Wedge price pattern, which is considering to be a bearish chart pattern. The short-term demand zone located between the levels of 1.2154 - 1.2177 has been violated and will no longer be effective, so currently the next technical support is seen at the level of 1.2088. Please notice, the market is coming off the overbought conditions and the momentum is already below the neutral level of fifty, so the deeper pull-back might develop soon. Weekly Pivot Points: WR3 - 1.2470 WR2 - 1.2364 WR1 - 1.2314 Weekly Pivot - 1.2216 WS1 - 1.2157 WS2 - 1.2054 WS3 - 1.2003 Trading Recommendations: Since the middle of March 2020 the main trend is on EUR/USD pair has been up. This means any local corrections should be used to buy the dips until the key technical support is broken. The key long-term technical support is seen at the level of 1.1609. The key long-term technical resistance is seen at the level of 1.2555. 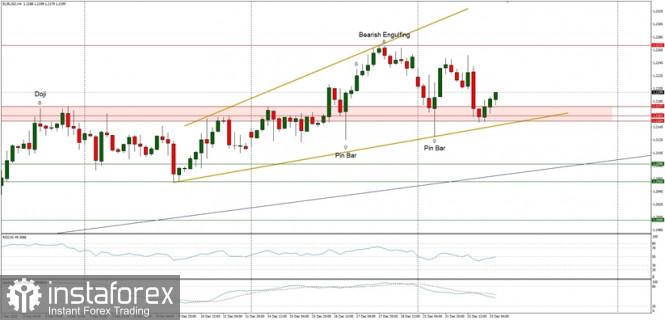
Technical Analysis of GBP/USD for December 23, 2020 2020-12-23 Technical Market Outlook: The GBP/USD pair has retraced more than 61% of the last wave down, but reversed anyway as the bearish pressure is clear. Currently the market is trading in a narrow range located between the levels of 1.3306 - 1.3442 as the momentum indicator turns flat at the level of fifty (neutral momentum level). The next technical support is located at the level of 1.3264 and 1.3240. Please notice, that if the level of 1.3240 is violated, the price will be close to the main trend line support located around the level of 1.3175. The key technical support is still seen between the levels of 1.3165 - 1.3121. Weekly Pivot Points: WR3 - 1.3982 WR2 - 1.3787 WR1 - 1.3662 Weekly Pivot - 1.3457 WS1 - 1.3286 WS2 - 1.3107 WS3 - 1.2936 Trading Recommendations: The GBP/USD pair might have started a long term up trend and the trigger for this trend was the breakout above the level or 1.3518 on the weekly time frame chart. All the local corrections should be used to enter a buy orders as long as the level of 1.2674 is not broken. The long-term target for bulls is seen at the level of 1.4370. 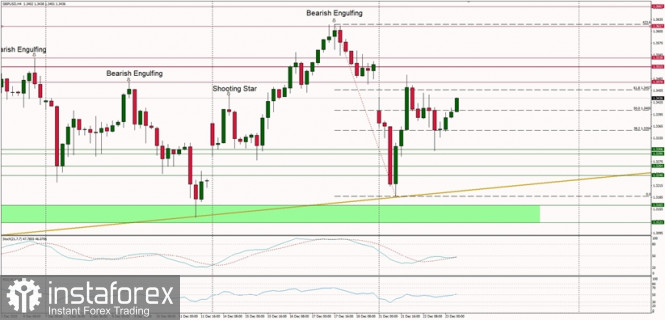
Gold will reach new peaks in 2021 2020-12-23 
Short-term and medium-term forecasts for gold's price are most often positive. Analysts of the investment Bank, ABN AMRO, hold a similar point of view. Experts have improved the previous forecast for the gold, but warned market participants about some risks. Analysts at ABN Amro are sure that gold will be trading at $ 2,000 per ounce by the end of 2021. The main factors supporting the precious metal are low real interest rates in the US and a weakening US dollar. Experts predict low yields on US government bonds and recommend that investors should monitor changes in the monetary policy of regulators and the growing budget deficit. However, they warn about three major risks for the gold market: changes in investors' strategy in precious metals, a possible collapse in the technical picture and global economic problems. With regard to the first point, there is a risk that investors will begin to get rid of investments in the securities of ETF funds. It should be noted that experts have recorded a small outflow of funds from the indicated funds over the past few weeks. If this trend worsens, the price of gold will be under strong pressure. ABN Amro's analysts are relatively calm about the technical outlook for the yellow metal, but some changes in its dynamics are worrying. The bank emphasized that it started to decline by the end of this year. If gold's price is below the average (over the past 200 days), ABN Amro warns that a further upward trend will be unlikely. Many strategists of the precious metals market are concerned about the global economic situation amid the COVID-19 pandemic. Experts fear that negative trends will continue next year. If this scenario is implemented, the gold market may undergo correction and clearly decline. However, analysts' forecasts for the gold are mostly optimistic, so the third risk factor identified by ABN Amro is not yet a serious concern. Currently, experts consider the most attractive for investment metals, which are actively used in industry. These include platinum (40% of the demand for it comes from the auto industry), as well as silver, copper and aluminum. They are particularly enthusiastic about white metal. Experts agree that silver has a huge growth potential. OII cites the period from 2010 to 2011 as an example, when silver's price soared from $17 to $50, that is, almost three times. Experts believe that with such growth rates, silver has a great future and assume that the price ratio for Gold and Silver can be 1: 55 in a few years. By the end of this year, yellow and white metals managed to recover from the collapse to their lows recorded at the end of November. According to analysts, the new wave of the upward trend, which began in mid-December 2020, will continue until spring 2021. Today, the price of gold slightly rose within the current correction, moving around $ 1864 per ounce. The weakening US dollar contributed to this. 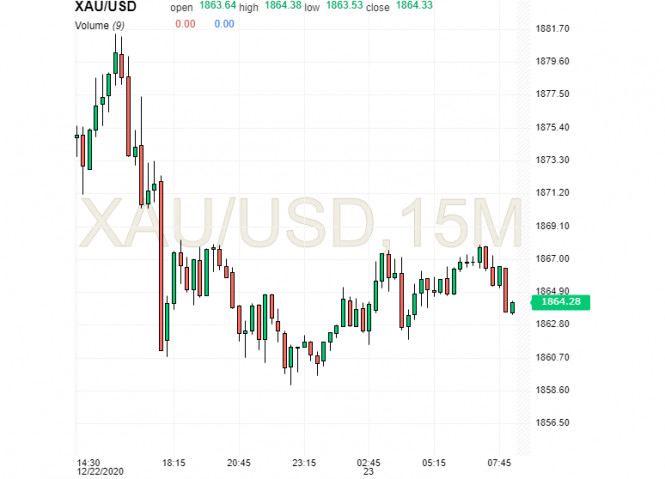
ABN Amro analysts believe that like silver, gold will sharply move to new peaks in the coming year. According to the basic scenario, gold's value will be $ 1950 per ounce in 2021, and will likely rise to $ 2050 in 2022. A more optimistic scenario assumes a rise to $ 2200 - $ 2400 per ounce. They summarized that the soft monetary policy from central banks will support this. EUR/USD and GBP/USD: EU rejected UK's proposal on fisheries. Meanwhile, Donald Trump did not sign the $900 billion bailout bill. 2020-12-23 Demand for risky assets dropped sharply on Tuesday amid fears of rising COVID-19 incidence and the discovery of a new strain of coronavirus in the UK. Many EU countries have tightened their quarantine measures and closed their borders in response to this, in particular, transport links with the UK are now limited. At the same time, UK itself is in strict quarantine restrictions, which has led to the paralysis of a number of companies. If this new strain is also detected in other countries, authorities may follow the measures of UK, which will hinder the recovery of the global economy.  At the moment, it is not clear whether the current COVID-19 vaccines are effective against the new strain. Yesterday, BioNTech said that in two weeks, after all the research has passed, they will be able to conclude if their vaccine is capable of withstanding the new strain. But aside from that, they can also develop a new vaccine that will protect against the next strains. These statements, although not much, reassured investors and led to the strengthening of the euro and pound this morning. But in the EUR / USD chart, it is clear that the euro is one step away from having a new wave of decline, in which the breakout of 1.2160 will most likely lead to a sharp drop towards 1.2080 and 1.2040. But if the euro bulls managed to consolidate the quote above 1.2210, the EUR / USD pair may move towards 1.2275 instead. With regards to the highly-anticipated $ 900 billion bailout bill in the US, it failed to be enacted yesterday, as US President Donald Trump did not sign it. Instead, Trump called on the Senators to increase direct benefits to $ 2,000, and said the $ 600 that the Congress has approved is absurdly small. According to him, the payment needs to be increased to $ 2,000 per person, or $ 4,000 per couple. Legislators were clearly not prepared for this, which led to the strengthening of the US dollar against the euro and the British pound.  GBP: The British pound declined on news that the European Union has rejected the UK's latest proposal on fishing rights. This dealt a blow to all the efforts the negotiators made in order to conclude a trade deal. This week, UK Prime Minister Boris Johnson spoke with European Commission President Ursula von der Leyen twice in an attempt to break the existing deadlock in the negotiations. The UK put forward a proposal that the production volume of EU vessels (in UK fishing waters) should be reduced to 30%, which is significantly less than the 60% that the UK initially insisted. However, the bloc still refused to accept the cut. And since Brexit is only days away from occurring, many have given up hope that a deal will be signed. At the moment, the GBP / USD pair is still afloat, and the euro bears are attempting to bring the quote below 1.3350, as such will lead to a further decline towards 1.3240. The further targets of the bears are 1.2190 and 1.2135. But if the pound returns to 1.3445, the quote may be able to rise to 1.3525 and 1.3620. In another note, the third quarter US GDP report has been revised upward, which is a good signal for the US economy, but is unlikely to help in the future. According to the data published by the US Department of Commerce, GDP in the 3rd quarter grew by 33.4% per annum against the previous estimate of 33.1%. The growth was due to an increase in consumer spending and capital investment of companies 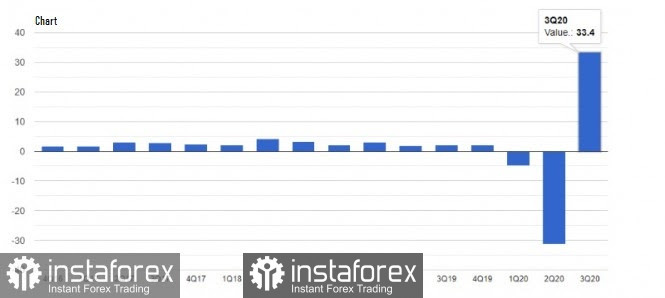 Meanwhile, consumer confidence in the US deteriorated sharply this December, as reported by the Conference Board. The persistent rise of COVID-19 cases, plus the tightening of quarantine restrictions, greatly affected the indicator. As a result, the index plummeted to 88.6 points in December, from its 92.9 points in November. Economists had expected the index to increase to 97.5 points. Consumers do not expect the economy to pick up in early 2021, therefore, the index will remain at fairly low levels in January. 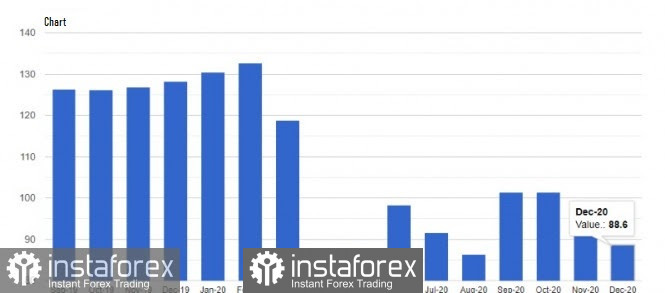 Data on US home sales are also down, and this is clearly seen from the figures published by the National Association of Realtors. The report indicates that sales in the secondary housing market fell by 2.5% in November, and fills to 6.69 million homes per year. If compared to the same period of the previous year, sales increased by 25.8%. Meanwhile, the median home price in the secondary market rose to 14.6% and to $ 310,800. Today, a report on sales in the primary housing market will be published, where record low interest rates may lead to another increase in the indicator. As for economic activity, the Richmond Fed said its Manufacturing PMI rose to 19 points in December, up from its 15 points in November. Elliott wave analysis of AUD/USD for December 23, 2020 2020-12-23 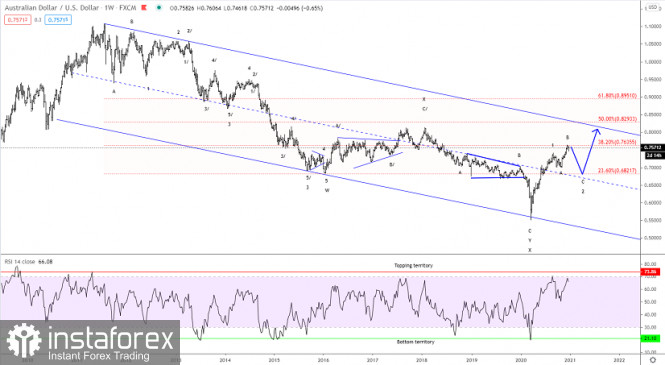
The Aussie dollar has rallied nicely from the March 2020 low at 0.5506 and completed a five wave rally at 0.7414. After the wave 1 peak, we have seen wave A and B of an expanded flat correction and wave C has likely begun or will begin very soon for a decline towards 0.6822. Short-term a break below 0.7458 will confirm that wave C is unfolding for the final decline in wave 2. If a final spike is made in wave B it could be close to of just above 0.7640 before tuning lower in wave C towards 0.6822. Trading recommendation: If you are long Sell near 0.7640 or use a protective stop+revers at 0.7458 for a decline to 0.6822
Author's today's articles: Maxim Magdalinin  In 2005 graduated from the Academy of the Ministry of Internal Affairs of the Republic of Belarus, law faculty. Worked as a lawyer for three years in one of the biggest country's company. Besides the trading, he develops trading systems, writes articles and analytical reviews. Works at stock and commodity markets explorations. On Forex since 2006. In 2005 graduated from the Academy of the Ministry of Internal Affairs of the Republic of Belarus, law faculty. Worked as a lawyer for three years in one of the biggest country's company. Besides the trading, he develops trading systems, writes articles and analytical reviews. Works at stock and commodity markets explorations. On Forex since 2006. Sergey Belyaev  Born December 1, 1955. In 1993 graduated from Air Force Engineering Academy. In September 1999 started to study Forex markets. Since 2002 has been reading lectures on the technical analysis . Is fond of research work. Created a personal trading system based on the indicator analysis. Authored the book on technical analysis "Calculation of the next candlestick". At present the next book is being prepared for publishing "Indicator Analysis of Forex Market. Trading System Encyclopedia". Has created eleven courses on indicator analysis. Uses classical indicators. Works as a public lecturer. Held numerous seminars and workshops presented at international exhibitions of financial markets industry. Is known as one of the best specialists in the Russian Federation researching indicator analysis. Born December 1, 1955. In 1993 graduated from Air Force Engineering Academy. In September 1999 started to study Forex markets. Since 2002 has been reading lectures on the technical analysis . Is fond of research work. Created a personal trading system based on the indicator analysis. Authored the book on technical analysis "Calculation of the next candlestick". At present the next book is being prepared for publishing "Indicator Analysis of Forex Market. Trading System Encyclopedia". Has created eleven courses on indicator analysis. Uses classical indicators. Works as a public lecturer. Held numerous seminars and workshops presented at international exhibitions of financial markets industry. Is known as one of the best specialists in the Russian Federation researching indicator analysis. Grigory Sokolov  Born 1 January, 1986. In 2008 graduated from Kiev Institute of Business and Technology with "Finance and Credit" as a major. Since 2008 has studied the behavior of various currency pairs and their correlation on Forex. In his works and trading practice he uses candlestick analysis and Fibonacci technique. Since 2009 has written analytical reviews and articles which are published on popular Internet resources. Interests: music, computers and cookery. "Out of five deadly sins of business and as a rule, the most widespread, excessive striving to get profit is the worst". P. Drucker Born 1 January, 1986. In 2008 graduated from Kiev Institute of Business and Technology with "Finance and Credit" as a major. Since 2008 has studied the behavior of various currency pairs and their correlation on Forex. In his works and trading practice he uses candlestick analysis and Fibonacci technique. Since 2009 has written analytical reviews and articles which are published on popular Internet resources. Interests: music, computers and cookery. "Out of five deadly sins of business and as a rule, the most widespread, excessive striving to get profit is the worst". P. Drucker Sebastian Seliga  Sebastian Seliga was born on 13th Oсtober 1978 in Poland. He graduated in 2005 with MA in Social Psychology. He has worked for leading financial companies in Poland where he actively traded on NYSE, AMEX and NASDAQ exchanges. Sebastian started Forex trading in 2009 and mastered Elliott Wave Principle approach to the markets by developing and implementing his own trading strategies of Forex analysis. Since 2012, he has been writing analitical reviews based on EWP for blogs and for Forex websites and forums. He has developed several on-line projects devoted to Forex trading and investments. He is interested in slow cooking, stand-up comedy, guitar playing, reading and swimming. "Every battle is won before it is ever fought", Sun Tzu Sebastian Seliga was born on 13th Oсtober 1978 in Poland. He graduated in 2005 with MA in Social Psychology. He has worked for leading financial companies in Poland where he actively traded on NYSE, AMEX and NASDAQ exchanges. Sebastian started Forex trading in 2009 and mastered Elliott Wave Principle approach to the markets by developing and implementing his own trading strategies of Forex analysis. Since 2012, he has been writing analitical reviews based on EWP for blogs and for Forex websites and forums. He has developed several on-line projects devoted to Forex trading and investments. He is interested in slow cooking, stand-up comedy, guitar playing, reading and swimming. "Every battle is won before it is ever fought", Sun Tzu l Kolesnikova  text text Pavel Vlasov  No data No data Torben Melsted  Born in November 1962. Graduated from CBS, got Diploma in Finance. Began trading on Forex in 1986 and since that time held various positions such as advising clients, hedging client flows on FX and commodity markets. Also worked for major corporations as Financial Risk Manager. Uses Elliott wave analysis in combination with classic technical analysis, and has been using a Calmar Ratio of 5.0 for over 3 years. Has his own blog, where he uses Elliott wave and technical analysis on all financial markets. Born in November 1962. Graduated from CBS, got Diploma in Finance. Began trading on Forex in 1986 and since that time held various positions such as advising clients, hedging client flows on FX and commodity markets. Also worked for major corporations as Financial Risk Manager. Uses Elliott wave analysis in combination with classic technical analysis, and has been using a Calmar Ratio of 5.0 for over 3 years. Has his own blog, where he uses Elliott wave and technical analysis on all financial markets.
Subscription's options management Theme's:
Fundamental analysis, Fractal analysis, Wave analysis, Technical analysis, Stock Markets
Author's :
A Zotova, Aleksey Almazov, Alexander Dneprovskiy, Alexandr Davidov, Alexandros Yfantis, Andrey Shevchenko, Arief Makmur, Dean Leo, Evgeny Klimov, Fedor Pavlov, Grigory Sokolov, I Belozerov, Igor Kovalyov, Irina Manzenko, Ivan Aleksandrov, l Kolesnikova, Maxim Magdalinin, Mihail Makarov, Mohamed Samy, Mourad El Keddani, Oleg Khmelevskiy, Oscar Ton, Pavel Vlasov, Petar Jacimovic, R Agafonov, S Doronina, Sebastian Seliga, Sergey Belyaev, Sergey Mityukov, Stanislav Polyanskiy, T Strelkova, Torben Melsted, V Isakov, Viktor Vasilevsky, Vladislav Tukhmenev, Vyacheslav Ognev, Yuriy Zaycev, Zhizhko Nadezhda
Edit data of subscription settings
Unsubscribe from the mailing list Sincerely,
Analysts Service | If you have any questions, you can make a phone call using one of the
InstaForex Toll free numbers right now:
|  | InstaForex Group is an international brand providing online trading services to the clients all over the world. InstaForex Group members include regulated companies in Europe, Russia and British Virgin Islands. This letter may contain personal information for access to your InstaForex trading account, so for the purpose of safety it is recommended to delete this data from the history. If you have received this letter by mistake, please contact InstaForex Customer Relations Department. |


No comments:
Post a Comment