| Analytics and trading signals for beginners. How to trade EUR/USD on November 5? Plan for opening and closing trades on Thursday 2020-11-05 Hourly chart of the EUR/USD pair 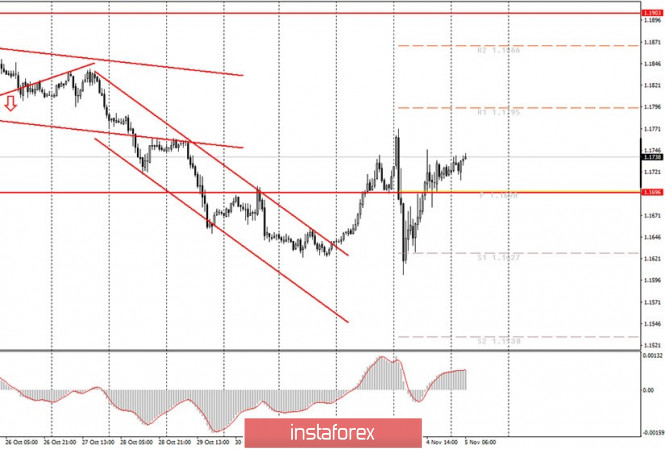 The EUR/USD pair continued a rather calm upward movement last night, however, we believe that the "storm" in the currency market is not over yet. We will discuss the foundation below. From a technical point of view, quotes will continue to rise, but it can be replaced by a downward pullback or correction at any time. There is still no clear trend, so we cannot advise you to trade for an increase (or, conversely, a decrease) right now. Consequently, the uncertainty factor is much higher than usual. Theoretically, you can try to catch a sell signal from the MACD indicator, since this will be absolutely normal for the process of calming down (a turn of a downward movement). We believe that the pair can go down by points today. At the same time, advise you to wait until a clear trend appears. We continue to receive reports on the counting of votes in the presidential elections. As of Thursday morning, Joe Biden is in the lead by 50 "electoral votes" and is 6 votes short of winning. Therefore, with a high degree of probability, it can be stated that Biden has won the election. However, firstly, there are no final results yet, and secondly, protests, rallies and riots (in most cases against Trump) have already begun in many US cities, and thirdly, the most interesting thing can begin after the final results are announced. Despite the fact that the gap between Trump and Biden is large enough, this does not mean that Donald Trump will calmly step down and hand over power to a Democrat. Yesterday, Trump said he would demand a review of the results in some states. That is, litigation is unlikely to be avoided. And all these events can be extremely important for the US dollar. Simply put, nothing is over yet. And traders need to be prepared for a new round of volatile market movements. In addition to the elections, the US will also sum up the results of the Federal Reserve meeting today. Although no one expects the US central bank to change the monetary policy in November, nevertheless, we might receive important and interesting information. Fed Chairman Jerome Powell can share his vision of the current state of the American economy, and there is something to say on this topic. Take note of the package of financial assistance that has not been adopted to all the unemployed and the sectors of the economy most affected by the pandemic and crisis. Democrats and Republicans have never been able to come to a common denominator on this issue. In general, Powell will have something to say. Possible scenarios for November 5: 1) Buy positions on the EUR/USD pair became relevant after the price settled above the descending channel. However, at this time, the pair tends to often change direction, and each turn of movement can be very strong. Over the past hours, the pair has already increased by more than 130 points, so the upward movement is unlikely to continue. In general, it will be extremely difficult to receive buy signals by today or tomorrow, and the fundamental background may continue to have a strong impact on the mood of the markets. 2) Trading for a fall at this time is irrelevant, despite the fact that trading down has more chances and probability right now. Theoretically, novice traders can try to work out a new sell signal from the MACD with a target of 1.1627, but then one should not forget about Stop Loss. We advise you to wait until the markets calm down. On the chart: Support and Resistance Levels are the Levels that serve as targets when buying or selling the pair. You can place Take Profit near these levels. Red lines are the channels or trend lines that display the current trend and show in which direction it is better to trade now. Up/down arrows show where you should sell or buy after reaching or breaking through particular levels. The MACD indicator (14,22,3) consists of a histogram and a signal line. When they cross, this is a signal to enter the market. It is recommended to use this indicator in combination with trend lines (channels and trend lines). Important announcements and economic reports that you can always find in the news calendar can seriously influence the trajectory of a currency pair. Therefore, at the time of their release, we recommended trading as carefully as possible or exit the market in order to avoid a sharp price reversal. Beginners on Forex should remember that not every single trade has to be profitable. The development of a clear strategy and money management are the key to success in trading over a long period of time. EUR/USD: plan for the European session on November 5. COT reports. Biden lacks 6 electoral votes or one state of Nevada 2020-11-05 To open long positions on EUR/USD, you need: In yesterday's afternoon forecast, I told buyers to go beyond the 1.1701 level, which happened. Let's take a look at the 5-minute chart and talk about where you could have entered long positions yesterday. The euro did not significantly rise when the 1.1701 level was tested from top to bottom, but it did produce a signal to buy the euro further along the trend, afterwards the bears tried to regain control of the market, but nothing happened. Returning to the 1.1701 level and testing it from top to bottom confirmed the presence of large buyers in the market, betting on the euro's growth. 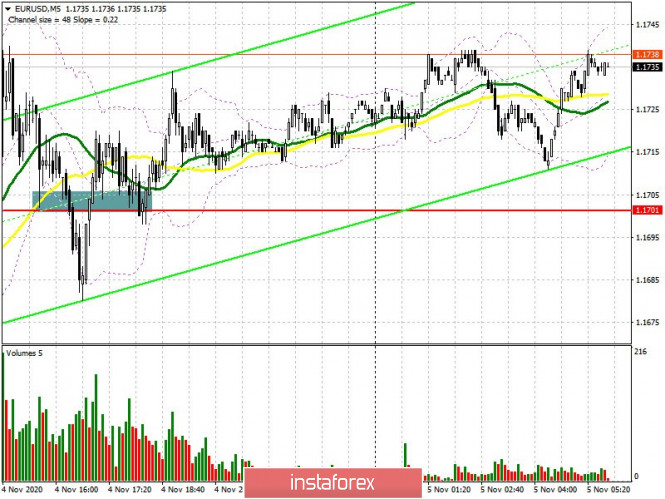 A buy signal will be processed as long as trading is carried out above 1.1701. The nearest target of the bulls is resistance at 1.1765, its breakout will powerfully push the pair upwards. However, this will happen most likely after the news that Biden is about to become the new president of the United States. Getting the pair to settle above 1.1765 and testing it from top to bottom, similar to yesterday's purchase, will lead to a new wave of EUR/USD growth in the area of highs of 1.1814 and 1.1864, where I recommend taking profit. In case the pair falls in the first half of the day, you can count on a false breakout in the support area of 1.1701, where the moving averages also pass, playing on the side of the euro buyers. If there is no activity at this level, I recommend opening long positions only on a rebound from the low of 1.1655, or from the lower border of the wide horizontal channel at 1.1604, counting on a 15-20 point correction within the day. To open short positions on EUR/USD, you need: Sellers have one simple task - to keep resistance at 1.1765, where a false breakout will be a signal to open short positions in the euro. A breakout of this range will lead to removing the bears' stop-orders, therefore, before selling the euro, make sure that a false breakout is taking place. Any advantage towards Trump in Nevada, while on Biden's side, could increase demand for the US dollar. The primary task of the bears in these conditions is to return and settle below support at 1.1701, testing it from the bottom up forms a good entry point for short positions, in hopes to bring back the bear market and for the pair to fall to the 1.1655 support. The 1.1604 level will be the next target, where I recommend taking profits. A breakthrough will take place only if Trump wins the US presidential election. In case bears are not active at 1.1765, I recommend postponing short positions until the 1.1814 high has been updated, or sell EUR/USD immediately upon a rebound from the 1.1864 resistance, counting on a 15-20 point correction within the day. 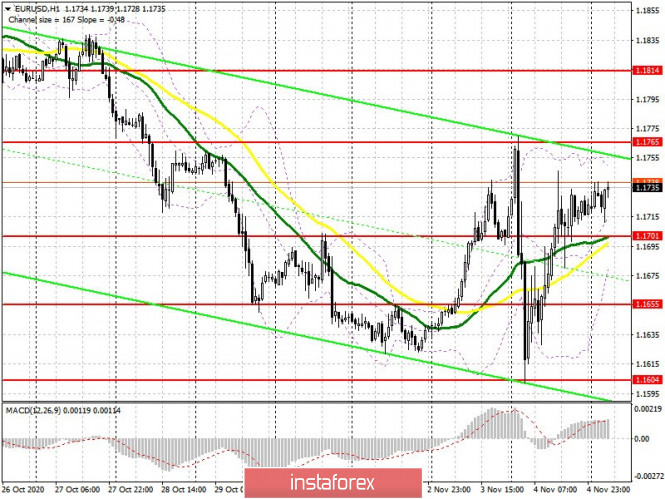 The Commitment of Traders (COT) report for October 27 showed a reduction in both long and short positions. Despite this, buyers of risky assets believe that the bull market will continue and so they prefer to act with caution. Thus, long non-commercial positions fell from 229,878 to 217,443, while short non-commercial positions also fell to 61,888 from 63,935. The total non-commercial net position decreased to 155,555 from 165,943 a week earlier. However, the bullish sentiments for the euro remains rather high in the medium term. The more the euro will decline against the US dollar at the end of this year, the more attractive it will be for new investors, especially following the US presidential elections, when additional pressure on the market on this issue eases. Indicator signals: Moving averages Trading is carried out just above 30 and 50 moving averages, which indicates an attempt by the bulls to take the initiative. Note: The period and prices of moving averages are considered by the author on the H1 hourly chart and differs from the general definition of the classic daily moving averages on the daily D1 chart. Bollinger Bands A breakout of the upper border of the indicator around 1.1745 will lead to a new wave of euro growth. A breakout of the lower boundary of the indicator around 1.1695 will increase the pressure on the pair. Description of indicators - Moving average (moving average, determines the current trend by smoothing out volatility and noise). Period 50. It is marked in yellow on the chart.
- Moving average (moving average, determines the current trend by smoothing out volatility and noise). Period 30. It is marked in green on the chart.
- MACD indicator (Moving Average Convergence/Divergence — convergence/divergence of moving averages) Quick EMA period 12. Slow EMA period to 26. SMA period 9
- Bollinger Bands (Bollinger Bands). Period 20
- Non-commercial speculative traders, such as individual traders, hedge funds, and large institutions that use the futures market for speculative purposes and meet certain requirements.
- Long non-commercial positions represent the total long open position of non-commercial traders.
- Short non-commercial positions represent the total short open position of non-commercial traders.
- Total non-commercial net position is the difference between short and long positions of non-commercial traders.
GBP/USD: plan for the European session on November 5. COT reports. Pound falls ahead of Bank of England monetary policy meeting 2020-11-05 To open long positions on GBP/USD, you need: The British pound drew quite a lot of entry points yesterday, both in buying and selling. Let's try to deal with them all. The bears began to actively defend support at 1.2914 after the pair fell in the first half of the day, where a false breakout produced a fairly good signal to buy the pound, which was fully implemented. Towards lunchtime, the bulls regained resistance at 1.2967 and settled on it, which produced another signal to buy the pound in order to continue the upward trend. And this signal worked and brought about 70 points of profit, as the price reached the target level of 1.3043. Forming a false breakout on it brought back sellers to the market and quickly dumped the pound back to the support of 1.2967, testing it from top to bottom, after the bears' unsuccessful attempt to go even lower, led to producing a buy signal. However, it was less successful, although the upward movement was more than 40 points. I marked all entry points on the chart. 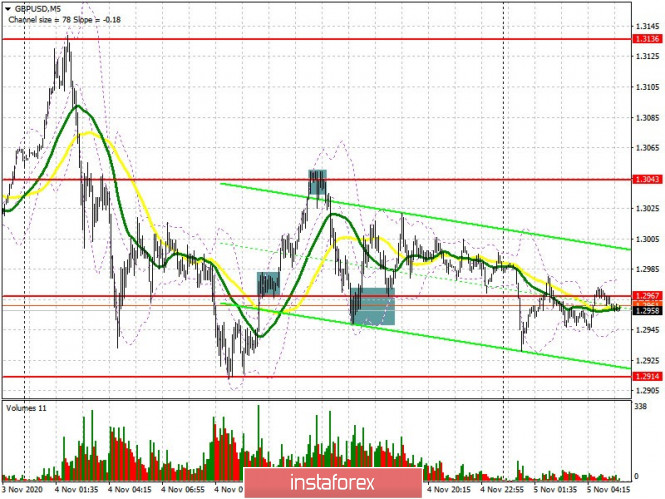 The picture has slightly changed at the moment, although the key levels have remained in place. Bulls are focused on getting control of resistance at 1.2978, which is also the middle of the horizontal channel. Moving averages also pass above this level, playing on the side of the pound sellers. A confident breakout and being able to test this level from top to bottom forms a good entry point into long positions in hopes to continue the upward movement and updating the 1.3043 high, where I recommend taking profits. You can count on going beyond this range following the Bank of England meeting on monetary policy. If the rate is shifted towards stimulating the economy, it will support the pound and lead to updating a new high of 1.3136. In case the pair falls in the first half of the day, it is best to wait for a false breakout near the lower border of the horizontal channel at 1.2914, similar to yesterday, and buy the pound afterwards, in hopes to bring back the pair's growth. Lack of activity in this area could pull down GBP/USD to a low of 1.2856, on which the further major upward movement of the pair depends. You can open long positions from it, counting on a rebound of 30-40 points within the day. To open short positions on GBP/USD, you need: Pound sellers are aiming for support at 1.2914. A breakout and getting the pair to settle below this range will form a new entry point for short positions, which will cause the pound to fall to a low of 1.2856, on which the current bull market depends. A breakout and being able to settle below this range will lead to removing a number of buy stop orders, which will pull down the pound to the 1.2807 and 1.2749 areas, where you can observe a slight upward correction. However, such a scenario will only be realized if Donald Trump wins the US presidential election, or if the Bank of England announces the introduction of negative interest rates. In case bears are not active and the pair grows in the first half of the day, it is best to think about selling only when a false breakout forms in the resistance area of 1.2978. You can open short positions in GBP/USD immediately for a rebound only from a high of 1.3043, counting on a correction of 20-30 points within the day. 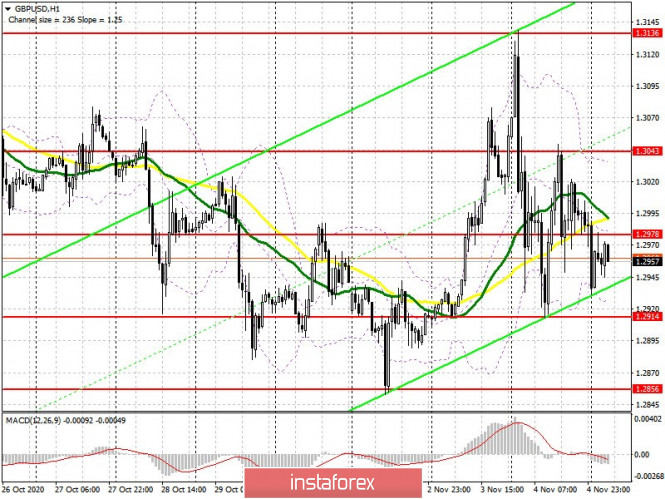 The Commitment of Traders (COT) reports for October 27 showed a reduction in both short and long positions. Long non-commercial positions fell from 39,836 to 31,799. At the same time, short non-commercial positions fell from 41,836 to 38,459. As a result, the negative non-commercial net position was at -6,660, against -2,000 a week earlier, which indicates that the sellers of the British pound retained control and also shows their minimal advantage in the current situation. Indicator signals: Moving averages Trading is carried out below 30 and 50 moving averages, which indicates an attempt by the bears to control the market. Note: The period and prices of moving averages are considered by the author on the H1 hourly chart and differs from the general definition of the classic daily moving averages on the D1 daily chart. Bollinger Bands A break of the lower border of the indicator in the 1.2935 area will increase the pressure on the pound. Growth will be limited in the area of the upper level of the indicator at 1.3040. Description of indicators - Moving average (moving average, determines the current trend by smoothing out volatility and noise). Period 50. It is marked in yellow on the chart.
- Moving average (moving average, determines the current trend by smoothing out volatility and noise). Period 30. It is marked in green on the chart.
- MACD indicator (Moving Average Convergence/Divergence — convergence/divergence of moving averages) Quick EMA period 12. Slow EMA period to 26. SMA period 9
- Bollinger Bands (Bollinger Bands). Period 20
- Non-commercial speculative traders, such as individual traders, hedge funds, and large institutions that use the futures market for speculative purposes and meet certain requirements.
- Long non-commercial positions represent the total long open position of non-commercial traders.
- Short non-commercial positions represent the total short open position of non-commercial traders.
- Total non-commercial net position is the difference between short and long positions of non-commercial traders.
Indicator analysis. Daily review on EUR/USD on November 5, 2020 2020-11-05 Trend analysis (Fig. 1). Today, the market from the level of 1.1726 (closing of yesterday's daily candlestick) may continue to move up with the goal of 1.1751 – a pullback level of 50.0% (blue dotted line). When testing this level, further work upward with the goal of 1.1781 – a pullback level of 61.8% (blue dotted line). 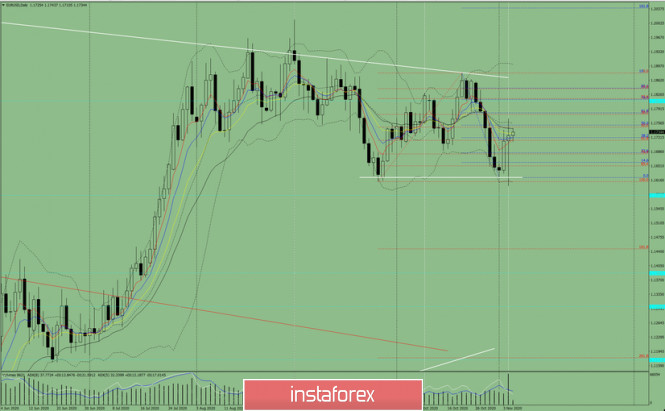
Figure 1 (Daily chart). Comprehensive analysis: - Indicator analysis - up;
- Fibonacci levels - up;
- Volumes - down;
- Candlestick analysis - up;
- Trend analysis - up;
- Bollinger bands - down;
- Weekly chart - down.
General conclusion: The market from the level of 1.1726 (closing yesterday's daily candlestick) can continue to move up with the goal of 1.1751 - a pullback level of 50.0% (blue dotted line) today. When testing this level, further work upward with the goal of 1.1781 – a rollback level of 61.8% (blue dotted line). Unlikely scenario: from the level of 1.1726 (closing of yesterday's daily candlestick), the price may continue to move up with the goal of 1.1751 – a pullback level of 50.0% (blue dotted line). When testing this level, further work downward with the goal of 1.1714 – a pullback level of 61.8% (red dotted line). Technical Analysis of EUR/USD for November 5, 2020 2020-11-05 Technical Market Outlook: The US presidential elections result is still uncertain and the volatility on all US Dollar pairs has increased. After the EUR/USD pair had made another local low at the level of 1.1602, the price bounced towards the new local high seen at the level of 1.1744 which is inside of the main descending channel. The momentum is positive and the market conditions at the H4 time frame chart are bouncing from the extremely oversold levels, so please keep an eye on a temporary rebound. The nearest technical resistance is seen at the level of 1.1790. Bears are in full control of the market and the weekly outlook is bearish despite the election night in the USA. Weekly Pivot Points: WR3 - 1.1974 WR2 - 1.1916 WR1 - 1.1756 Weekly Pivot - 1.1698 WS1 - 1.1531 WS2 - 1.1471 WS3 - 1.1314 Trading Recommendations: Since the middle of March 2020 the main trend is on EUR/USD pair has been up, which can be confirmed by almost 10 weekly up candles on the weekly time frame chart and 4 monthly up candles on the monthly time frame chart. The recent correction towards the level of 1.1612 seems to be completed and now market is ready for another wave up. This means any local corrections should be used to buy the dips until the key technical support is broken. The key long-term technical support is seen at the level of 1.1445. The key long-term technical resistance is seen at the level of 1.2555. 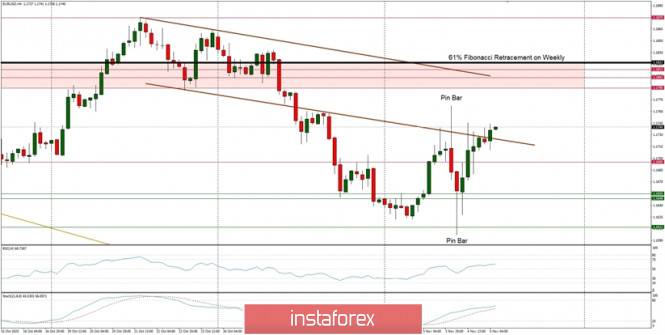
Technical Analysis of GBP/USD for November 5, 2020 2020-11-05 Technical Market Outlook: Not much has changed since yesterday as the GBP/USD pair keeps making the up and down swings as the votes of the presidential elections in the USA are still being collected. The price has broken out of the acceleration channel and made a local high at the level of 1.3136, but the four hour candle closed way below the top, at the level of 1.3027. Currently, it looks like the US Dollar is getting stronger again and the Pound continues the move to the downside towards the short -term trend line support. Any sustained violation of this trend line will indicate more bearish pressure that can push the prices to the level of 1.2868, 1.2848 or even 1.2816. The weak and negative momentum supports the short-term bearish outlook despite the oversold market conditions. Only a sustained breakout above the level of 1.2982 would change the intraday outlook to bullish. Weekly Pivot Points: WR3 - 1.3236 WR2 - 1.3153 WR1 - 1.3037 Weekly Pivot - 1.2956 WS1 - 1.2835 WS2 - 1.2757 WS3 - 1.2653 Trading Recommendations: The GBP/USD pair is in the down trend on the monthly time frame, but the recent bounce from the low at 1.1411 made in the middle of March 2020 looks very strong and might be a reversal swing. In order to confirm the trend change, the bulls have to break through the technical resistance seen at the level of 1.3518. All the local corrections should be used to enter a buy orders as long as the level of 1.2674 is not broken. 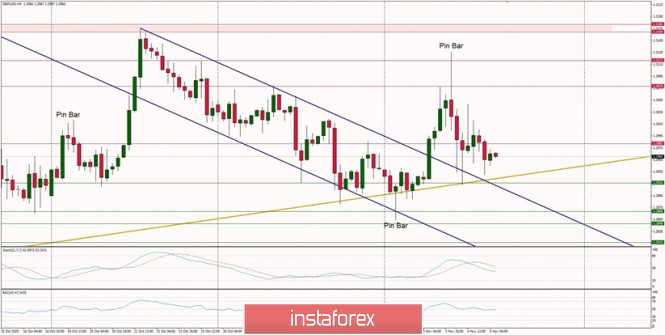
Trading plan for EUR/USD and GBP/USD on 11/05/2020 2020-11-05 Let's not give in to general panic and set aside our emotions. In short, we should let the Americans figure out their own elections. It is no longer so important whether there are falsifications and frauds or not. Due to this chaotic process of election, serious conclusions will be drawn. First, we should focus on how the market behaves, especially in the currency market. As soon as the counting began, Mr. D. Trump was leading in a number of key states, and theoretically gained enough electoral votes to maintain his residence in the White House for another four years. The US dollar was steadily rising at this moment, but as soon as the favor shifted towards Mr. J Biden, the same currency began to lose its position. There is a clear reason for this behavior – from the point of view of investors, Biden's victory is ambiguous. If everything is quite clear with the economic policy of Donald Trump, then we don't know what to expect from Joseph Biden. During the election campaign, he was so carried away by the current President's accusations of working for foreign intelligence services and a complete failure in the fight against COVID-19, that he simply did not have time to tell about his economic program. Thus, the market's reaction to a possible victory for Joseph Biden is largely understandable, but this is only what lies on the surface. The whole point here is that during the entire post-war history, the United States acted as a kind of last refuge. That is, during any global crisis, capital from all over the world flocked to America. In view of this, investors fled from ever-increasing risks. Therefore it is not surprising if American banks and investment funds are considered to be the ones who control the bulk of capital in the world. Due to the current situation, each of us tries to find the safest and most peaceful place. So, this whole political circus, which is now happening in the United States, undermines the dollar's positions, with serious long-term consequences. Over the next two days, the market will be pushed from side to side, due to consecutive information flow. In this regard, the FOMC meeting will be entirely ignored and the Fed, in turn, will not take any steps as everyone is waiting for the final results of the elections. 
The EUR/USD pair is focused on chaotic surges, depending on the incoming information. We can assume that speculative hype will continue in the market, where the information flow will remain as the main lever, and the variable levels will be the levels of 1.1700 and 1.1765. 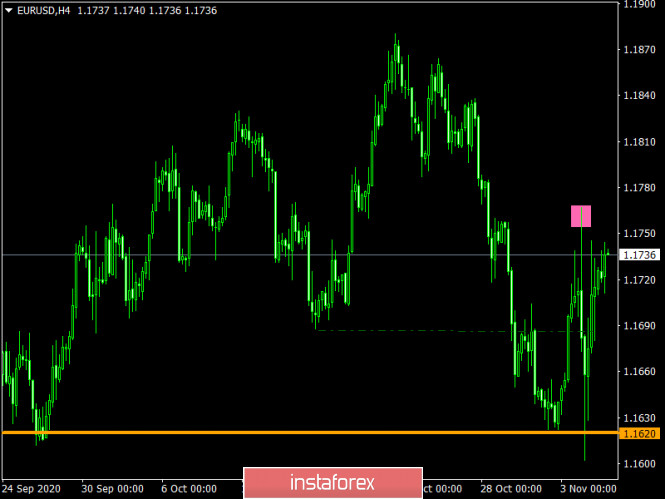
The GBP/USD pair is very active, working on the speculators' account, where the range of 1.2930/1.2980 became a temporary stop. The range will be broken soon, where the primary trading tactic is considered to be the method of breaking through the established boundaries. 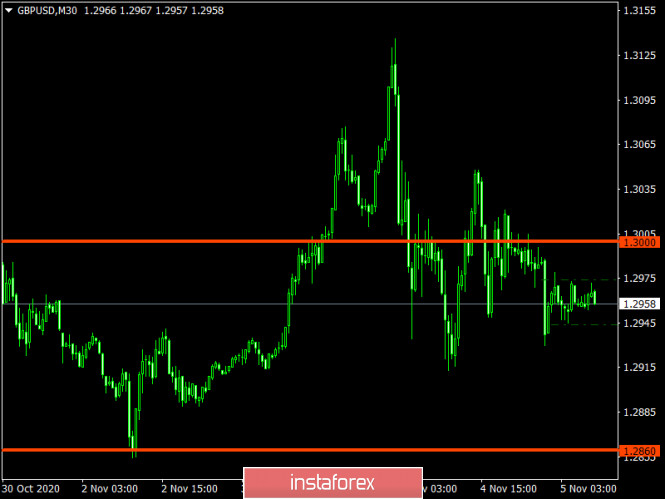
EUR/USD. Mr. Biden needs one last push to win the elections 2020-11-05 The degree of intensity in the currency market declined during the Asian session on Thursday. The dollar pairs who are part of the majority no longer make violent reactions to the news flow in the United States, since it is becoming clear that Mr. J Biden will win the presidential election. He only just needs one more electoral vote, which can officially lead him to the White House. In turn, Mr. Trump can now only rely on the Supreme Court, where he will appeal the results of the vote count. Thus, in general, we have a more or less understandable and predictable situation. The currency market is taking a wait-and-see position, assessing the judicial forecasts for the claims of the (still) current president. In addition, we should note Fed's meeting will be held today, which results can likely affect the dollar bulls' position. 
However, the main topic in the currency market is still the US elections. Despite Joe Biden's significant advantage, the intrigue still persists, although the Republicans' hopes for a victory for their leader are gradually fading. According to FOX News, current President Donald Trump has 214 electoral votes, while Biden has 264 out of the required 270 as of November 5 in the morning. Although 60 electoral votes remain to be distributed, the Democratic leader needs the support of only six of them. American media believes that it is enough for Mr. Biden to win in one more state (except for Alaska, which gives the votes of three electors) to defeat his opponent and become the new president of the United States. So, according to preliminary data, he wins in such key States as Michigan and Wisconsin. If the democratic candidate holds the advantage there, it is highly likely that he will become the 46th President of the United States. Meanwhile, the head of the White House resorted to another tactic – judicial. Trump's side filed a lawsuit in a Michigan court to suspend the counting of votes in this state. Lawyers believe that the Republican party observers were not given "proper full access" to the procedure for opening ballot boxes and counting ballots. This is the third such lawsuit in the course of the election. So, the headquarters of the current President demanded a recount of votes in Wisconsin and in the state of Georgia. However, American experts have different opinions on the judicial prospects of the above-mentioned claims, while the OSCE has already criticized Trump's statements about alleged mass violations in the elections. According to the organization's representatives, such statements harm the US democratic institutions' credibility. They also said that the process of appealing the procedure for holding elections in the States started too late. Against this background, it is already unlikely for Trump to win the election: to do this, it is necessary to maintain leadership in those states where he is currently winning and capture such wavering states as Arizona, Nevada and Wisconsin. The task is difficult, but theoretically doable. On the other hand, Biden needs to similarly maintain victory where he is already in the lead, with a fixed success in any state where the number of electors is more than six. This is based on the data of the FOX News TV channel, which claims that the Democratic leader already has 264 electoral votes. As for the congressional by-elections, the current situation is not as pleasant for the Democrats as with the presidential race. According to preliminary data, the Republicans retain their majority in the Senate, although they are reducing their advantage (from 53 to 52 out of 100). The Democrats, in turn, retained the majority of the seats in the House of Representatives. They reportedly won 227 seats in the US House of Representatives, while Republicans won 208 out of 435 seats. In short, the representatives of the Democratic Party could not change the situation in their favor by controlling the Senate, but, on the other hand, they did not lose the House of Representatives. In this case, the balance of power remained almost unchanged: the Democrats lost several seats in the Lower House, while the Republicans lost one seat in the Upper House but both retained control. To sum it up, Mr. Biden won in the most important states - Wisconsin and Michigan and he has now 264 electoral votes out of the required 270. However, votes in four key states - Pennsylvania, North Carolina, Georgia and Nevada have not yet been counted. If Biden wins at least in Nevada, then this will bring him the missing 6 votes, and, accordingly, an overall victory. In disputed states, Trump is filing lawsuits in courts demanding a recount, accusing the Democrats of "cheating" votes. At the same time, the OSCE mission called the US elections "well organized." At the same time, observers did not identify violations during the postal vote, calling Trump's words about falsification "unsubstantiated." In view of such events, the US dollar is slowly losing its positions in the main currency pairs. Thus, the buyers of EUR/USD have finally consolidated within the 17th figure, while showing bullish moods. In my opinion, we can already talk about the priority of long positions in the pair today. There is a high probability that Biden will make the "last push", which means that the probability of an upward impulse of the EUR/USD pair is also high. The initial goal to rise is the level of 1.1850, which is the upper line of the Bollinger Bands indicator on the daily chart and a kind of "price ceiling." Traders cannot manage to consolidate above this goal over the past six weeks. Trading plan for the EUR/USD pair on November 5. Biden is half a step away from victory. 2020-11-05 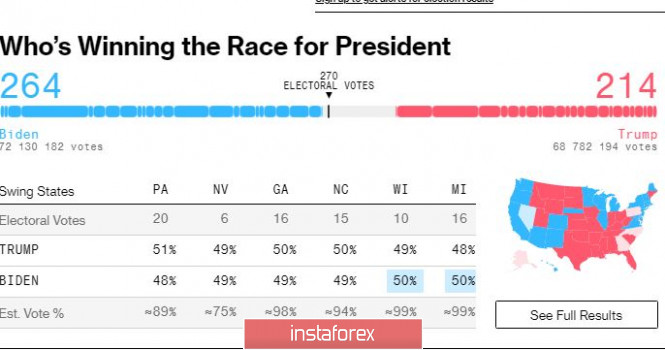
Joe Biden now only needs 6 electoral votes to win the US elections. For this, he just needs to maintain his current advantage (49.3% versus 48.7% for Trump), as well as gain the lead over Nevada. Nonetheless, Biden's victory is highly likely. Other important news today are the Federal Reserve's scheduled meeting and the latest US employment reports. However, the election results is likely to overshadow them. 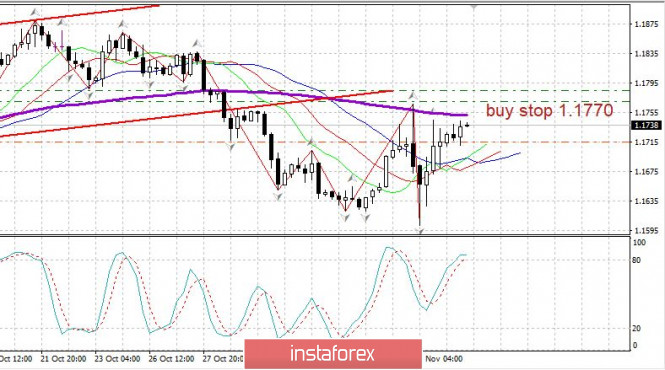
EUR/USD: The euro is climbing p. Set short positions at 1.1785, but be ready for an upward reversal after the quote reaches 1.1770. GBP/USD. November 5. COT report. London and Brussels again did not agree. The deadline for negotiations is 10 days away. 2020-11-05 GBP/USD – 1H. 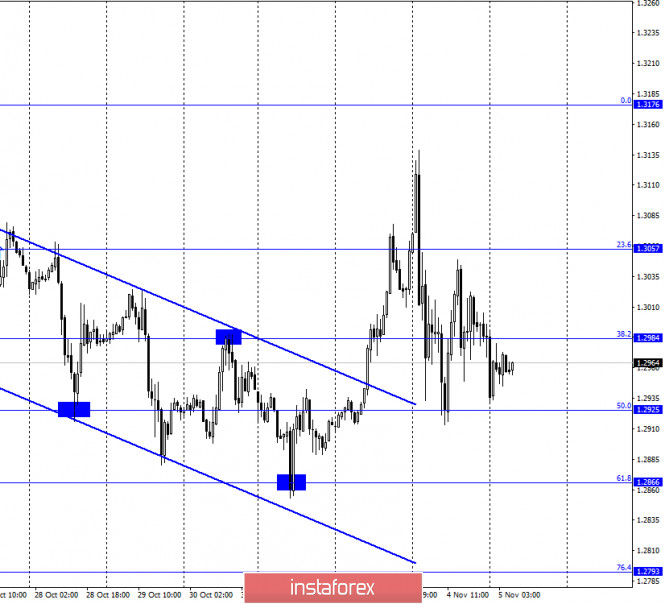
According to the hourly chart, the GBP/USD pair made a second attempt at strong growth, however, it stopped near the corrective level of 23.6% (1.3057). And if the euro has been growing over the past day, the British currency has not. And from my point of view, this is a very remarkable moment. Perhaps traders have finally realized that the trade agreement between the UK and the European Union is once again in danger of collapse. Michel Barnier and David Frost have been trying for almost two weeks to reach a consensus on the most "sensitive" issues, but as it turned out this morning, this was not possible. Thus, it is the Briton who can now continue the fall. Michel Barnier stated: "Despite the EU's efforts to find solutions, there are still very serious differences on issues of equal competition, management, and fisheries. These are the necessary conditions for any economic partnership." Thus, now we can once again say that the parties failed to reach an agreement, and the deadline is only 10 days away. London and Brussels were supposed to complete negotiations on October 15 but then decided to extend them for another month to still try to conclude a deal. As you can see, this didn't make much sense. But now Boris Johnson can start implementing the draft law "on the internal market", which violates previously reached agreements with the EU, and the EU can start legal proceedings on the fact of London's violation of the current Brexit agreement. GBP/USD – 4H. 
On the 4-hour chart, the GBP/USD pair performed a reversal in favor of the US currency and consolidated under the corrective level of 38.2% (1.3010), which allows us to count on a further drop in quotes in the direction of the next Fibo level of 50.0% (1.2867). However, as in the case of the European, I recommend paying more attention to the hourly chart today, which shows changes in the mood of traders more quickly. GBP/USD – Daily. 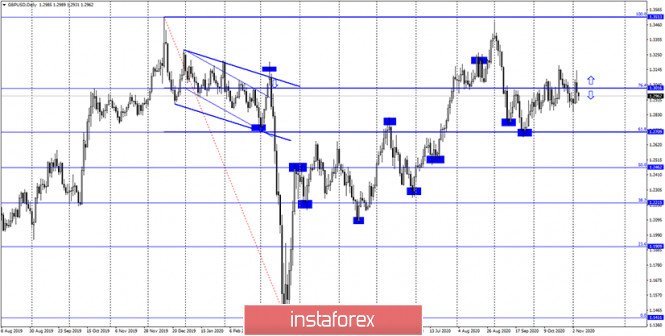
On the daily chart, the pair's quotes have consolidated under the corrective level of 76.4% (1.3016), which now allows us to expect a fall in the direction of the next corrective level of 61.8% (1.2709). GBP/USD – Weekly. 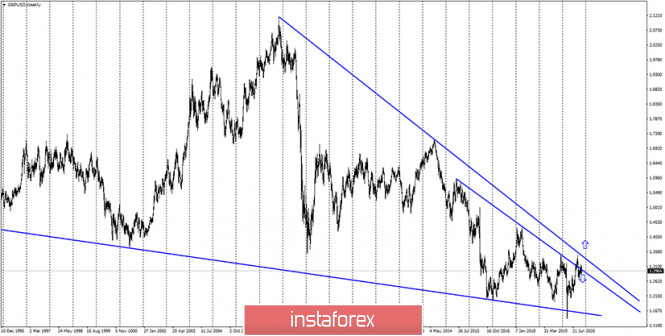
On the weekly chart, the pound/dollar pair closed under the lower downward trend line, thus, a false breakout of this line followed earlier. However, in recent weeks, the pair has made new attempts to gain a foothold over both trend lines. Overview of fundamentals: On Wednesday, the UK's index of business activity in the service sector was higher, but none of the traders paid attention to it, as the topics of counting votes in America and the failure of negotiations in Brussels were much more important. News calendar for the United States and the United Kingdom: UK - decision on the main interest rate of the Bank of England (07:00 GMT). UK - decision on the planned volume of asset purchases by the Bank of England (07:00 GMT). UK - Bank of England Governor Andrew Bailey will deliver a speech (09:15 GMT). US - number of initial and repeated applications for unemployment benefits (13:30 GMT). US - FOMC decision on the main interest rate (19:00 GMT). US - accompanying FOMC statement (19:00 GMT). US - FOMC press conference (19-30 GMT). On November 5, the news calendar contains not only a summary of the FOMC meeting but also a summary of the Bank of England meeting with a speech by Governor Andrew Bailey. In addition, traders continue to wait for the final results of the US presidential election. COT (Commitments of Traders) report: 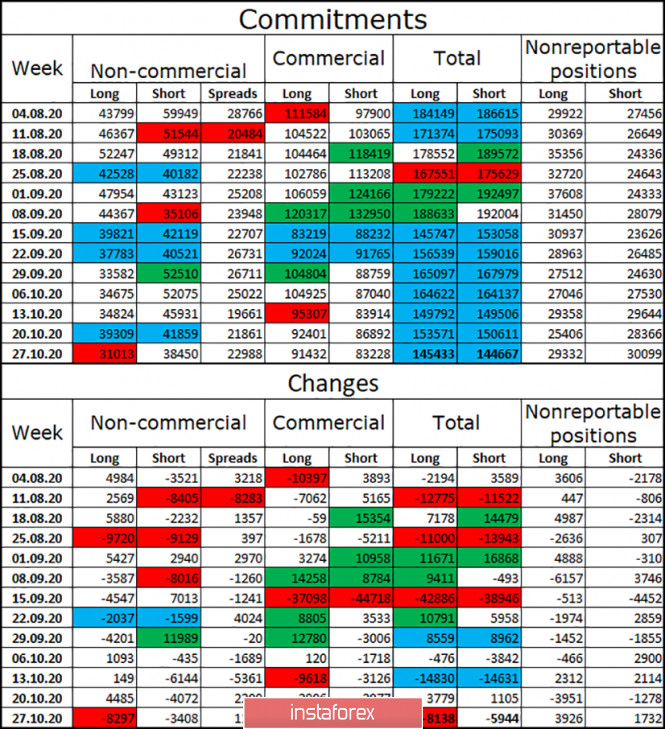
The latest COT report on the British pound showed that the mood of the "Non-commercial" category of traders became more "bearish" over the reporting week. Speculators got rid of 8,297 long contracts and 3,408 short contracts. Thus, in general, speculators got rid of any contracts for the British. However, it is mostly from long-contracts. This suggests that the major players do not believe in the pound. It is really extremely difficult to do this in the current conditions, as the prospects for the British economy remain extremely vague. Since August, the total number of long contracts in the hands of speculators has decreased to an absolute minimum – only 31,013. The total number of open contracts among all categories of traders has been almost the same for two months. Forecast for GBP/USD and recommendations for traders: Today, I recommend selling the GBP/USD pair with targets of 1.2866 and 1.2793, if the quotes close under the Fibo level of 50.0% (1.2925) on the hourly chart. I recommend buying the British dollar with the targets of 1.3057 and 1.3135 if the closing above the level of 1.2984 on the hourly chart is completed. Terms: "Non-commercial" - major market players: banks, hedge funds, investment funds, private, large investors. "Commercial" - commercial enterprises, firms, banks, corporations, companies that buy currency not for speculative profit, but for current activities or export-import operations. "Non-reportable positions" - small traders who do not have a significant impact on the price. EUR/USD. November 5. COT report. Joe Biden rushes to victory. Markets are quietly waiting for the results of the vote. 2020-11-05 EUR/USD – 1H. 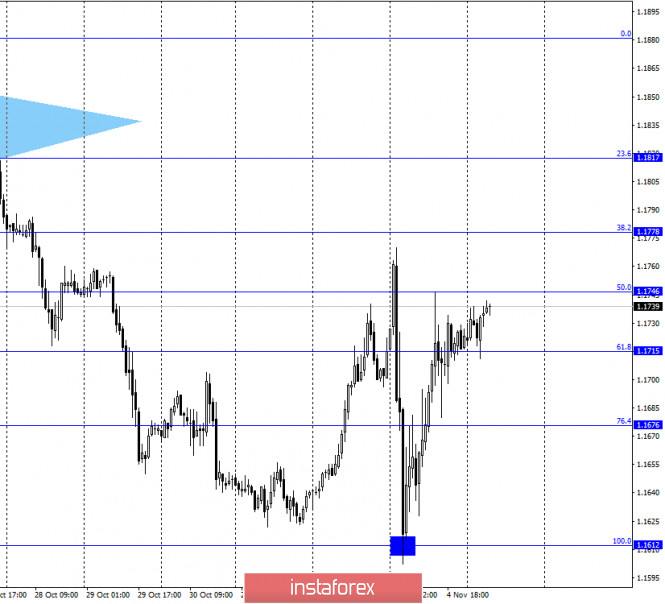
On November 4, the EUR/USD pair continued the growth process all day to the corrective level of 50.0% (1.1746). However, in general, I can not yet say that the nature of trading has become completely the same as before the election. Traders expected to see Joe Biden win the election, as absolutely all the sociological studies of recent months spoke in favor of the Democrat. And according to the latest data, a record number of Americans have voted for Joe Biden in recent decades, and the turnout in the elections has also become a record. So it's clear that Americans were interested this year to go to the polls and vote like never before. At the moment, Biden has almost 4 million more Americans than Trump, and he has received 264 electoral votes, while his opponent has only 214. Admittedly, Trump was predicted to suffer a more crushing defeat. However, at the moment, it remains to determine the winner in four more states: Georgia, Nevada, Pennsylvania, and North Carolina. And a total of four of these states can bring victory to Donald Trump. Such strong delays in counting votes are due to the high interest of Americans in voting by mail this year. Thus, not all letters with bulletins were received at their destination yet. This means that the presidential race is still going on, and traders are already quite calmly waiting for it to end. EUR/USD – 4H. 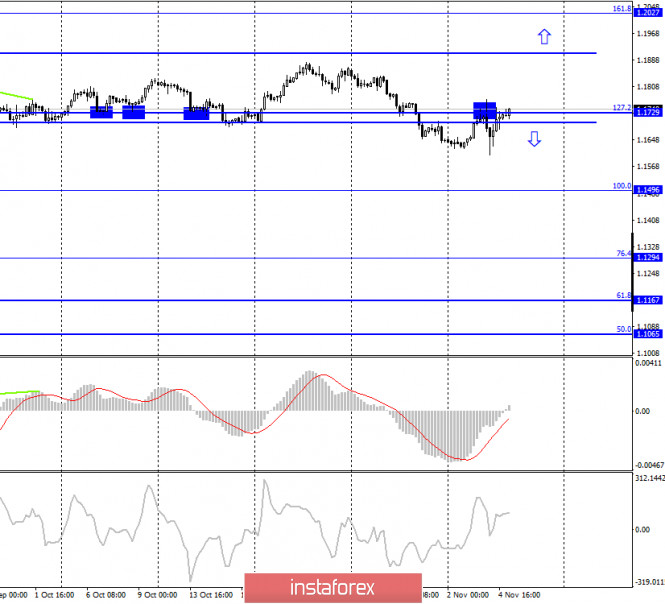
On the 4-hour chart, the pair's quotes returned this night to the corrective level of 127.2% (1.1729). A new rebound of the pair from this level will again work in favor of the US dollar and a new fall in the direction of the Fibo level of 100.0% (1.1496). However, just like yesterday, I recommend paying more attention to the hourly chart, as it is now possible to track changes in the mood of traders more quickly and react to them. EUR/USD – Daily. 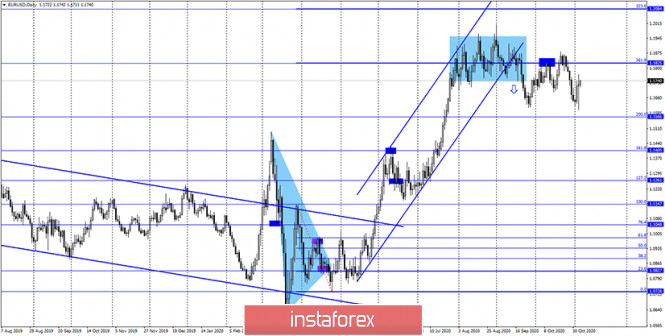
On the daily chart, the quotes of the EUR/USD pair performed a new rebound from the corrective level of 261.8% (1.1825), after which the quotes began and continue to fall in the direction of the Fibo level of 200.0% (1.1566). However, more attention now needs to be paid to smaller schedules, hourly, and 4-hour. EUR/USD – Weekly. 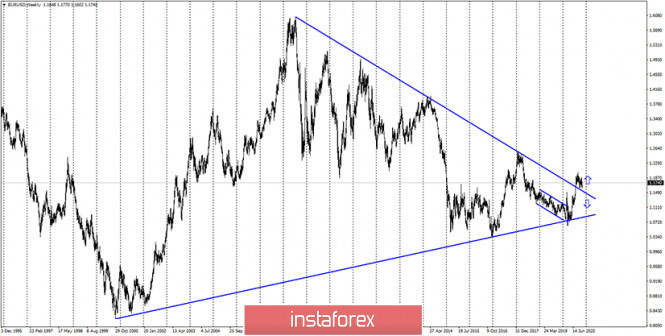
On the weekly chart, the EUR/USD pair performed a consolidation above the "narrowing triangle", which preserves the prospects for further growth of the pair, but in the long term. In the short term, a drop is preferable. Overview of fundamentals: On November 4, business activity indices for the service sector were released in the European Union and America. It was weak in Europe and strong in America. However, the effect of the strength of the US index was obscured by the ADP report on changes in the number of employees, which was much worse than traders' expectations. News calendar for the United States and the European Union: US- number of primary and repeated applications for unemployment benefits (13:30 GMT). US - FOMC decision on the basic interest rate (19:00 GMT). US - unemployment rate (19:00 GMT). US - FOMC press conference (19:30 GMT). On November 5, vote counting will continue in the United States, and the results of the election are not yet fully known. Also, the Fed will sum up the meeting in the evening, followed by a press conference. This is also a very important event. COT (Commitments of Traders) report: 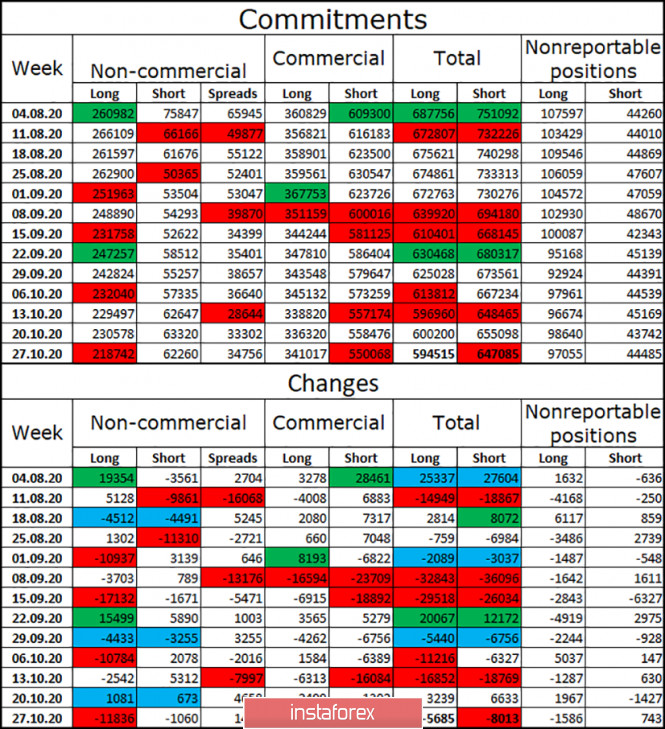
The latest COT report was quite informative. The most important category of non-commercial traders got rid of 12 thousand long contracts and 1 thousand short contracts during the reporting week. Thus, speculators do not believe in the further growth of the European currency and get rid of more purchases of this currency. This process has been going on for several weeks, thus, a trend is emerging. Over the past two months, the total number of long contracts in the hands of speculators has been steadily falling, while the number of short contracts has been growing slightly. Thus, I am inclined to the option with a further fall in the euro currency quotes. Forecast for EUR/USD and recommendations to traders: Today, I recommend opening sales of the euro currency with targets of 1.1715 and 1.1676, if the rebound from the Fibo level of 50.0% (1.1746) is completed. Purchases of the pair will be possible with targets of 1.1778 and 1.1746 if the quotes consolidate above the level of 76.4% on the hourly chart. Traders' activity may remain high today. Terms: "Non-commercial" - major market players: banks, hedge funds, investment funds, private, large investors. "Commercial" - commercial enterprises, firms, banks, corporations, companies that buy currency not for speculative profit, but for current activities or export-import operations. "Non-reportable positions" - small traders who do not have a significant impact on the price. Simplified wave analysis and forecast for GBP/USD, USD/JPY, and USD/CHF on November 5 2020-11-05 GBP/USD Analysis: The direction of the main movement vector of the British pound since October 21 is set by a downward wave. The wave structure completed a correction in the form of a stretched plane yesterday. The decline that has begun further has a reversal potential. Forecast: The most likely scenario today is the price moving sideways. At the European session, you can expect an attempt to put pressure on the calculated resistance. By the end of the day, the probability of a change of course and a decline in the support area increases. Potential reversal zones Resistance: - 1.3000/1.3030 Support: - 1.2910/1.2880 Recommendations: In the upcoming flat, buying the pound is risky. In the resistance zone, it is recommended to track the reversal signals for selling the instrument. 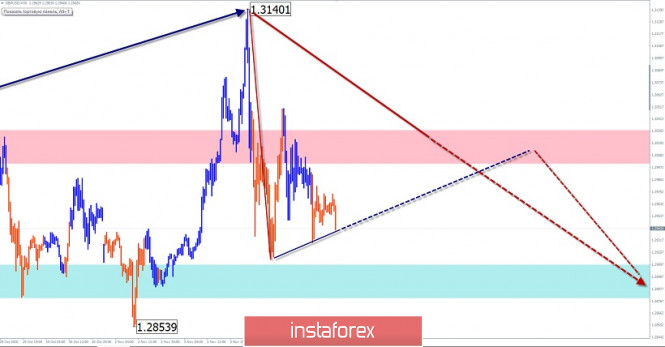
USD/JPY Analysis: On a large scale of the Japanese yen major chart, the price moves mainly horizontally. The current wave for short-term trading is descending, starting from October 7. Its structure has completed a flat correction (B). The decline that started yesterday has a reversal potential and may be the beginning of the final part (C). Forecast: In the next trading session, it is most likely to move in the side plane. An upward vector, no further than the calculated resistance, is not excluded. By the end of the day, you can expect activation and a second decline down. Potential reversal zones Resistance: - 104.60/104.90 Support: - 103.90/103.60 Recommendations: Trading on the yen market today is only possible within the intraday. There are no conditions for purchases. At the end of the upcoming pullback up, it is recommended to track the emerging signals for selling the pair. 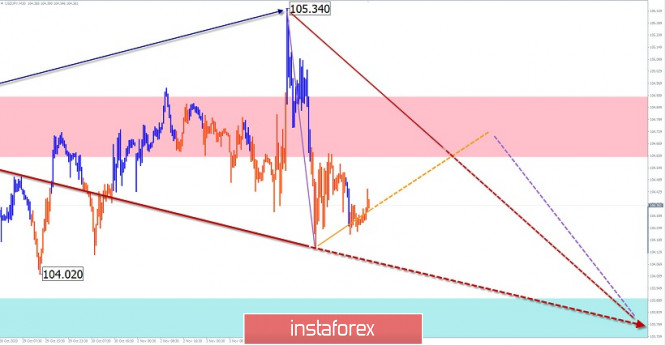
USD/CHF Analysis: In the short term, the downward wave from September 25 serves as a benchmark for analysis and trading. In its structure, the first two parts (A-B) are completed. Since November 4, a downward movement has been developing, with a reversal potential. If the reversal is confirmed, this will be the beginning of the final part (C). Forecast: Today, the pair is expected to move in the price corridor between the opposite zones. An upward trend is likely in the European session. By the end of the day, it is expected to return to the main direction. Potential reversal zones Resistance: - 0.9150/0.9180 Support: - 0.9090/0.9060 Recommendations: Trading on the pair's market today is possible within sessions with a reduced lot. When buying, you need to take into account the limited growth potential. After the appearance of reversal signals in the resistance zone, priority should be given to sales. 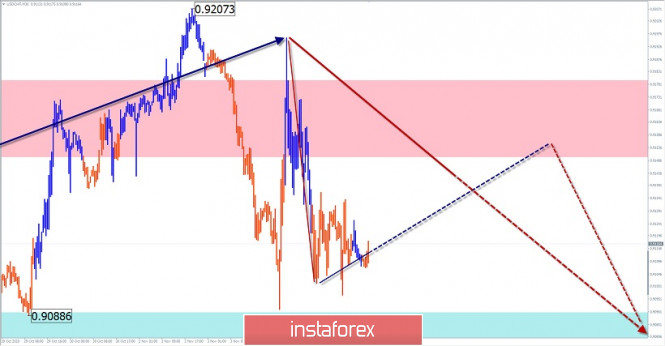
Explanation: In the simplified wave analysis (UVA), waves consist of 3 parts (A-B-C). The last incomplete wave is analyzed. The solid background of the arrows shows the formed structure, and the dotted background shows the expected movements. Note: The wave algorithm does not take into account the duration of the instrument's movements in time! Technical analysis of GBP/USD for November 05, 2020 2020-11-05 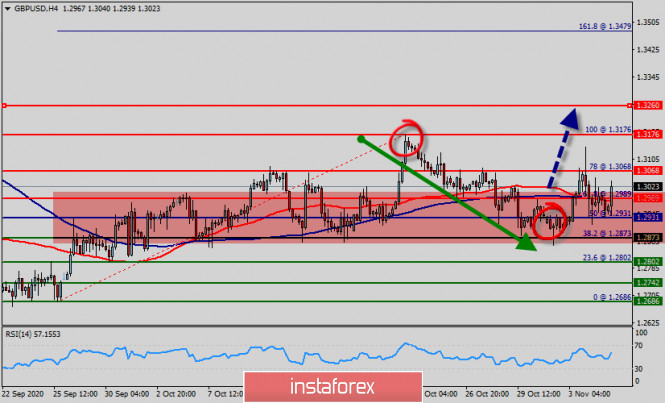 Overview : The GBP/USD pair gained upside momentum and is trying to settle above the key support level at 1.2931. As the GBP currency is gaining ground against a broad basket of currencies. The GBP/USD pair is currently trying to settle above the support at 1.2931. If this attempt is successful, the GBP/USD pair will move towards the recent highs near 1.3068 and 1.3176. The main trend is up according to the daily swing chart. The downtrend turned up when buyers took out the last main top at 1.3068. A trade through 1.3176 will change the main trend top up. On the upside, however, break of 1.3000 will be the first sign that correction from 1.3068 has completed. Intraday bias will be turned back to the upside for 1.3176 for confirmation. Nowadays, the U.S. presidential election will remain the key driver for currency markets today. At this point, it looks like the current President Donald Trump and the Republicans in the Senate have not better chances than previously expected. So, any movement or high volatility will be normal. It should be noted that volatility is very high for that the GBP/USD pair is still trading between 1.2931 and 1.3176 in coming hours. The GBP/USD pair faced strong resistances at the levels of 1.3068 because support had become resistance last week. The strong resistance has been already formed at the level of 1.3068 and the pair is likely to try to approach it in order to test it again. If the pair fails to pass through the level of 1.3068, the market will indicate a bearish opportunity below the new strong resistance level of 1.3176 (the level of 1.3176 coincides with a ratio of 100% Fibonacci). Moreover, the RSI starts signaling an upward trend, as the trend is still showing strength above the moving average (100) and (50). Thus, the market is indicating a bullish opportunity above the area of 1.2931 -1.3000 for that it will be good to buy above this spot with the first target of 1.3068. It will also call for an uptrend in order to continue towards 1.3176. On the other hand, if the GBP/USD pair fails to break through the resistance level of 1.3176 this week, the market will decline further to 1.2931. The pair is expected to drop lower towards at least 1.2931 with a view to test the weekly pivot point. Also, it should be noted that the weekly pivot point will act as minor support today. The daily strong support is seen at 1.2873. However, the stop loss should always be taken into account, for that it will be reasonable to set your stop loss at the level of 1.2850.
Author's today's articles: Stanislav Polyanskiy  Graduated from Odessa State Economic University. On Forex since 2006. Writes analytical reviews about international financial markets for more than 3 years. Worked as a currency analyst in different finance companies for a long time including the biggest companies of Russia and Ukraine. Graduated from Odessa State Economic University. On Forex since 2006. Writes analytical reviews about international financial markets for more than 3 years. Worked as a currency analyst in different finance companies for a long time including the biggest companies of Russia and Ukraine. Maxim Magdalinin  In 2005 graduated from the Academy of the Ministry of Internal Affairs of the Republic of Belarus, law faculty. Worked as a lawyer for three years in one of the biggest country's company. Besides the trading, he develops trading systems, writes articles and analytical reviews. Works at stock and commodity markets explorations. On Forex since 2006. In 2005 graduated from the Academy of the Ministry of Internal Affairs of the Republic of Belarus, law faculty. Worked as a lawyer for three years in one of the biggest country's company. Besides the trading, he develops trading systems, writes articles and analytical reviews. Works at stock and commodity markets explorations. On Forex since 2006. Sergey Belyaev  Born December 1, 1955. In 1993 graduated from Air Force Engineering Academy. In September 1999 started to study Forex markets. Since 2002 has been reading lectures on the technical analysis . Is fond of research work. Created a personal trading system based on the indicator analysis. Authored the book on technical analysis "Calculation of the next candlestick". At present the next book is being prepared for publishing "Indicator Analysis of Forex Market. Trading System Encyclopedia". Has created eleven courses on indicator analysis. Uses classical indicators. Works as a public lecturer. Held numerous seminars and workshops presented at international exhibitions of financial markets industry. Is known as one of the best specialists in the Russian Federation researching indicator analysis. Born December 1, 1955. In 1993 graduated from Air Force Engineering Academy. In September 1999 started to study Forex markets. Since 2002 has been reading lectures on the technical analysis . Is fond of research work. Created a personal trading system based on the indicator analysis. Authored the book on technical analysis "Calculation of the next candlestick". At present the next book is being prepared for publishing "Indicator Analysis of Forex Market. Trading System Encyclopedia". Has created eleven courses on indicator analysis. Uses classical indicators. Works as a public lecturer. Held numerous seminars and workshops presented at international exhibitions of financial markets industry. Is known as one of the best specialists in the Russian Federation researching indicator analysis. Sebastian Seliga  Sebastian Seliga was born on 13th Oсtober 1978 in Poland. He graduated in 2005 with MA in Social Psychology. He has worked for leading financial companies in Poland where he actively traded on NYSE, AMEX and NASDAQ exchanges. Sebastian started Forex trading in 2009 and mastered Elliott Wave Principle approach to the markets by developing and implementing his own trading strategies of Forex analysis. Since 2012, he has been writing analitical reviews based on EWP for blogs and for Forex websites and forums. He has developed several on-line projects devoted to Forex trading and investments. He is interested in slow cooking, stand-up comedy, guitar playing, reading and swimming. "Every battle is won before it is ever fought", Sun Tzu Sebastian Seliga was born on 13th Oсtober 1978 in Poland. He graduated in 2005 with MA in Social Psychology. He has worked for leading financial companies in Poland where he actively traded on NYSE, AMEX and NASDAQ exchanges. Sebastian started Forex trading in 2009 and mastered Elliott Wave Principle approach to the markets by developing and implementing his own trading strategies of Forex analysis. Since 2012, he has been writing analitical reviews based on EWP for blogs and for Forex websites and forums. He has developed several on-line projects devoted to Forex trading and investments. He is interested in slow cooking, stand-up comedy, guitar playing, reading and swimming. "Every battle is won before it is ever fought", Sun Tzu Alexandr Davidov  No data No data Irina Manzenko  Irina Manzenko Irina Manzenko Mihail Makarov  - - Grigory Sokolov  Born 1 January, 1986. In 2008 graduated from Kiev Institute of Business and Technology with "Finance and Credit" as a major. Since 2008 has studied the behavior of various currency pairs and their correlation on Forex. In his works and trading practice he uses candlestick analysis and Fibonacci technique. Since 2009 has written analytical reviews and articles which are published on popular Internet resources. Interests: music, computers and cookery. "Out of five deadly sins of business and as a rule, the most widespread, excessive striving to get profit is the worst". P. Drucker Born 1 January, 1986. In 2008 graduated from Kiev Institute of Business and Technology with "Finance and Credit" as a major. Since 2008 has studied the behavior of various currency pairs and their correlation on Forex. In his works and trading practice he uses candlestick analysis and Fibonacci technique. Since 2009 has written analytical reviews and articles which are published on popular Internet resources. Interests: music, computers and cookery. "Out of five deadly sins of business and as a rule, the most widespread, excessive striving to get profit is the worst". P. Drucker Vyacheslav Ognev  Vyacheslav was born on August 24, 1971. In 1993, he graduated from Urals State University of Economics in the Russian city of Ekaterinburg holding a degree in Commerce and Economics of Trade. In 2007, he started concentrating on the Russian stock market, trading stocks on the RTS Stock Exchange and futures contracts on FORTS. Since 2008 he has been engaged in analyzing Forex market and trading currencies. He is an author of a simplified wave analysis method. He has also developed a trading strategy. At present, Vyacheslav is a co-author of training materials on two web portals dedicated to Forex trading education. Interests: fitness, F1 "Experience is the best of schoolmasters, only the school fees are heavy." - Thomas Carlyle Vyacheslav was born on August 24, 1971. In 1993, he graduated from Urals State University of Economics in the Russian city of Ekaterinburg holding a degree in Commerce and Economics of Trade. In 2007, he started concentrating on the Russian stock market, trading stocks on the RTS Stock Exchange and futures contracts on FORTS. Since 2008 he has been engaged in analyzing Forex market and trading currencies. He is an author of a simplified wave analysis method. He has also developed a trading strategy. At present, Vyacheslav is a co-author of training materials on two web portals dedicated to Forex trading education. Interests: fitness, F1 "Experience is the best of schoolmasters, only the school fees are heavy." - Thomas Carlyle Mourad El Keddani  Was born in Oujda, Morocco. Currently lives in Belgium. In 2003 obtained B.S. in Experimental Sciences. In 2007 obtained a graduate diploma at Institut Marocain Specialise en Informatique Applique (IMSIA), specialty – Software Engineering Analyst. In 2007–2009 worked as teacher of computer services and trainer in a professional school specializing in computer technologies and accounting. In 2005 started Forex trading. Authored articles and analytical reviews on Forex market on Forex websites and forums. Since 2008 performs Forex market research, and develops and implements his own trading strategies of Forex analysis (especially in Forex Research & Analysis, Currency Forecast, and Recommendations and Analysis) that lies in: Numerical analysis: Probabilities, equations and techniques of applying Fibonacci levels. Classical analysis: Breakout strategy and trend indicators. Uses obtained skills to manage traders' accounts since 2009. In April 2009 was certified Financial Technician by the International Federation of Technical Analysts. Winner of several social work awards: Education Literacy and Non-Formal Education (in Literacy and Adult Education in The National Initiative for Human Development). Was born in Oujda, Morocco. Currently lives in Belgium. In 2003 obtained B.S. in Experimental Sciences. In 2007 obtained a graduate diploma at Institut Marocain Specialise en Informatique Applique (IMSIA), specialty – Software Engineering Analyst. In 2007–2009 worked as teacher of computer services and trainer in a professional school specializing in computer technologies and accounting. In 2005 started Forex trading. Authored articles and analytical reviews on Forex market on Forex websites and forums. Since 2008 performs Forex market research, and develops and implements his own trading strategies of Forex analysis (especially in Forex Research & Analysis, Currency Forecast, and Recommendations and Analysis) that lies in: Numerical analysis: Probabilities, equations and techniques of applying Fibonacci levels. Classical analysis: Breakout strategy and trend indicators. Uses obtained skills to manage traders' accounts since 2009. In April 2009 was certified Financial Technician by the International Federation of Technical Analysts. Winner of several social work awards: Education Literacy and Non-Formal Education (in Literacy and Adult Education in The National Initiative for Human Development).
Languages: Arabic, English, French and Dutch.
Interests: Algorithm, Graphics, Social work, Psychology and Philosophy.
Subscription's options management Theme's:
Fundamental analysis, Fractal analysis, Wave analysis, Technical analysis, Stock Markets
Author's :
A Zotova, Aleksey Almazov, Alexander Dneprovskiy, Alexandr Davidov, Alexandros Yfantis, Andrey Shevchenko, Arief Makmur, Dean Leo, Evgeny Klimov, Fedor Pavlov, Grigory Sokolov, I Belozerov, Igor Kovalyov, Irina Manzenko, Ivan Aleksandrov, l Kolesnikova, Maxim Magdalinin, Mihail Makarov, Mohamed Samy, Mourad El Keddani, Oleg Khmelevskiy, Oscar Ton, Pavel Vlasov, Petar Jacimovic, R Agafonov, S Doronina, Sebastian Seliga, Sergey Belyaev, Sergey Mityukov, Stanislav Polyanskiy, T Strelkova, Torben Melsted, V Isakov, Viktor Vasilevsky, Vladislav Tukhmenev, Vyacheslav Ognev, Yuriy Zaycev, Zhizhko Nadezhda
Edit data of subscription settings
Unsubscribe from the mailing list Sincerely,
Analysts Service | If you have any questions, you can make a phone call using one of the
InstaForex Toll free numbers right now:
|  | InstaForex Group is an international brand providing online trading services to the clients all over the world. InstaForex Group members include regulated companies in Europe, Russia and British Virgin Islands. This letter may contain personal information for access to your InstaForex trading account, so for the purpose of safety it is recommended to delete this data from the history. If you have received this letter by mistake, please contact InstaForex Customer Relations Department. |


No comments:
Post a Comment