| Elliott wave analysis of GBP/JPY for November 30, 2020 2020-11-30 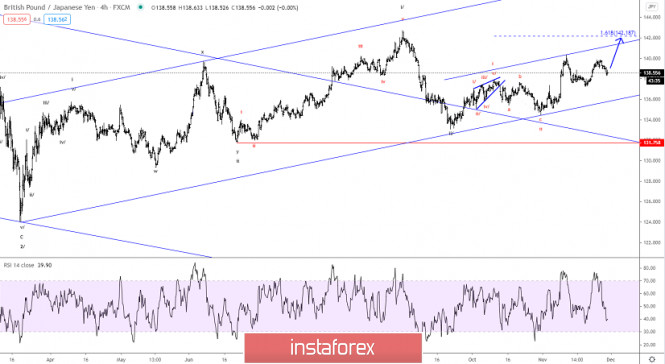
GBP/JPY has corrected to a low of 138.30 which is more than enough to set GBP/JPY up for the next push higher towards 139.84 and 140.32 on the way higher to the former peak at 142.72 and ultimately above here too. A break above minor resistance at 138.88 will confirm the completion of the minor correction from 139.84 and a new impulsive rally being in motion. Support is now seen at 138.30 and then at 138.00. R3: 139.84 R2: 139.28 R1: 138.88 Pivot: 138.63 S1: 138.30 S2: 138.00 S3: 137.54 Trading recommendation: We are long GBP with an average of 138.35 and we have our stop placed at 137.95 EUR/USD: plan for the European session on November 30. COT reports. Euro buyers too optimistic. Bears focused on returning to 1.1964 2020-11-30 To open long positions on EUR/USD, you need: 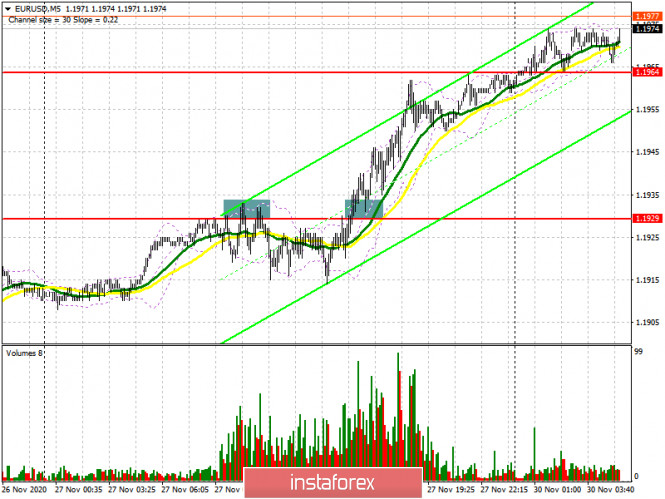
The euro's huge growth from last Friday can hardly be tied to something specific, since important fundamental statistics were not released and it was hardly possible to expect such optimism from the market. Nevertheless, selling after a false breakout at 1.1929 in the morning did not materialize to the extent that I expected. For my 5-minute forecast last Friday afternoon, I marked the short entry point after the bulls failed to go above 1.1929. However, the pair hit the 1.1915 level each time and returned to 1.1929. The bulls have already taken this range towards the middle of the US session, testing it from top to bottom, which led to producing an entry point into long positions. By the end of the day, buyers of the euro reached the resistance of 1.1964, and the movement was more than 35 points. The bulls managed to reach the 1.1964 level in today's Asian session. We can expect the euro to continue rising as long as trading is above this range. Forming a false breakout at the 1.1964 level in the first half of the day will be an additional signal to open long positions. However, I have to reiterate that there is no real reason for the euro to grow in the short term and the market is filled with speculators whose main goal is to pull the euro to the resistance of 1.2008, which will trigger a number of stop orders. I recommend taking profits around 1.2008, because if we do not receive good news, for example, on the Brexit trade deal, one can hardly count on a real breakout of this area, slightly above which is where the 1.2057 level is located. If the euro is under pressure in the first half of the day, and the bears pull the pair under the 1.1964 level, then you should not rush to open long positions. The optimal scenario would be to wait until support at 1.1929 has been tested, where the moving averages play on the side of the bulls, and open long positions there for a rebound, counting on a correction of 15-20 points within the day. Larger buyers will focus on protecting the 1.1855 support. To open short positions on EUR/USD, you need: 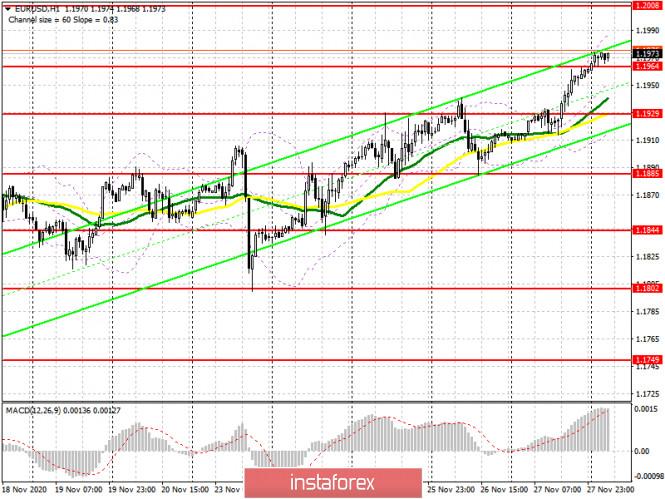
The sellers' initial task is to return the 1.1964 level to themselves, which they missed in today's Asian session. Despite all the negative data on the European economy, traders are in no hurry to sell the euro, hoping for the best. Getting the pair to settle below 1.1964 and testing it from the reverse side, from the bottom up, provides a more convenient entry point to short positions in hopes for a small downward correction to the support area at 1.1929, which is where the moving averages pass. However, updating this level will clearly not be enough to bring back the bear market. To be able to settle below 1.1929 will lead to a larger sale of the euro to the support area at 1.1885, where I recommend taking profits. If the bulls turn out to be stronger and continue to push the pair up after the inflation data from Germany and Italy, then it is best not to rush to sell, but wait until the high in the resistance area of 1.2008 has been updated, where you can open short positions immediately on a rebound. If bulls are not active at this level, and given how the market behaves, this cannot be ruled out, I recommend opening short positions immediately for a rebound, counting on a correction of 15-20 points within the day, I recommend doing so only from a high of 1.2057. The Commitment of Traders (COT) report for November 17 showed an increase in long and short positions. Long non-commercial positions rose from 202,374 to 203,551, while short non-commercial positions increased from 67,087 to 69,591. The total non-commercial net position fell from 135,287 to 133,960 a week earlier. Take note that the delta has been declining for eight consecutive weeks, which confirms the euro buyers' reluctance to enter the market in the current conditions. We can talk about the euro's recovery only when European leaders have settled differences with Poland and Hungary, and also when the UK negotiates a new trade deal with Brussels. Otherwise, you will have to wait until restrictive measures have been lifted, which were implemented due to the second wave of coronavirus in many EU countries. Indicator signals: Moving averages Trading is carried out above 30 and 50 moving averages, which indicates continued growth in the euro in the short term. Note: The period and prices of moving averages are considered by the author on the H1 hourly chart and differs from the general definition of the classic daily moving averages on the daily D1 chart. Bollinger Bands A breakout of the upper border of the indicator around 1.1985 will lead to a new wave of euro growth. In case the pair falls, support will be provided by the lower border at 1.1915. Description of indicators - Moving average (moving average, determines the current trend by smoothing out volatility and noise). Period 50. It is marked in yellow on the chart.
- Moving average (moving average, determines the current trend by smoothing out volatility and noise). Period 30. It is marked in green on the chart.
- MACD indicator (Moving Average Convergence/Divergence — convergence/divergence of moving averages) Quick EMA period 12. Slow EMA period to 26. SMA period 9
- Bollinger Bands (Bollinger Bands). Period 20
- Non-commercial speculative traders, such as individual traders, hedge funds, and large institutions that use the futures market for speculative purposes and meet certain requirements.
- Long non-commercial positions represent the total long open position of non-commercial traders.
- Short non-commercial positions represent the total short open position of non-commercial traders.
- Total non-commercial net position is the difference between short and long positions of non-commercial traders.
GBP/USD: plan for the European session on November 30. COT reports. Pound volatility to rise this week as trade talks enter final few days 2020-11-30 To open long positions on GBP/USD, you need: Last Friday we saw an excellent way to sell the British pound after breaking support at 1.3348. If you look at the chart, you will see how the bears achieved a real breakout of the 1.3348 level and even if you did not have time to enter short positions from it after the first breakout, the correction and this level being tested from the bottom up (as it should be) resulted in producing an excellent entry point to sell, which formed another wave of GBP/USD decline towards the end of the day and also brought traders around 50 points in profit. 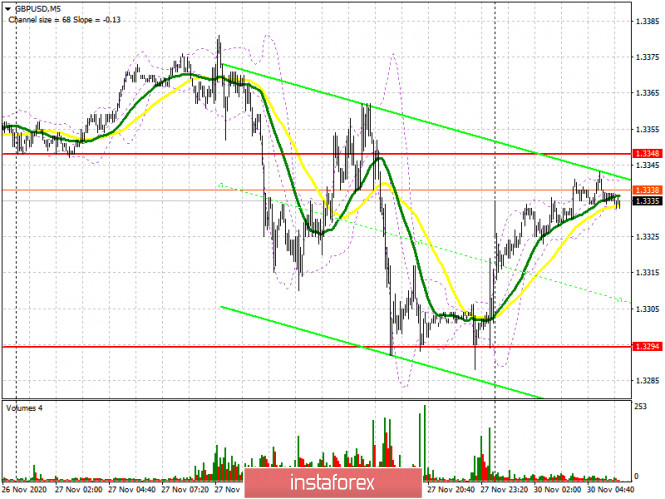
We are unlikely to be pleased with any news regarding Brexit at the beginning of the week, although there were rumors at the end of last week that negotiators might meet over the weekend in London. Given the intensity of the talks and the fact that the dates are coming to an end, the pound is expected to be quite volatile. Bulls need to regain resistance at 1.3348, getting the pair to settle at this level and testing it from top to bottom produces a fairly good signal for buying GBP/USD in order for it to rise to the 1.3395 area, which also acts as the upper border of the horizontal channel and is also where the pound stayed for the entirety of last week. A breakout and being able to settle above this range, along with good news on Brexit, will lead to a new wave of growth in the pound towards highs of 1.3453 and 1.3509, where I recommend taking profits. In case the pound falls in the first half of the day, the bulls will try to protect support at 1.3294 again, but there is little hope for this level. Forming a false breakout there provides a signal to open long positions. If it is not active in this range, it is best to postpone buy positions until a new low near 1.3294 has been updated, or buy GBP/USD immediately after rebounding from the 1.3194 low, counting on an upward correction of 20-30 points within the day. To open short positions on GBP/USD, you need: Pound sellers need to defend resistance at 1.3348. Forming a false breakout on it will be the first signal to continue the downward momentum that appeared at the end of last week. A smooth reversal of the pound since November 24 also indicates the fact that bears are weighing on the pair each time, preventing it from updating local highs, which indicates their advantage over buyers. In case of a false breakout at 1.3348, the initial goal is to return support at 1.3294, settling below it will lead to a fairly quick sell-off of GBP/USD in the area of the 1.3251 low, while the bears' next target will be support at 1.3194. In case bears are not active in the middle of the 1.3348 channel, it is best to postpone selling until the test of its upper border at 1.3395. However, the next update of this level will be very dangerous for the current downward trend, therefore, you can only sell from there on the first test, immediately for a rebound, counting on a correction of 20-25 points within the day. Larger sales can be made only after the 1.3453 high has been updated. 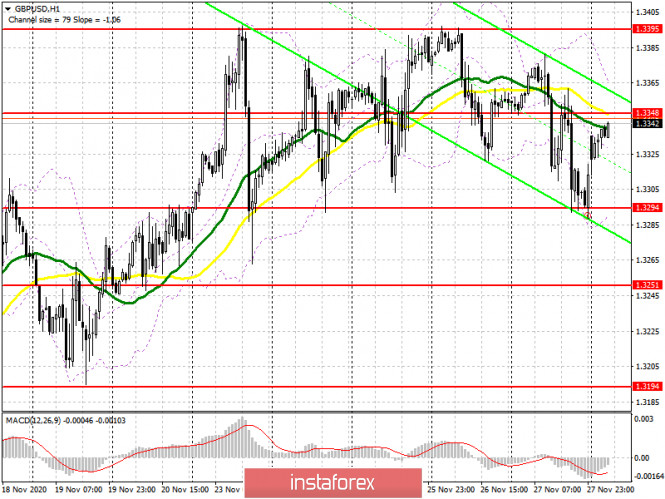
The Commitment of Traders (COT) reports for November 17 saw a reduction in long positions and a sharp inflow of short positions. Long non-commercial positions declined from 27,872 to 27,454. At the same time, short non-commercial positions increased from 45,567 to 47,200. As a result, the negative non-commercial net position was -19,746 against -17,695 a week earlier, which indicates that the sellers of the British pound retains control and also shows their slight advantage in the current situation. Lack of clarity on the trade deal, together with the lockdown of the British economy in November, clearly does not add optimism and confidence to buyers of the pound. Indicator signals: Moving averages Trading is carried out in the area of 30 and 50 moving averages, which indicates uncertainty regarding the pound's succeeding direction. Note: The period and prices of moving averages are considered by the author on the H1 hourly chart and differs from the general definition of the classic daily moving averages on the daily D1 chart. Bollinger Bands A breakout of the upper border of the indicator around 1.3355 will lead to a new wave of growth for the pound. A breakout of the lower border of the indicator in the 1.3294 area will increase the pressure on the pair. Description of indicators - Moving average (moving average, determines the current trend by smoothing out volatility and noise). Period 50. It is marked in yellow on the chart.
- Moving average (moving average, determines the current trend by smoothing out volatility and noise). Period 30. It is marked in green on the chart.
- MACD indicator (Moving Average Convergence/Divergence — convergence/divergence of moving averages) Quick EMA period 12. Slow EMA period to 26. SMA period 9
- Bollinger Bands (Bollinger Bands). Period 20
- Non-commercial speculative traders, such as individual traders, hedge funds, and large institutions that use the futures market for speculative purposes and meet certain requirements.
- Long non-commercial positions represent the total long open position of non-commercial traders.
- Non-commercial short positions represent the total short open position of non-commercial traders.
- Total non-commercial net position is the difference between short and long positions of non-commercial traders.
Indicator analysis. Daily review of EUR/USD on November 30, 2020 2020-11-30 After its rebound at the support level 1.1909 (blue bold line), the pair traded upward on Friday, closing above 1.1951 - an 85.4% pullback level (blue dashed line). Today, the price may continue to move up. As per the economic calendar, dollar news is expected at 15:00 UTC. Trend analysis (Fig. 1). The market may continue to move upward from the level of 1.1962 (closing of Friday's daily candlestick) with the first target at the upper fractal 1.2010 (blue dotted line). In case of testing this line, there is a possibility of the continuation of the upward trend. 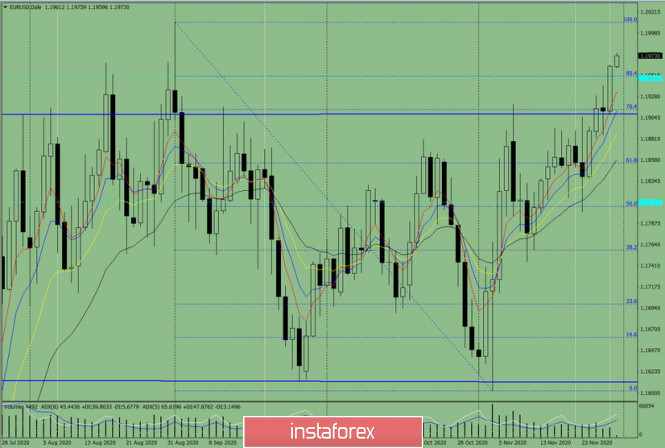
Figure: 1 (daily chart). Comprehensive analysis: - Indicator analysis - up; - Fibonacci levels - up; - Volumes - up; - Candlestick analysis - down; - Trend analysis - up; - Bollinger lines - up; - Weekly chart - up. General conclusion: Today, the price may move upwards with the target at the upper fractal 1.2010 (blue dotted line). In case of testing this line, there is a possibility of the continuation of the upward trend. Another possible scenario: from the level of 1.1963 (closing of Friday's daily candlestick), the price may move downwards with the target at the historical support level 1.1948 (blue dotted line). In case of testing this line, the price may move upwards with the target at the upper fractal 1.2010 (blue dotted line). EUR/USD: US dollar's downward trend acts as euro's jump-off point 2020-11-30  It's been very tough for the US currency in the last few months and it is struggling to recover from a series of shocks caused by a number of factors. Experts expect the indicated currency to slowly recover, however, they are worried that this process may be delayed. The dynamics of the US dollar is negatively influenced by factors such as COVID-19 together with its economic consequences, US presidential elections, as well as Fed's current monetary policy, aimed at actively printing money. Investors' increased risk appetite, which was the strongest in the last two years, is another factor that caused the US dollar to decline. Currency strategists at Barclays Bank say that this currency will continue to be under pressure in the short term due to investor risk appetite amid hopes for effective vaccines. Nevertheless, they also stated that it is possible that the USD will strengthen and reach new levels in the medium term. In turn, euro's growth provokes the situation in the EUR/USD pair. Last Friday, the single currency began to strengthen its positions, which continues to this day. Commerzbank analysts are sure that the euro will rise to the level of 1.2400 next month and further to 1.2500 in 2021. Currently, the indicated currency is moving towards its target, not paying attention to temporary failures. Today, the EUR/USD pair was trading near the range of 1.1969-1.1970, heading towards the intermediate level of 1.2000. Experts believe that breaking through this level will lead to new peaks. 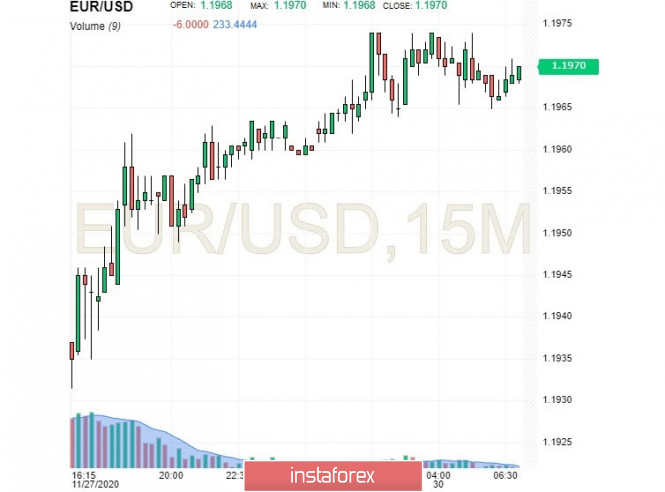 On another note, Commerzbank's currency strategists believe that ECB's monetary policy, particularly the possibility of reducing the interest rate next year, may limit euro's growth. Its further dynamics will be negatively affected by the withdrawal of dollar liquidity from the financial system. However, investors and traders are hopeful that the ECB will not make sudden movements and drastically change its current policy before this year ends. Markets expect the regulator to expand the concessional lending program for banks (TLTRO), but this will not be definite for the euro. Analysts say that the euro usually reacts to such serious incentives as a change in the deposit rate or an asset purchase program, so now there is a slight change in its dynamics. The market is relying on the continuation of the upward trend of the EUR/USD pair this week and these expectations will most likely be reached. Experts believe that the Eurocurrency in the EUR/USD pair is trying to take the lead, whose efforts pay off often. However, the US currency is not satisfied with being a jump-off point in the classic pair, so it tries to recover its position. And although its growth attempts sometimes don't end up successfully, it is actively gaining momentum. Therefore, many analysts are positive that the USD will reach what it wants in the incoming year. Technical Analysis of GBP/USD for November 30, 2020 2020-11-30 Technical Market Outlook: The GPB/USD pair keeps trading inside of the ascending channel after the rally has been capped at the level of 1.3395. The Pin Bar candlestick occurred on H4 time frame at the level of 1.3289 is still a valid indication of a bounce higher, so the market might test the level of 1.3395 again. The next target for bulls is still seen at the level of 1.3447(swing high) and then at 1.3512. The nearest technical support is located at 1.3306, 1.3295 and 1.3264. The strong and positive momentum supports the short-term bullish outlook. Weekly Pivot Points: WR3 - 1.3523 WR2 - 1.3460 WR1 - 1.3387 Weekly Pivot - 1.3326 WS1 - 1.3255 WS2 - 1.3195 WS3 - 1.3124 Trading Recommendations: The GBP/USD pair is in the down trend on the monthly time frame, but the recent bounce from the low at 1.1411 made in the middle of March 2020 looks very strong and might be a reversal swing. In order to confirm the trend change, the bulls have to break through the technical resistance seen at the level of 1.3518. All the local corrections should be used to enter a buy orders as long as the level of 1.2674 is not broken. 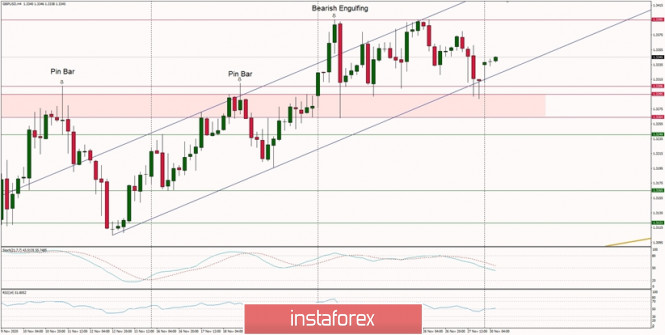
Technical Analysis of EUR/USD for November 30, 2020 2020-11-30 Technical Market Outlook: Another higher high was made on the EUR/USD pair after the market had broken out of the main ascending channel. The new high is located at the level of 1.1976 and the next target for bulls is seen at the level of 1.2000. The nearest technical support is located at 1.1914, 1.1908 and 1.1949. The strong and positive momentum supports the short-term bullish outlook. The monthly candle is green and look very bullish, so the market participants should wait for another wave up next month. Weekly Pivot Points: WR3 - 1.2206 WR2 - 1.2083 WR1 - 1.2043 Weekly Pivot - 1.1921 WS1 - 1.1871 WS2 - 1.1758 WS3 - 1.1714 Trading Recommendations: Since the middle of March 2020 the main trend is on EUR/USD pair has been up, which can be confirmed by almost 10 weekly up candles on the weekly time frame chart and 4 monthly up candles on the monthly time frame chart. The recent correction towards the level of 1.1612 seems to be completed and now market is ready for another wave up. This means any local corrections should be used to buy the dips until the key technical support is broken. The key long-term technical support is seen at the level of 1.1445. The key long-term technical resistance is seen at the level of 1.2555. 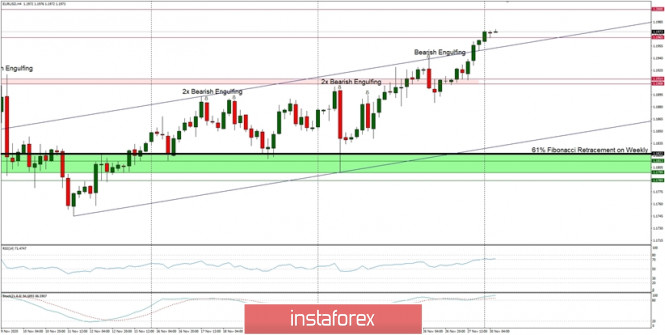
Indicator analysis. Daily review of GBP/USD on November 30, 2020 2020-11-30 On Friday, the pair continued to trade downward from the resistance level (red bold line), testing the pullback level of 14.6% (blue dotted line). Today, the price may begin to move up. As per the economic calendar, dollar news is expected at 15:00 UTC. Trend analysis (Fig. 1). The market may move upward from the level of 1.3313 (closing of Friday's daily candlestick) with the target at the resistance level 1.3394 (black bold line). Upon testing this level, the upward trend may continue with the next target at the upper fractal 1.3481 (daily candle from 01/09/2020) red dotted line. 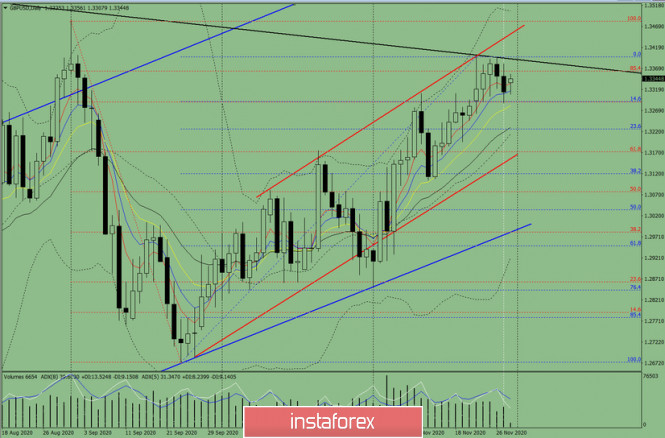
Figure: 1 (daily chart). Comprehensive analysis: - Indicator analysis - up; - Fibonacci levels - up; - Volumes - up; - Candlestick analysis - down; - Trend analysis - up; - Bollinger lines - up; - Weekly chart - up. General conclusion: Today, the price may continue to move upward with the target at the resistance level 1.3394 (black thick line). Upon testing this level, the upward trend may continue with the next target at the upper fractal 1.3481 (daily candle from 09/01/2020) presented in a red dotted line. Another possible scenario: from the level of 1.3313 (closing of Friday's daily candlestick), the price may continue to move down with the target at 1.3226 - a 23.6% pullback level (blue dashed line). The upward trend may continue upon testing this level. AUD/USD. December RBA meeting: preview 2020-11-30 First trading day of the week and the last day of November: the US dollar index fell in today's Asian session, updating multi-month lows. Low demand for the greenback is inertial: the greenback noticeably lost ground on Friday against the background of the strengthening of the stock market and the general interest in risk. The situation did not change on Monday: investors still prefer risky assets, while the dollar cannot find a foothold. This fundamental background made it possible for buyers of the AUD/USD pair to test the 74th figure: the aussie crossed the 0.7400 mark for the first time in three months. Traders failed to gain a foothold in this price area, so this can be considered as "reconnaissance in force". In the medium term, the fate of the growth trend will depend on two factors. First of all, we are talking about the level of demand for the US currency. If the greenback continues to fall in the entire market, then the Australian dollar can prove itself - if, in turn, the members of the Reserve Bank of Australia allow it. Tomorrow we will find out the results of the RBA's final meeting for this year: the next meeting of the central bank's members will take place in February. 
Traders are quite optimistic judging by the dynamics of AUD/USD. In anticipation of the December meeting, the aussie is growing in cross-pairs (for example, against the loonie or the kiwi). Most analysts share the optimism of investors - in their opinion, the central bank will take a "restrained-optimistic" position tomorrow, keeping all the parameters of monetary policy in the same form. This is facilitated by many factors - from the dynamics of economic indicators to the coronavirus situation in the country. Key macroeconomic reports did not disappoint, at least. For example, Australian inflation, despite the coronavirus restrictions, still did not disappoint: the main indicators came out either at the level of forecasts, or exceeded the forecast values. The general consumer price index rose to 1.6% in quarterly terms (the forecast was slightly lower - 1.5%). On an annualized basis, the indicator came out of the negative area and reached 0.7% (fully in line with forecasts). The core inflation index did not disappoint either - the components as a whole came out in line with the general expectations. But the labor market turned out to be an unexpected ally of the Australian currency. The growth rate of the number of employed jumped in October, reaching 178,000 (against the forecast of a decline of 29,000). This is the strongest growth rate since June this year, when Australia began to pull out of the lockdown. This result allows us to count on optimistic assessments from the RBA's members. Also in favor of the aussie's growth is the fact that the authorities of the state of South Australia decided to prematurely remove the strict restrictive measures that were introduced there due to the outbreak of the coronavirus. In general, the states and territories of Australia are now lifting almost all quarantine restrictions: there are almost no new cases of Covid-19 infection in the country. It is worth noting that some analysts still entertain the possibility that the RBA may announce monetary policy easing tomorrow, while allowing the interest rate to fall into negative territory. In my opinion, these assumptions are unfounded. Firstly, the above-mentioned macroeconomic releases and representatives of the central bank themselves, in particular, Guy Debelle, who said that he doubted the effectiveness of negative rates as a tool for accelerating inflation and employment, speak in favor of maintaining a wait-and-see attitude. Secondly, it is worth recalling the rhetoric of the minutes of the last RBA meeting, in which the central bank rather positively assessed the prospects for the growth of the national economy and assured the market that it was not going to reduce the interest rate to the negative area. 
Most likely, the results of tomorrow's RBA meeting will be optimistic and neutral. The central bank may allow easing of monetary policy, but this warning will only be in the form of a standard phrase in an accompanying statement (that the central bank will maintain its current policy and, if necessary, expand the bond purchase program). Such a wording is unlikely to frighten investors, especially given the growth of key indicators. Therefore, with a high degree of probability, the aussie will continue to rise against the greenback tomorrow. From a technical point of view, the situation is as follows. The pair is between the middle and upper lines of the Bollinger Bands indicator on all of the higher timeframes (from H4 and up), which indicates the priority of growth. On timeframes from H4 to W1 (that is, except for the monthly chart), the Ichimoku indicator formed a bullish Parade of Lines signal when the price is above all the indicator lines, including the Kumo cloud. This signal indicates bullish sentiment. The strongest resistance is at 0.7450, the upper monthly Bollinger Bands line, which coincides with the lower border of the Kumo cloud. But first, AUD/USD buyers need to gain a foothold in the 74th figure - the results of today's Asian session showed us that the pair meets resistance when it breaks the 0.7400 mark. In my opinion, the aussie will not only enter this price area in the medium term, but also cross the 0.7450 price barrier. Therefore, you can open longs either from current positions, or following the results of tomorrow's RBA meeting. GBP/USD. November 30. COT report. The British pound is holding near annual highs. Traders expect a strong fall, especially if there is no deal 2020-11-30 GBP/USD – 1H. 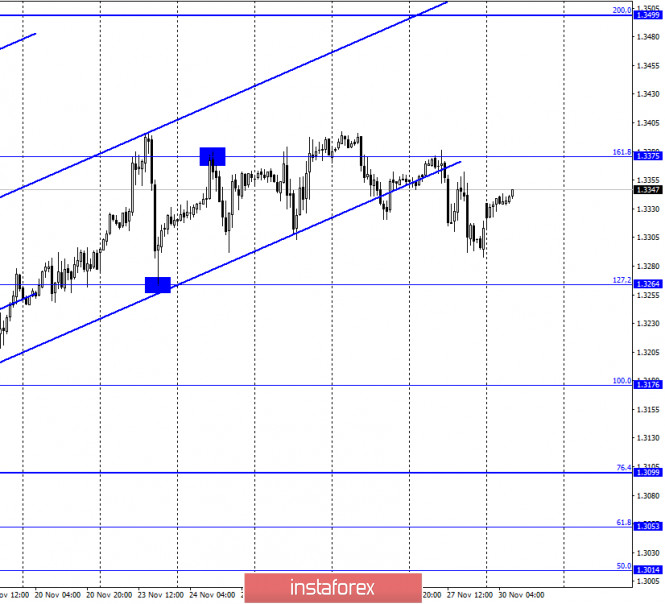
According to the hourly chart, the quotes of the GBP/USD pair performed another reversal in favor of the US currency and consolidated under another upward trend corridor. Prior to this, the British dollar quotes have already been fixed under the trend lines and corridors several times, however, the mood of traders did not change to "bearish". Now we see approximately the same picture. The pair's quotes have already made a reversal in favor of the British dollar and again began the process of growth in the direction of the Fibo level of 161.8% (1.3375). Very chaotic movements that have nothing to do with the current information background. And the information background for the British does not change. Almost no news is coming from America right now. And from the UK, there is an endless stream of messages about the resumption or continuation of trade negotiations. There are no reports that the parties are approaching a deal, or that there is progress on the "fishing issue". On the contrary, both Brussels and London regularly state that they are ready for a no-deal Brexit and will not conclude an agreement at any cost. However, the talks are continuing, although Boris Johnson has repeatedly stated that November 15 is the deadline for completing the negotiations. It is very difficult to understand how long the negotiations will last. GBP/USD – 4H. 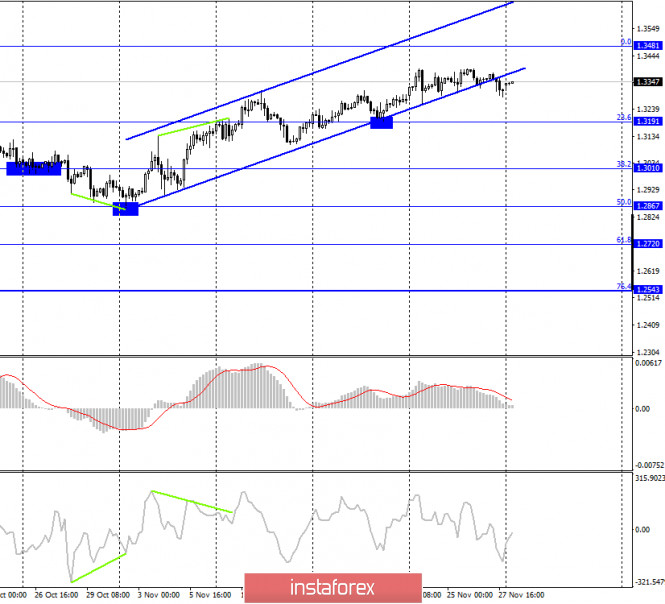
On the 4-hour chart, the GBP/USD pair performed a consolidation under the ascending corridor, as well as on the hourly chart. Thus, the mood of traders should have changed to "bearish" and the pair's quotes began to fall. However, we don't see anything like this yet. Moreover, a bullish divergence is brewing in the CCI indicator, which may allow the pair to perform a reversal in favor of the British and resume the growth process in the direction of the corrective level of 0.0% (1.3481). GBP/USD – Daily. 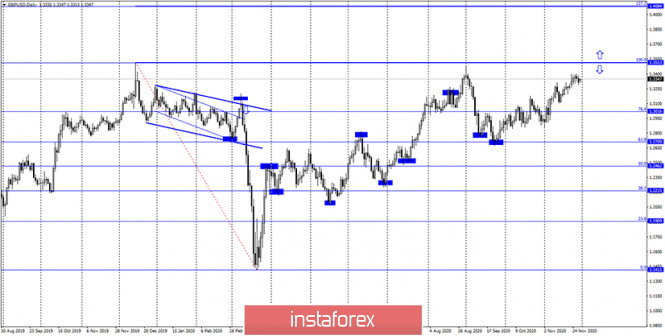
On the daily chart, the pair's quotes continue to grow in the direction of the corrective level of 100.0% (1.3513). However, when trading a pair, I recommend paying more attention to the lower charts. They are now more informative. Especially important are the two corridors that the quotes have already left. GBP/USD – Weekly. 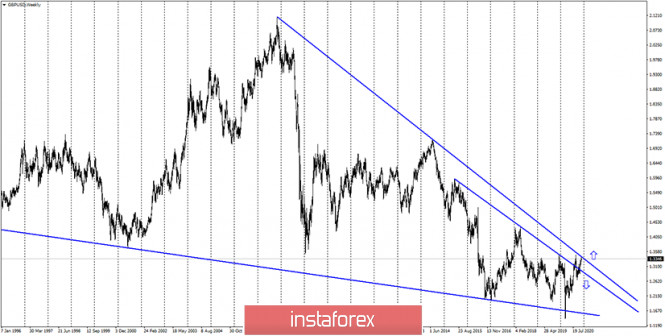
On the weekly chart, the pound/dollar pair performed an increase to the second downward trend line. A rebound from it in the long term will mean a reversal in favor of the US dollar and a long fall in the British dollar's quotes. Overview of fundamentals: There were no reports or major events in the UK and US on Friday. The information background on this day was practically absent. News calendar for the United States and the United Kingdom: On November 30, in America and the United Kingdom, the news calendars are empty again. Today, the information background will be absent, however, there may be news on the negotiation process between London and Brussels, which traders are waiting for. COT (Commitments of Traders) report: 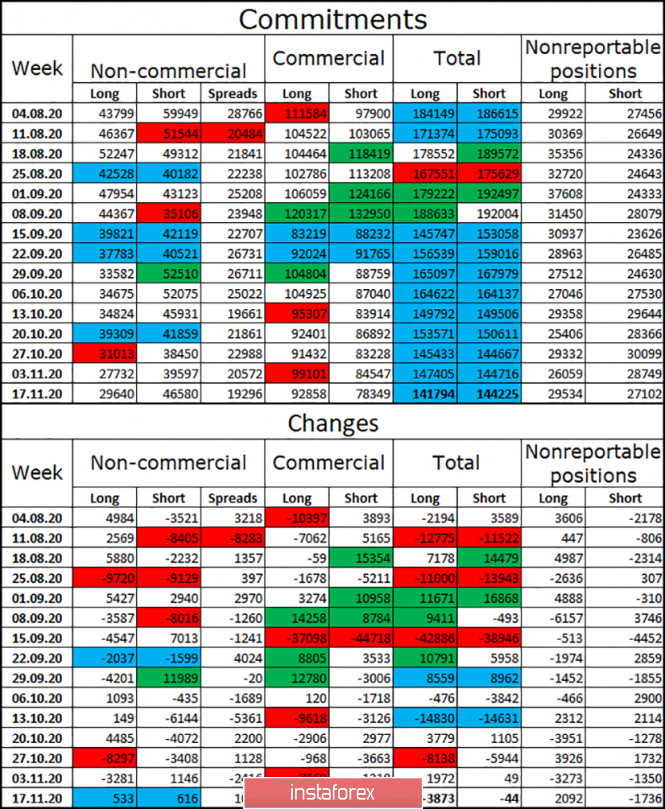
The last two COT reports showed a fairly sharp increase in the number of open short contracts for the "Non-commercial" category of traders. This suggests that speculators continue to believe in the fall of the British dollar in the very near future. Over the past three weeks, speculators have been building up short contracts and closing long ones. In general, major players are more afraid of opening new contracts, so their total number is falling. This is seen in the table above. Thus, conclusion number one: major players are afraid of the uncertainty associated with the trade deal and the British economy, so they do not want to trade the pound more actively. Conclusion number two: speculators believe more in the fall of the pound than in its growth. GBP/USD forecast and recommendations for traders: Today, I recommend selling the GBP/USD pair with a target of 1.3264, as previously it was closed under the ascending corridor on the 4-hour chart and under the ascending corridor on the hourly chart. I recommend to be careful with the pair's purchases now, as the COT report shows the faith of major players in the fall of the pound, and there is still no trade deal between London and Brussels. Terms: "Non-commercial" - major market players: banks, hedge funds, investment funds, private, large investors. "Commercial" - commercial enterprises, firms, banks, corporations, companies that buy currency not for speculative profit, but for current activities or export-import operations. "Non-reportable positions" - small traders who do not have a significant impact on the price. EUR/USD. November 30. COT report. The problems of the European Union do not concern traders at all 2020-11-30 EUR/USD – 1H. 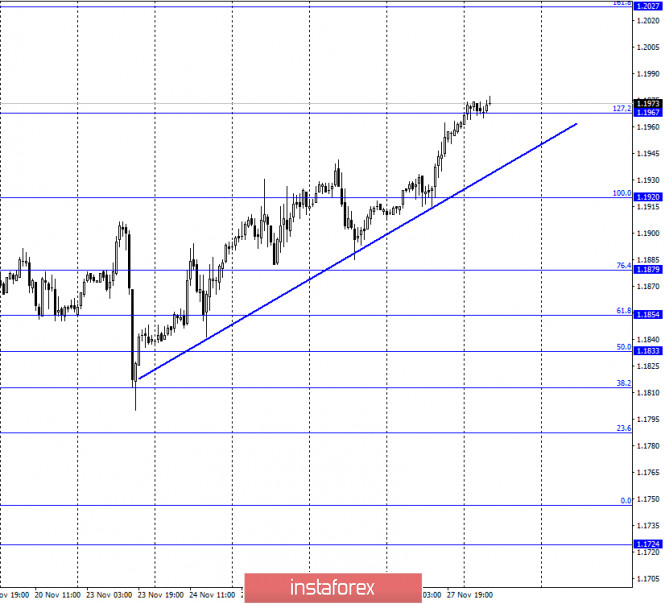
On November 27, the EUR/USD pair continued the growth process and eventually consolidated above the corrective level of 127.2% (1.1967). Thus, the growth process can now be continued even higher, in the direction of the corrective level of 161.8% (1.2027). The upward trend line continues to characterize the current mood of traders as "bullish". Fixing quotes below it will work in favor of the US currency and some fall in the direction of the levels of 100.0% (1.1920) and 76.4% (1.1879). The closer the markets get to the New Year, the more opinions appear that the European currency is heavily overbought and generally has no special reason to grow against the US dollar. Even when the information background is empty, any currency can grow by 150-200 points. This is the usual market noise. However, the euro currency has been growing for more than six months without major corrections. Meanwhile, there are a lot of problems in the Eurozone. For example, the EU budget for 2021-2027 is currently blocked by Poland and Hungary, which do not approve of the new rule of law principle, which allows the European Commission to reduce funding for countries that do not comply with this principle. Simply put, the EU is insisting on full democracy within each country of the EU. And in Poland and Hungary, there are suspicions that local ruling parties are trying to establish control over the media and courts, as well as do not support migration policies and infringe on the rights of sexual minorities. However, Poland and Hungary will not voluntarily withdraw funding, especially in the face of a pandemic, so they vetoed the adoption of the new principle, the recovery fund, and the budget. EUR/USD – 4H. 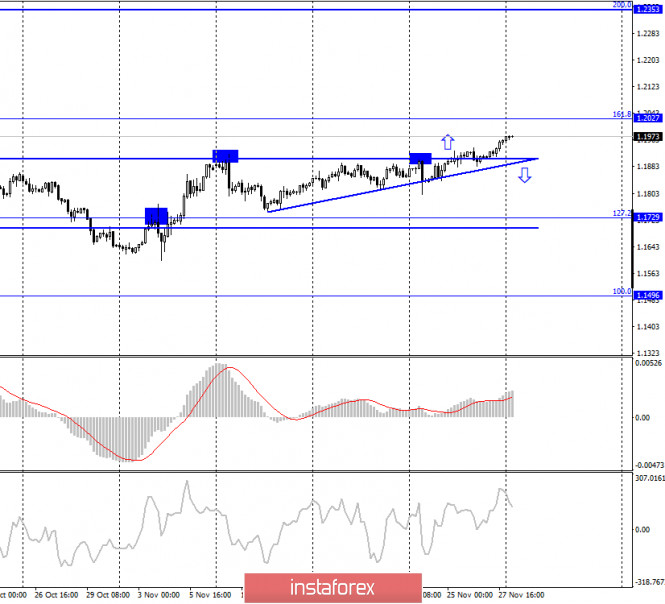
On the 4-hour chart, the pair's quotes have consolidated above the upper border of the side corridor and also continue the growth process in the direction of the corrective level of 161.8% (1.2027). A rebound of the pair's rate from this level will work in favor of the US currency and some fall, and a close above it will work in favor of further growth towards the next corrective level of 200.0% (1.2353). EUR/USD – Daily. 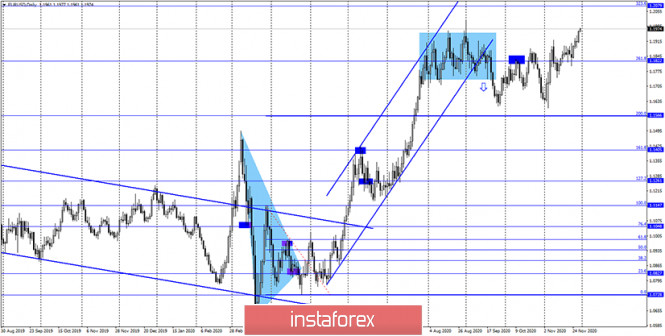
On the daily chart, the quotes of the EUR/USD pair continue to grow in the direction of the corrective level of 323.6% (1.2079). However, more attention should now be paid to the lower charts. EUR/USD – Weekly. 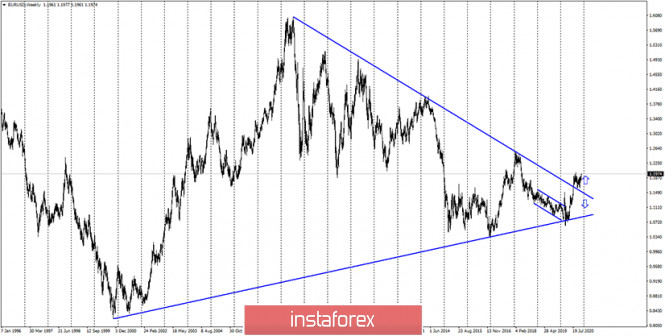
On the weekly chart, the EUR/USD pair performed a consolidation above the "narrowing triangle", which preserves the prospects for further growth of the pair, but in the long term. Overview of fundamentals: On November 27, there were no economic reports in America and the European Union. Thus, the information background was extremely weak, which did not prevent traders from actively buying euros. The news calendar for the United States and the European Union: EU - ECB President Christine Lagarde will make a speech (10:30 GMT). On November 30, in America, the calendar of economic events is empty again. The European Union will host a speech by Christine Lagarde, who can tell traders something new. COT (Commitments of Traders) report: 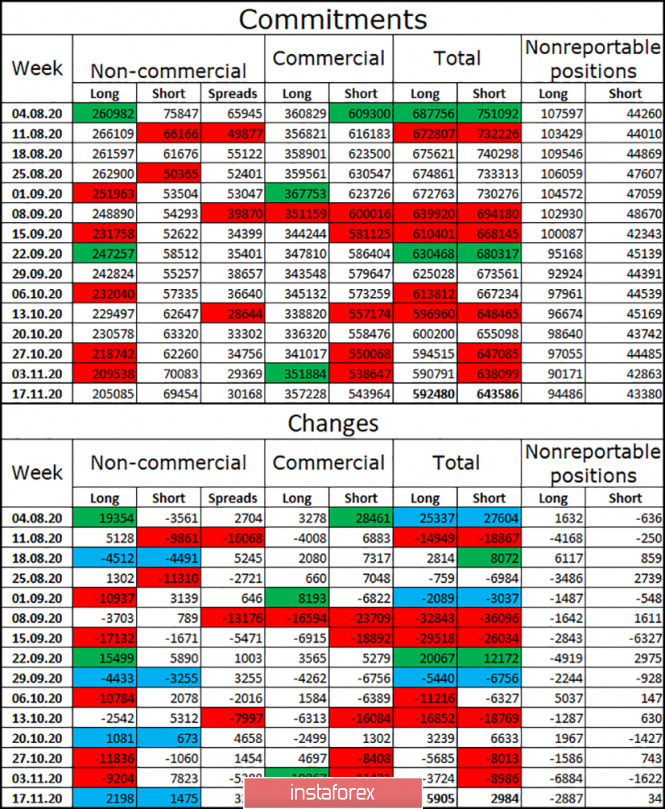
There are almost no changes in the latest COT report, and the new report has not yet been released. Over the last two reporting weeks, the number of long contracts in the hands of the "Non-commercial" category of traders decreased by 4.5 thousand, and the number of short contracts - by 0.5 thousand. During the last reporting week, speculators opened approximately the same number of long and short contracts. Thus, in general, the changes are insignificant. The mood of speculators became a little more "bearish", but again slightly. There are even fewer changes in other categories of traders. The most important thing I would like to note is that the mood of major players is not becoming more "bullish", which means that the COT report does not indicate a resumption of the upward trend now. The euro currency has been growing in recent weeks, however, we need to see what the new report shows. Forecast for EUR/USD and recommendations for traders: Today, I recommend selling the euro currency with targets of 1.1920 and 1.1879, if it is fixed under the trend line on the hourly chart. Purchases of the pair can be opened after rebounding from the trend line on the hourly chart with a target near the Fibo level of 161.8% (1.2027). Terms: "Non-commercial" - major market players: banks, hedge funds, investment funds, private, large investors. "Commercial" - commercial enterprises, firms, banks, corporations, companies that buy currency not for speculative profit, but for current activities or export-import operations. "Non-reportable positions" - small traders who do not have a significant impact on the price. EUR/USD and GBP/USD: Tighter quarantine restrictions will weaken the position of the US dollar. Persisting uncertainty over Brexit negotiations are dimming the outlook for the British pound. 2020-11-30 Demand for the euro rose last Friday amid rumors that the US will tighten quarantine restrictions due to the persistent rise of COVID-19 infections in the country. 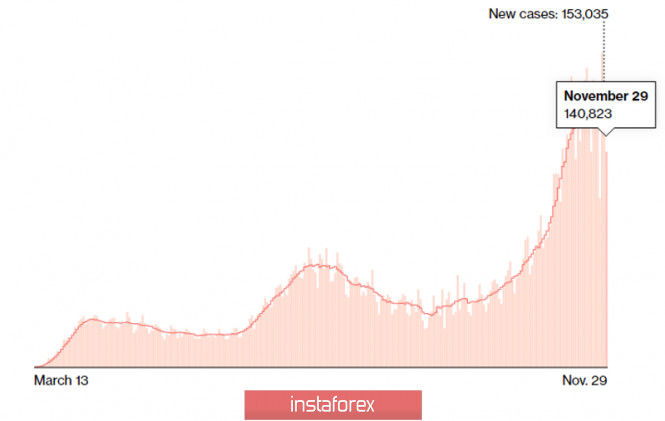 Many are concerned that the recent celebration of Thanksgiving may have caused a much larger increase in COVID-19 incidence. However, according to the latest data, about 141,000 new cases were recorded on November 29, lower than the 188,000 recorded at the beginning of last week. This data is not final yet though, so a surge may be seen after 1-2 weeks. In any case, by the time Joe Biden takes over as US President next January, coronavirus cases in the US may be much higher than December's, which will force the new president to impose stricter measures. And if the situation in the EU turns out to be much better, the US dollar may undergo even more pressure, since even without the news on COVID-19, there are many reasons why the currency will depreciate next year. The implementation of Biden's $ 2 trillion stimulus program is one example. With regards to the issue on the recent US elections, over the weekend, federal courts rejected the appeal filed by Donald Trump against Biden's victory. It seems that it will be difficult for Trump to continue fighting to retain his seat. 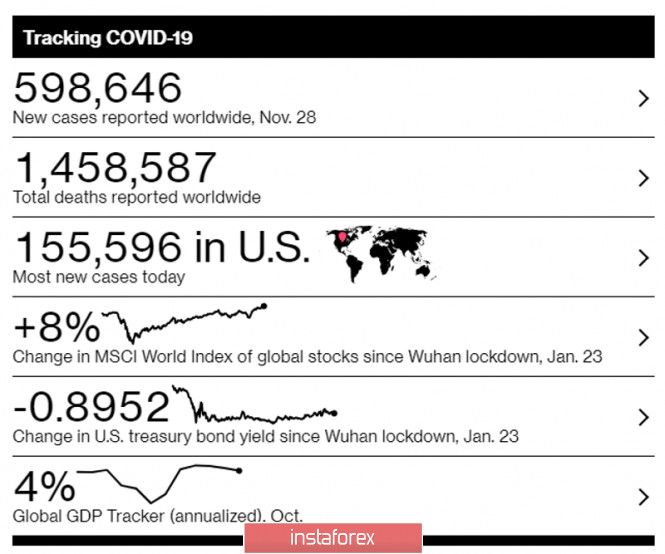 While the situation in the US is not very encouraging, many companies are beginning to revise their forecasts, expecting some growth in the global economy. The main reason for this is the news of successful vaccine trials from Pfizer, Moderna and AstraZeneca. As a result, Capital Economics expects global GDP to grow by 6.8% in 2020, not 6.0% as projected before. But by 2022, global economic growth will decline to 4.6%, against the previous forecast of 4.1%. UBS also believes that global GDP will jump in 2021 and 2022, particularly to 6.1% (from 5.3%) and 4.9% (from 4.1%) respectively. The growth should come from higher global demand and a pickup in exports. However, such a scenario will be possible only if COVID-19 incidence drops sharply in the second half of 2021. Although all this news has a positive impact on risky assets, there are still short-term risks remaining. For example, the threat of a rate cut by the ECB may restrain the growth of the euro in the near future, but there is a low chance that this will happen at the central bank's meeting this December. Instead, the regulator might expand its bond purchase program. With regards to macroeconomic reports, they did not deliver much influence on the market, but they once again proved that the situation is difficult in the EU. A report published last Friday said the index of sentiment in the eurozone economy dropped significantly in November, collapsing to 87.6 points from 91.1 points in October. Understandably, the trust of service and retail companies has sagged the most, but the representatives from the manufacturing and construction sectors were still optimistic about their outlook. 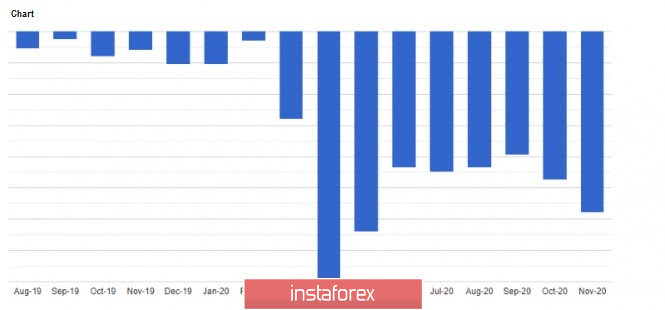 Meanwhile, the index for employment published by the Ifo Institute rose slightly in November amid a number of support programs provided by the government. According to the report, the Ifo Employment Barometer rose to 96.7 points in November after measuring 96.4 points in October. As for the EUR/USD pair, the market is currently in the hands of the bulls, clearly shown by the breakout from 1.1960. A further upward move is expected, especially towards the highs 1.2010 and 1.2060. If the quote manages to break again above this range, the euro will rise even higher next year. But if the price returns below 1.1960, the EUR/USD pair may collapse again towards 1.1915 and 1.1880, on which the further direction of the pair will depend. GBP/USD The uncertainty over Brexit negotiations are making traders expect a sharp decline in the British pound. To add to that, the latest report from the CME Group indicated a bias towards demand for options that provide for a fall in the pound. However, it should be noted that although the balance is shifting towards downward risks, it is not too strong and any Brexit news may change the balance of power. In any case, the pound will continue trading within the sideways channel, but if the bears turn out to be stronger and do not let the bulls go beyond 1.3350, the quote will decline to 1.3295, a breakout of which will push the GBP/USD pair to the lows 1.3250 and 1.3195. But if the bulls break above 1.3350, the pound will test the level 1.3395, and then attempt to climb to 1.3450 and 1.3510. Forex forecast 11/30/2020 on EUR/USD, USD/CAD and AUD/USD and SP500 from Sebastian Seliga 2020-11-30 Let's take a look at the technical picture od EUR/USD, USD/CAD and AUD/USD at the last trading day of the month November. Trading plan for the EUR/USD pair on November 30. Stop in the growth of COVID-19 incidence and possible rise in the euro. 2020-11-30 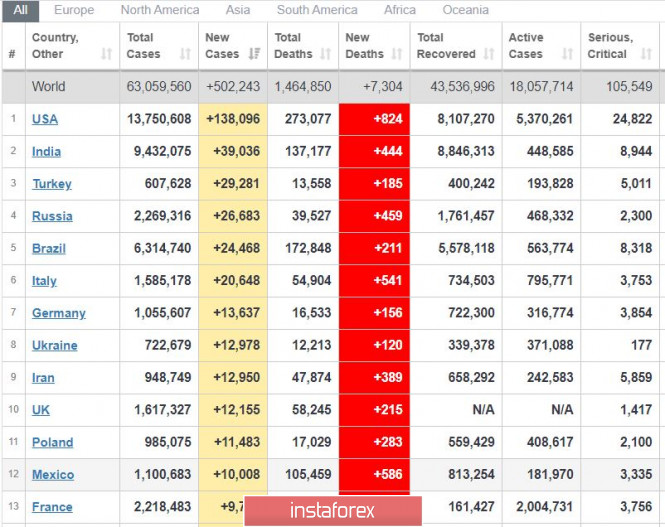
It seems that the growth in global COVID-19 incidence has stopped. The latest data only to 502,000, which is about 20-25% below the highest daily rate. In the United States, new cases have dropped to 138,000 which is 30% below the highest record. In Europe, although the situation is bad in Turkey, there are signs of stabilization in other countries. The Czech Republic even started to ease its quarantine restrictions. 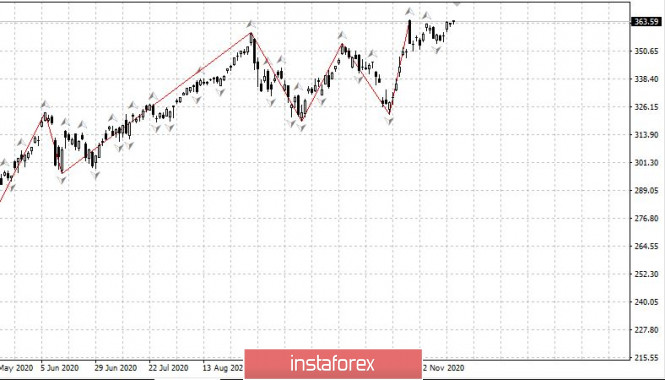
A new wave of growth is forming in the US market, but it will not be as large and fast as wanted. Because of this, it is best to wait for a strong pullback before starting to sell. Two important reports are also scheduled to come out in the US this week, and these are ISM indices and employment reports. 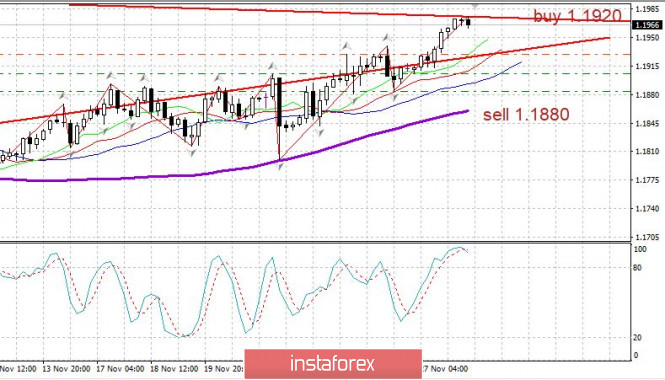
EUR / USD - The weekly candle closed very bullish, so the euro is likely to rise further. Open long positions from 1.1920. Open short positions from highs (but risky), or from the level of 1.1880.
Author's today's articles: Torben Melsted  Born in November 1962. Graduated from CBS, got Diploma in Finance. Began trading on Forex in 1986 and since that time held various positions such as advising clients, hedging client flows on FX and commodity markets. Also worked for major corporations as Financial Risk Manager. Uses Elliott wave analysis in combination with classic technical analysis, and has been using a Calmar Ratio of 5.0 for over 3 years. Has his own blog, where he uses Elliott wave and technical analysis on all financial markets. Born in November 1962. Graduated from CBS, got Diploma in Finance. Began trading on Forex in 1986 and since that time held various positions such as advising clients, hedging client flows on FX and commodity markets. Also worked for major corporations as Financial Risk Manager. Uses Elliott wave analysis in combination with classic technical analysis, and has been using a Calmar Ratio of 5.0 for over 3 years. Has his own blog, where he uses Elliott wave and technical analysis on all financial markets. Maxim Magdalinin  In 2005 graduated from the Academy of the Ministry of Internal Affairs of the Republic of Belarus, law faculty. Worked as a lawyer for three years in one of the biggest country's company. Besides the trading, he develops trading systems, writes articles and analytical reviews. Works at stock and commodity markets explorations. On Forex since 2006. In 2005 graduated from the Academy of the Ministry of Internal Affairs of the Republic of Belarus, law faculty. Worked as a lawyer for three years in one of the biggest country's company. Besides the trading, he develops trading systems, writes articles and analytical reviews. Works at stock and commodity markets explorations. On Forex since 2006. Sergey Belyaev  Born December 1, 1955. In 1993 graduated from Air Force Engineering Academy. In September 1999 started to study Forex markets. Since 2002 has been reading lectures on the technical analysis . Is fond of research work. Created a personal trading system based on the indicator analysis. Authored the book on technical analysis "Calculation of the next candlestick". At present the next book is being prepared for publishing "Indicator Analysis of Forex Market. Trading System Encyclopedia". Has created eleven courses on indicator analysis. Uses classical indicators. Works as a public lecturer. Held numerous seminars and workshops presented at international exhibitions of financial markets industry. Is known as one of the best specialists in the Russian Federation researching indicator analysis. Born December 1, 1955. In 1993 graduated from Air Force Engineering Academy. In September 1999 started to study Forex markets. Since 2002 has been reading lectures on the technical analysis . Is fond of research work. Created a personal trading system based on the indicator analysis. Authored the book on technical analysis "Calculation of the next candlestick". At present the next book is being prepared for publishing "Indicator Analysis of Forex Market. Trading System Encyclopedia". Has created eleven courses on indicator analysis. Uses classical indicators. Works as a public lecturer. Held numerous seminars and workshops presented at international exhibitions of financial markets industry. Is known as one of the best specialists in the Russian Federation researching indicator analysis. l Kolesnikova  text text Sebastian Seliga  Sebastian Seliga was born on 13th Oсtober 1978 in Poland. He graduated in 2005 with MA in Social Psychology. He has worked for leading financial companies in Poland where he actively traded on NYSE, AMEX and NASDAQ exchanges. Sebastian started Forex trading in 2009 and mastered Elliott Wave Principle approach to the markets by developing and implementing his own trading strategies of Forex analysis. Since 2012, he has been writing analitical reviews based on EWP for blogs and for Forex websites and forums. He has developed several on-line projects devoted to Forex trading and investments. He is interested in slow cooking, stand-up comedy, guitar playing, reading and swimming. "Every battle is won before it is ever fought", Sun Tzu Sebastian Seliga was born on 13th Oсtober 1978 in Poland. He graduated in 2005 with MA in Social Psychology. He has worked for leading financial companies in Poland where he actively traded on NYSE, AMEX and NASDAQ exchanges. Sebastian started Forex trading in 2009 and mastered Elliott Wave Principle approach to the markets by developing and implementing his own trading strategies of Forex analysis. Since 2012, he has been writing analitical reviews based on EWP for blogs and for Forex websites and forums. He has developed several on-line projects devoted to Forex trading and investments. He is interested in slow cooking, stand-up comedy, guitar playing, reading and swimming. "Every battle is won before it is ever fought", Sun Tzu Irina Manzenko  Irina Manzenko Irina Manzenko Grigory Sokolov  Born 1 January, 1986. In 2008 graduated from Kiev Institute of Business and Technology with "Finance and Credit" as a major. Since 2008 has studied the behavior of various currency pairs and their correlation on Forex. In his works and trading practice he uses candlestick analysis and Fibonacci technique. Since 2009 has written analytical reviews and articles which are published on popular Internet resources. Interests: music, computers and cookery. "Out of five deadly sins of business and as a rule, the most widespread, excessive striving to get profit is the worst". P. Drucker Born 1 January, 1986. In 2008 graduated from Kiev Institute of Business and Technology with "Finance and Credit" as a major. Since 2008 has studied the behavior of various currency pairs and their correlation on Forex. In his works and trading practice he uses candlestick analysis and Fibonacci technique. Since 2009 has written analytical reviews and articles which are published on popular Internet resources. Interests: music, computers and cookery. "Out of five deadly sins of business and as a rule, the most widespread, excessive striving to get profit is the worst". P. Drucker Pavel Vlasov  No data No data Mihail Makarov  - -
Subscription's options management Theme's:
Fundamental analysis, Fractal analysis, Wave analysis, Technical analysis, Stock Markets
Author's :
A Zotova, Aleksey Almazov, Alexander Dneprovskiy, Alexandr Davidov, Alexandros Yfantis, Andrey Shevchenko, Arief Makmur, Dean Leo, Evgeny Klimov, Fedor Pavlov, Grigory Sokolov, I Belozerov, Igor Kovalyov, Irina Manzenko, Ivan Aleksandrov, l Kolesnikova, Maxim Magdalinin, Mihail Makarov, Mohamed Samy, Mourad El Keddani, Oleg Khmelevskiy, Oscar Ton, Pavel Vlasov, Petar Jacimovic, R Agafonov, S Doronina, Sebastian Seliga, Sergey Belyaev, Sergey Mityukov, Stanislav Polyanskiy, T Strelkova, Torben Melsted, V Isakov, Viktor Vasilevsky, Vladislav Tukhmenev, Vyacheslav Ognev, Yuriy Zaycev, Zhizhko Nadezhda
Edit data of subscription settings
Unsubscribe from the mailing list Sincerely,
Analysts Service | If you have any questions, you can make a phone call using one of the
InstaForex Toll free numbers right now:
|  | InstaForex Group is an international brand providing online trading services to the clients all over the world. InstaForex Group members include regulated companies in Europe, Russia and British Virgin Islands. This letter may contain personal information for access to your InstaForex trading account, so for the purpose of safety it is recommended to delete this data from the history. If you have received this letter by mistake, please contact InstaForex Customer Relations Department. |


No comments:
Post a Comment