| Technical analysis of GBP/USD for November 30, 2020 2020-11-30 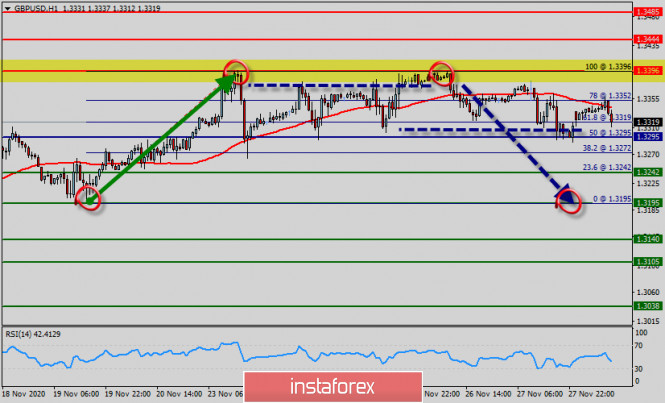 Overview : The GBP/USD pair failed to settle above the resistance at 1.3396 and is trying to get below the top of 1.3396. Noted that the GBP/USD pair dropped perfectly, remain bearish for a further drop. The resistance of 1.3396 has been rejected two times confirming the validity of a downtrend. Moreover, in larger time frames the trend is still bearish as long as the level of 1.3396 is not breached . This resistance level (1.3396) has already been tested several times and proved its strength. If the GBP/USD pair manages to settle down this resistance level, it will gain downside momentum and head towards the next pivot point at last week low at 1.3295. A move below 1.3295 will open the way to the test of the support at 1.3242. Equally important, the GBP/USD pair is still moving around the key level at 1.3295, which represents a daily pivot in the H1 time frame at the moment. RSI (14) has made a recent bearish exit which is in line with the bearish exit we're seeing in price. Moreover, the RSI is still signaling that the trend is downward as it remains strong beow the moving average (100). This suggests that the pair will probably go down in coming hours. If the pair fails to pass through the level of 1.3396, the market will indicate a bearish opportunity below the strong resistance level of 1.3396. In this regard, sell deals are recommended lower than the 1.3396 level with the first target at 1.3295. It is possible that the pair will turn downwards continuing the development of the bearish trend to the level 1.3242. On the support side, the nearest support level for the GBP/USD pair is located at 1.3242. In case the GBP/USD pairdclines below this level, it will head towards the next support which has emerged at 1.3195 (last bearish wave). A move below the support at 1.3300 will push the GBP/USD pair towards the next support level near the 100 EMA at 1.3140. However, stop loss has always been in consideration thus it will be useful to set it above the last double top at the level of 1.3396 (notice that the major resistance today has set at 1.3396). Why is gold falling? 2020-11-30 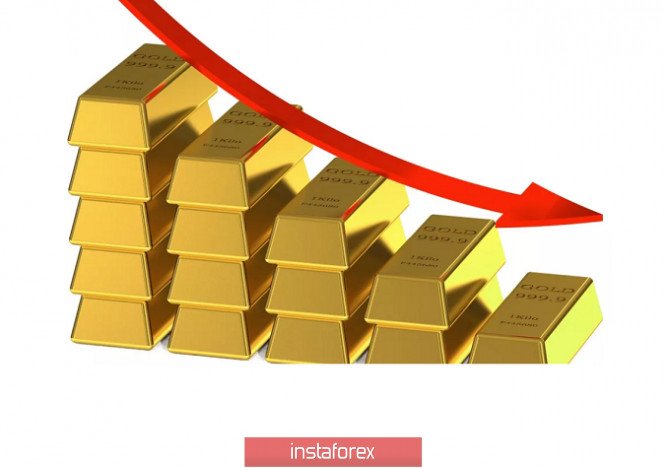
Gold's collapse last week was fueled by several factors: a rally in the stock market, better-than-expected economic data and positive news about COVID-19 vaccines. But oddly enough, most Western analysts believe that the yellow metal would stabilize around $ 1,800 and then increase further next year. The Australia and New Zealand (ANZ) Banking Group said the news of successful vaccine trials had no impact on the price of gold, citing real interest rates, inflation and a weaker US dollar as triggers that would push gold to $ 2,100 next year. Even the Canadian Imperial Bank of Commerce (CIBC) said gold will average $ 2,300 in 2021. Regarding the recent sell-off in the asset, TD Securities called it as "misguided," saying that the very idea that we would need less incentive is wrong. The bank also said it does not believe that the economy will return to normal in the near future. 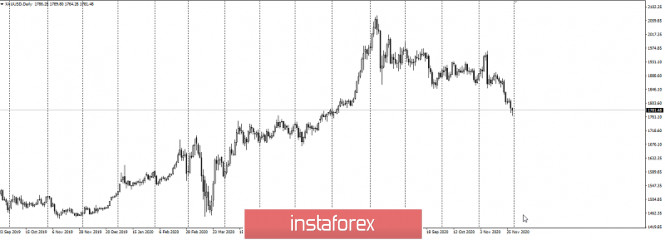
Does this mean that the markets are underestimating the amount of stimulus that will be needed next year, especially since Biden has chosen Janet Yellen as the next US Treasury Secretary? Many say that Yellen can work very well with the Fed to stimulate the economy, describing her as a soft chairman and a proponent of spending when needed. But, of course, not all banks agree on this. The Bank of America, for example, is neutral on this matter. Thus, they believe that gold would average slightly above $ 2,000 next year. Westpac, meanwhile, was on a more negative outlook for gold, predicting it will decline to $ 1,650 an ounce over the next two years. Technical analysis of EUR/USD for November 30, 2020 2020-11-30 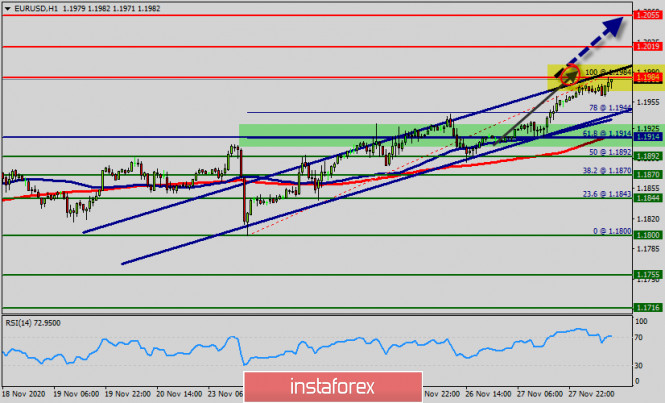 Overview : The EUR/USD pair will continue to rise from the level of 1.1914. The support is found at the level of 1.1914, which represents the 61.8% Fibonacci retracement level in the H1 time frame. The Euro rallied significantly on Monday again, as we continue to see the US dollar lose strength. Ultimately, this is a market that is trying to break out. The Euro rallied a bit during the trading session today as we continue to see strength, although in a relatively illiquid environment The price is likely to form a double bottom. Today, the major support is seen at 1.1914, while immediate resistance is seen at 1.1984. The top price at 1.1984 will be broking in coming minutes. Accordingly, the EUR/USD pair is showing signs of strength following a breakout of a high at 1.1984. So, buy at the level of 1.1984 with the first target at 1.2019 in order to test the daily resistance 1 and move further to 1.2055. Also, the level of 1.2055 is a good place to take profit because it will form a double top. Amid the previous events, the pair is still in an uptrend; for that we expect the EUR/USD pair to climb from 1.1950 to 1.2055 today. At the same time, in case a reversal takes place and the EUR/USD pair breaks through the support level of 1.1914, a further decline to 1.1803 can occur, which would indicate a bearish market. Conclusion : The EUR/USD pair is technically uptrend, confined to a 1.1914 - 1.2055 range for a third consecutive week. In the 1-hour chart, the pair is between Fibonacci levels and moving averages, with the 100 SMA converging with the 61.8% retracement of its latest daily advance at 1.1914. According to the previous events the price is expected to remain between 1.1944 and 1.2055 levels. Buy-deals are recommended above 1.1944/1.1984 with the first target seen at 1.2019. The movement is likely to resume to the point 1.2019 and further to the point 1.2055. However, if the the price of the EUR/USD pair breaks 1.1914 and closes below it, the market will indicate a bearish opportunity below 1.1914 then the best location to set stop loss should be at the 1.1900 price. Technical analysis for EUR/USD pair for the week of November 30 to December 5 2020-11-30 Trend analysis The price from the level of 1.1962 (closing of the last weekly candlestick) may continue to rise this week to the target of 1.2010 – upper fractal (red dotted line), which is the weekly candle from 08/30/2020. Upon reaching this level, it can further rise towards the next target – pullback level of 76.4% (blue dotted line). 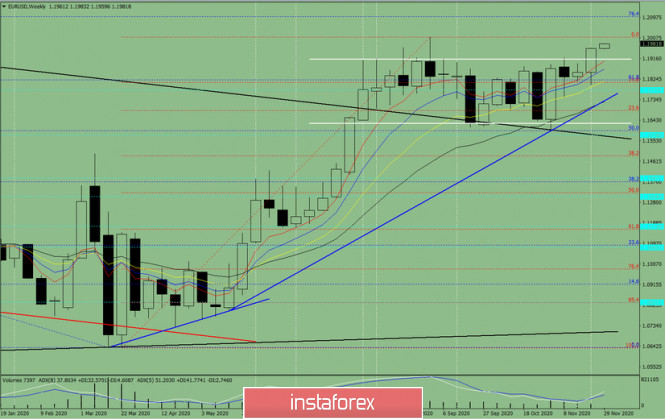
Figure 1 (weekly chart) Comprehensive analysis: - indicator analysis - up; - Fibonacci levels - up; - volumes - up; - candlestick analysis - up; - trend analysis - up; - Bollinger lines - up; - monthly chart - up. An upward movement can be concluded based on comprehensive analysis. The overall result of the candlestick calculation on the weekly chart: the price is likely to have an upward trend this week, with no lower shadow in the weekly white candlestick (Monday - up) and no upper shadow (Friday - up). The first upper target is 1.2010 – the upper fractal (red dotted line), which is also the weekly candle from 08/30/2020. If this level is reached, the pair can continue to move upwards to the pullback level of 76.4% (blue dotted line). An alternative scenario: rising from the level of 1.1962 (closing of the last weekly candlestick) to the next target of 1.2010 – the upper fractal (red dashed line), which is also the weekly candlestick from 08/30/2020 is possible. After reaching this level, working downwards to the target support level of 1.1910 (white thick line) can be considered. Technical analysis for GBP/USD pair for the week of November 30 to December 5 2020-11-30 The pound/dollar pair continued to rise last week and tested the cloud consisting of the historical resistance level 1.3383 (blue dotted line) and the resistance line 1.3338 (black bold line). This week, the price will most likely pull back down. Trend analysis This week, the price from the level of 1.3313 (close of the last weekly candlestick) is expected to decline to the target of 1.3178 – the pullback level of 14.6% (red dotted line). If this level is reached, it is possible to further decline towards the next target of 1.3225 – the pullback level of 23.6% (red dotted line). This week's final target is the support line of 1.2991 (white thick line), from which the price can continue to decline. 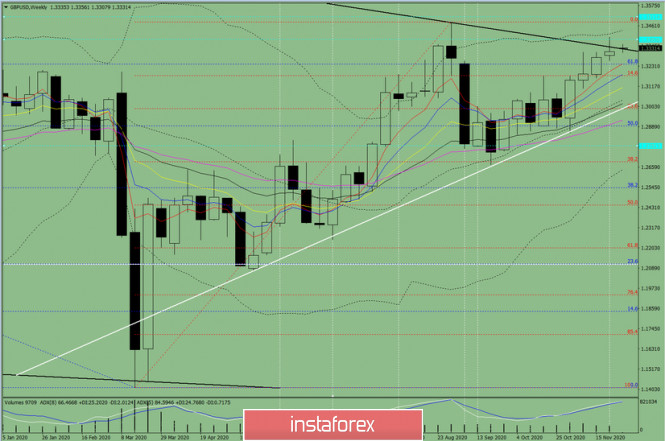
Figure 1 (weekly chart) Comprehensive analysis: - indicator analysis - down; - Fibonacci levels - down; - volumes - down; - candlestick analysis - down; - trend analysis - down; - Bollinger lines - up; - monthly chart - down. A downward movement can be concluded based on comprehensive analysis. The overall result of the candlestick calculation on the weekly chart: the price is likely to have a downward trend this week, with no first upper shadow of the weekly black candlestick (Monday - down) and no second lower shadow (Friday - up). The first downside target is 1.3178, which is the pullback level of 14.6% (red dotted line). If this level is reached, it is possible to continue moving downwards to the next target of 1.3125 – the pullback level of 23.6% (red dotted line). The final target for this week is 1.2991 support line (white thick line), from which the price may further decline. An alternative scenario: the price may rise from the level of 1.3313 (closing of the last weekly candle) to the target of 1.3481 – the upper fractal (weekly candle from 08/30/2020). If this level is reached, it is possible to continue the upward movement. EUR/USD analysis for November 30 2020 - Bearish divergence on the Stochastic oscillator and potential for downside rotation towards 1.1960 2020-11-30 Moderna set to file for US, EU clearance for its coronavirus vaccine - Vaccine was 100% effective against severe virus cases in trial
- No new serious safety concerns identified since 16 November trial
- To apply for US emergency-use authorisation today
- To apply for EU conditional approval today
- Expects FDA advisory meeting on 17 December
Another Monday, another dose of vaccine optimism to hit the market. Moderna stocks itself are up 10% in pre-market upon the announcement above but the overall jump in risk trades is more measured, all things considered compared to previous vaccine news. Further Development 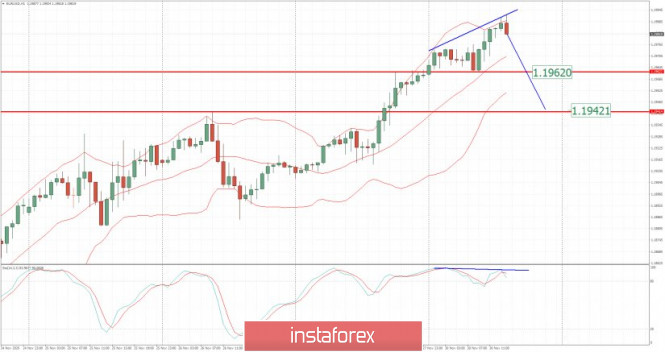
Analyzing the current trading chart of EUR/USD, I found that the buyers got exhausted today and the downside roattion would be probably to correct strong upside movement from recent few days. 1-Day relative strength performance Finviz 
Based on the graph above I found that on the top of the list we got Cooper and Natural Gas today and on the bottom Silver and Gasoline RBOB. EUR/USD is slightly positive on the list but with overbought condition... Key Levels: Resistance: 1,1990 Support levels: 1,1960 and 1,1940 Analysis of Gold for November 30,.2020 - Sellers in control and potential for the downside movement towards $1.740 2020-11-30 European Commission says EU fully concentrated on Brexit negotiations right now Some Brexit remarks by the European Commission - People, businesses have had time to prepare for end of transition period
- If no-deal contingency plans are needed, they would be limited and adopted in time for 1 January
Some token remarks really, once again not giving anything away with regards to how the state of negotiations are playing out. The pound is off earlier lows again with cable near session highs as the dollar is seen weakening a little on the session. 
Further Development 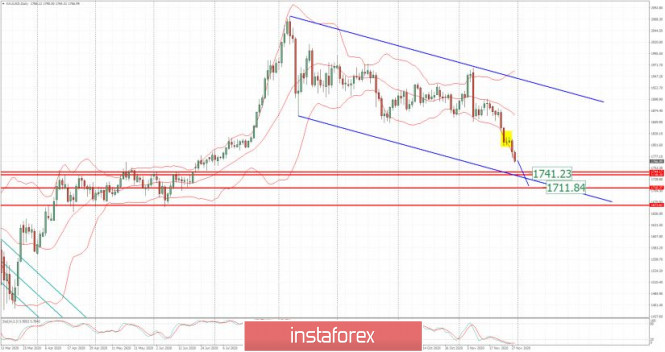
Analyzing the current trading chart of Gold, I found that the sellers are still in control without any signs of reversal. 1-Day relative strength performance Finviz 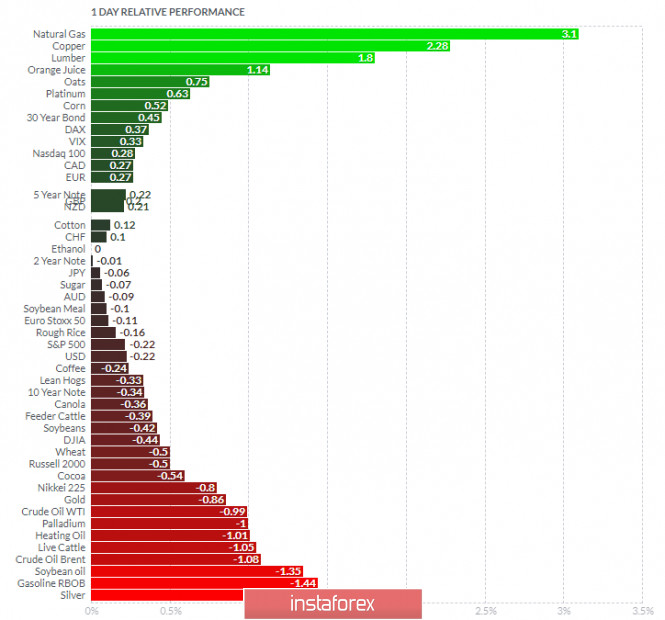
Based on the graph above I found that on the top of the list we got Cooper and Natural Gas today and on the bottom Silver and Gasoiln RBOB. Key Levels: Resistance: $1,783 Support levels: $1,741 and $1,71
Author's today's articles: Mourad El Keddani  Was born in Oujda, Morocco. Currently lives in Belgium. In 2003 obtained B.S. in Experimental Sciences. In 2007 obtained a graduate diploma at Institut Marocain Specialise en Informatique Applique (IMSIA), specialty – Software Engineering Analyst. In 2007–2009 worked as teacher of computer services and trainer in a professional school specializing in computer technologies and accounting. In 2005 started Forex trading. Authored articles and analytical reviews on Forex market on Forex websites and forums. Since 2008 performs Forex market research, and develops and implements his own trading strategies of Forex analysis (especially in Forex Research & Analysis, Currency Forecast, and Recommendations and Analysis) that lies in: Numerical analysis: Probabilities, equations and techniques of applying Fibonacci levels. Classical analysis: Breakout strategy and trend indicators. Uses obtained skills to manage traders' accounts since 2009. In April 2009 was certified Financial Technician by the International Federation of Technical Analysts. Winner of several social work awards: Education Literacy and Non-Formal Education (in Literacy and Adult Education in The National Initiative for Human Development). Was born in Oujda, Morocco. Currently lives in Belgium. In 2003 obtained B.S. in Experimental Sciences. In 2007 obtained a graduate diploma at Institut Marocain Specialise en Informatique Applique (IMSIA), specialty – Software Engineering Analyst. In 2007–2009 worked as teacher of computer services and trainer in a professional school specializing in computer technologies and accounting. In 2005 started Forex trading. Authored articles and analytical reviews on Forex market on Forex websites and forums. Since 2008 performs Forex market research, and develops and implements his own trading strategies of Forex analysis (especially in Forex Research & Analysis, Currency Forecast, and Recommendations and Analysis) that lies in: Numerical analysis: Probabilities, equations and techniques of applying Fibonacci levels. Classical analysis: Breakout strategy and trend indicators. Uses obtained skills to manage traders' accounts since 2009. In April 2009 was certified Financial Technician by the International Federation of Technical Analysts. Winner of several social work awards: Education Literacy and Non-Formal Education (in Literacy and Adult Education in The National Initiative for Human Development).
Languages: Arabic, English, French and Dutch.
Interests: Algorithm, Graphics, Social work, Psychology and Philosophy. Andrey Shevchenko  Andrey Shevchenko Andrey Shevchenko Sergey Belyaev  Born December 1, 1955. In 1993 graduated from Air Force Engineering Academy. In September 1999 started to study Forex markets. Since 2002 has been reading lectures on the technical analysis . Is fond of research work. Created a personal trading system based on the indicator analysis. Authored the book on technical analysis "Calculation of the next candlestick". At present the next book is being prepared for publishing "Indicator Analysis of Forex Market. Trading System Encyclopedia". Has created eleven courses on indicator analysis. Uses classical indicators. Works as a public lecturer. Held numerous seminars and workshops presented at international exhibitions of financial markets industry. Is known as one of the best specialists in the Russian Federation researching indicator analysis. Born December 1, 1955. In 1993 graduated from Air Force Engineering Academy. In September 1999 started to study Forex markets. Since 2002 has been reading lectures on the technical analysis . Is fond of research work. Created a personal trading system based on the indicator analysis. Authored the book on technical analysis "Calculation of the next candlestick". At present the next book is being prepared for publishing "Indicator Analysis of Forex Market. Trading System Encyclopedia". Has created eleven courses on indicator analysis. Uses classical indicators. Works as a public lecturer. Held numerous seminars and workshops presented at international exhibitions of financial markets industry. Is known as one of the best specialists in the Russian Federation researching indicator analysis. Petar Jacimovic  Petar was born on July 08, 1989 in Serbia. Graduated from Economy University and after has worked as a currency analyst for large private investors. Petar has been involved in the world of finance since 2007. In this trading he specializes in Volume Price Action (volume background, multi Fibonacci zones, trend channels, supply and demand). He also writes the market analytical reviews for Forex forums and websites. Moreover Petar is forex teacher and has wide experience in tutoring and conducting webinars. Interests : finance, travelling, sports, music "The key to success is hard work" Petar was born on July 08, 1989 in Serbia. Graduated from Economy University and after has worked as a currency analyst for large private investors. Petar has been involved in the world of finance since 2007. In this trading he specializes in Volume Price Action (volume background, multi Fibonacci zones, trend channels, supply and demand). He also writes the market analytical reviews for Forex forums and websites. Moreover Petar is forex teacher and has wide experience in tutoring and conducting webinars. Interests : finance, travelling, sports, music "The key to success is hard work"
Subscription's options management Theme's:
Fundamental analysis, Fractal analysis, Wave analysis, Technical analysis, Stock Markets
Author's :
A Zotova, Aleksey Almazov, Alexander Dneprovskiy, Alexandr Davidov, Alexandros Yfantis, Andrey Shevchenko, Arief Makmur, Dean Leo, Evgeny Klimov, Fedor Pavlov, Grigory Sokolov, I Belozerov, Igor Kovalyov, Irina Manzenko, Ivan Aleksandrov, l Kolesnikova, Maxim Magdalinin, Mihail Makarov, Mohamed Samy, Mourad El Keddani, Oleg Khmelevskiy, Oscar Ton, Pavel Vlasov, Petar Jacimovic, R Agafonov, S Doronina, Sebastian Seliga, Sergey Belyaev, Sergey Mityukov, Stanislav Polyanskiy, T Strelkova, Torben Melsted, V Isakov, Viktor Vasilevsky, Vladislav Tukhmenev, Vyacheslav Ognev, Yuriy Zaycev, Zhizhko Nadezhda
Edit data of subscription settings
Unsubscribe from the mailing list Sincerely,
Analysts Service | If you have any questions, you can make a phone call using one of the
InstaForex Toll free numbers right now:
|  | InstaForex Group is an international brand providing online trading services to the clients all over the world. InstaForex Group members include regulated companies in Europe, Russia and British Virgin Islands. This letter may contain personal information for access to your InstaForex trading account, so for the purpose of safety it is recommended to delete this data from the history. If you have received this letter by mistake, please contact InstaForex Customer Relations Department. |


No comments:
Post a Comment