| Forecast and trading signals for GBP/USD on November 27. COT report. Analysis of Thursday. Recommendations for Friday 2020-11-27 GBPUSD 15M 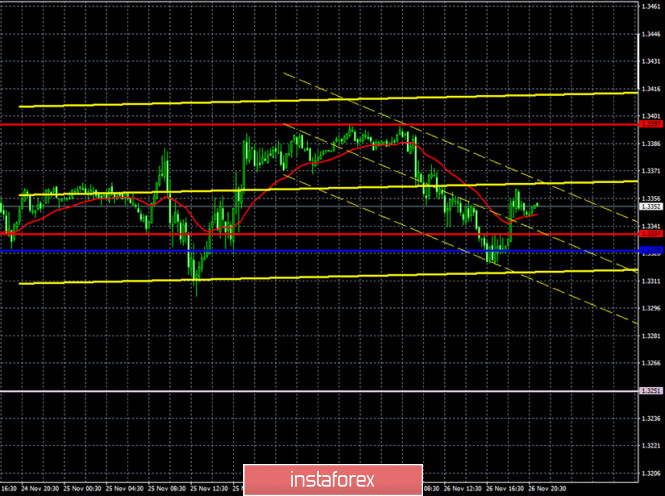 The lower linear regression channels turned to the downside on the 15-minute timeframe, which is absolutely logical after the price failed to overcome the 1.3397 level. However, the downward movement entirely depends on the ability or inability of traders to overcome the critical Kijun-sen line. GBPUSD 1H 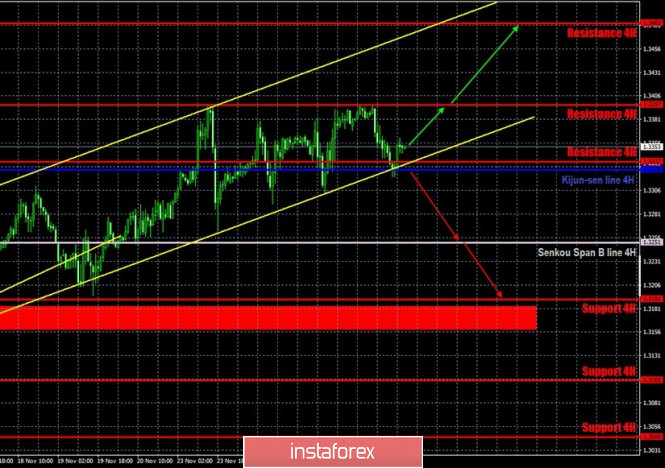 The GBP/USD pair reached the resistance level of 1.3397 for the second time, rebounded from it for the second time and began a new round of corrective movement within the same upward channel, reaching its lower boundary by the end of Thursday, November 26. At the same time, the pound/dollar pair reached the critical Kijun-sen line, which was moving towards the price. Now, if the quotes rebound off these two supports, then the upward trend may resume. The fundamental background is not on the pound's side, however this was also the case a week ago, and the British currency was still growing in price. If the bears push through the Kijun-sen line and the lower channel line, this will be a serious step towards a new downward trend that has been brewing for a long time. We still believe that the pound has no prospects, and it is becoming more expensive solely due to the markets' faith in a bright future (in the free trade deal between the UK and the EU). COT report 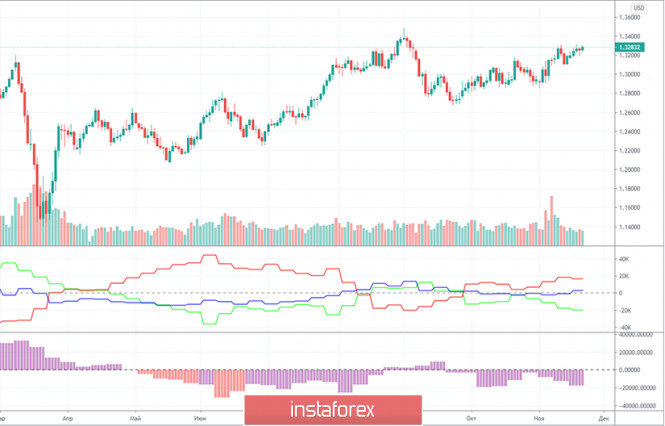
The GBP/USD pair rose by 25 points in the last reporting week (November 10-16), although the volatility was quite high during this time period. However, the Commitment of Traders (COT) report has not provided us with any important information that could help in forecasting and trading for several weeks now. Recall that the red and green lines must move away from each other or sharply change the direction of their movement, so that we can conclude that one trend ends and another begins. In recent months, both lines regularly change their direction, which indicates the absence of signals based on COT reports. What can we say about the most important group of non-commercial traders? This group opened 533 contracts to buy the pound and 616 contracts to sell during the reporting week. Therefore, it doesn't even make any special sense to calculate the change in the net position or the amount by which the attitude of professional traders has changed. A little more than 1000 contracts per week is very little. Therefore, in essence, there are no changes. What do we end up with? There are no changes, and the general picture of things does not make it possible to predict any definite development of the situation. So now it is better to pay more attention to technique and foundation. The foundational backdrop for the British pound was hilarious on Thursday. There were no macroeconomic statistics that day, but that is not required for the pound right now anyway. Market participants are overwhelmingly focused on the information regarding the negotiations on the Brexit trade talks, although, to be honest, it would be better if they did not pay attention to it at all. Head of the European Commission Ursula von der Leyen said that the next few days will be extremely important and the EU is ready for Brexit to have no deal. Michel Barnier threatened David Frost with withdrawing from negotiations this week (or at all?) If London continues to take a principled and uncompromising position. The French foreign minister accused London of dragging out the talks. And the turn to make a statement came to the chief negotiator from Great Britain, David Frost, who said that London wants to resume negotiations with Brussels one-on-one, but everything depends on the European partners whether they want a new meeting. Thus, both sides continue to rush phrases that are designed to show the world community that they are not to blame for the failure of the negotiations if something happens. These statements do not carry any semantic meaning and are only meant to confuse. No major events or macroeconomic reports from the UK and the United States for today. Market participants will monitor any news related to the trade talks. Of course, this is not the only topic that can influence the pound. However, for now, traders do not want to pay attention to them. We have said more than once that if we take the entire fundamental background into account, then the pound has no reason to rise in price against the dollar. Nevertheless, the upward trend remains within the rising channel. We have two trading ideas for November 27: 1) Buyers for the pound/dollar pair continue to hold the initiative in their hands and did not let the price go below the Kijun-sen line (1.3328) and below the rising channel. Thus, we advise you to trade upwards while aiming for the resistance levels of 1.3397 and 1.3483 as long as the price is within the rising channel and above the critical line. Take Profit in this case will be up to 120 points. 2) Sellers failed to get the pair to settle below the rising channel. If the price settles below the Kijun-sen line (1.3328) and below the rising channel, you are advised to sell the pair while aiming for the Senkou Span B line (1.3251) and the support level of 1.3191. Take Profit in this case can range from 60 to 130 points. Forecast and trading signals for EUR/USD Explanations for illustrations: Support and Resistance Levels are the levels that serve as targets when buying or selling the pair. You can place Take Profit near these levels. Kijun-sen and Senkou Span B lines are lines of the Ichimoku indicator transferred to the hourly timeframe from the 4-hour one. Support and resistance areas are areas from which the price has repeatedly rebounded off. Yellow lines are trend lines, trend channels and any other technical patterns. Indicator 1 on the COT charts is the size of the net position of each category of traders. Indicator 2 on the COT charts is the size of the net position for the "non-commercial" group. Forecast and trading signals for EUR/USD on November 27. COT report. Analysis of Thursday. Recommendations for Friday 2020-11-27 EUR/USD 15M 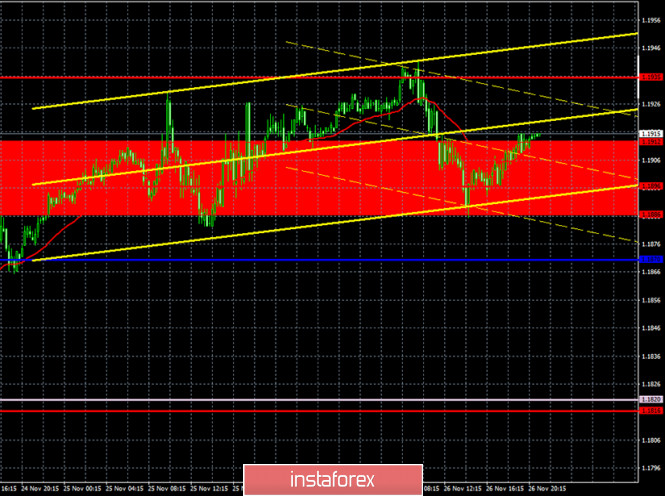 The linear regression channels turned to the downside on the 15-minute timeframe, after it failed to overcome the 1.1935 level. We can clearly see a rebound from this level. The most interesting thing is that growth prospects remain unchanged and do not even decrease. The pair updates the previous day's high by 5-10 points every day. At this rate, the price will creep to the 1.2000 level for about another month. EUR/USD 1H 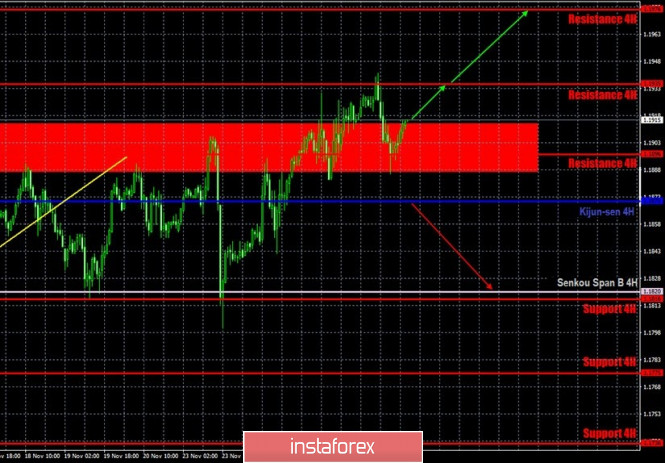 The EUR/USD pair was still trading incomprehensibly with mind-blowing volatility on the hourly timeframe on Thursday, November 26. The pair managed to gain 56 points, which is still quite a good result. As for the movements, the pair was still able to overcome the resistance area of 1.1886-1.1912, which seems to increase the likelihood of sustaining growth. However, the first obstacle was the resistance level of 1.1935 - which pushed traders down to the 1.1886 level. Therefore, the EUR/USD pair has formally left the four-month horizontal channel. The upward trend may formally begin now. In fact, does anyone see the beginning of this very upward trend? At the moment, the quotes are five points higher than the area in which they spent most of the last four months. Therefore, it is absolutely impossible to predict where the pair will move in the coming days. The picture becomes even more confusing if we also add fundamental analysis here, since it is completely incomprehensible what exactly market participants are paying attention to at the moment. Judging by the nature of the movements, whatever is present. COT report 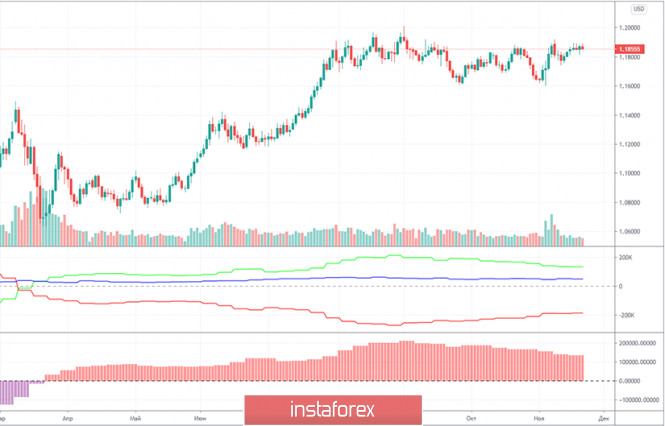
The EUR/USD pair increased by 40 points in the last reporting week (November 10-16). As you can see, price changes are still minimal. There were certain bursts of activity during the US presidential elections, but they ended very quickly and now the pair is just trading in a horizontal channel, with minimal volatility. Therefore, we expect clarification of the current situation from the Commitment of Traders (COT) reports. Unfortunately, COT reports for the last 8-10 weeks now show that non-commercial traders are reducing their net position. This means that their sentiment is becoming more bearish. The green and red lines of the first indicator show the net positions of commercial and non-commercial traders, and when they are far from each other, this is considered a strong signal for a trend change. However, the lines have moved away and they have been moving towards each other for two months now. There is no downward trend. The "non-commercial" group of traders, which is the most important and significant, opened 2,000 Buy-contracts (longs) and 1,500 Sell-contracts (shorts) for the euro during the reporting week. Therefore, there is simply no change in the mood of this group of traders. We are much less interested in other groups of traders. In general, we have a somewhat paradoxical situation, as professional traders have been reducing the number of purchases of the euro currency and increasing sales for more than two months, but the euro does not fall. Nevertheless, based on the data of the report, we still believe that the peak of the entire upward trend was near the 1.2000 level and sooner or later the downward movement will start. No important reports or events from the European Union and America on Thursday. Traders had nothing to react to during the day. And even if there was something, it would hardly make them want to trade more actively and logically. We have already mentioned that the euro is losing its global fundamental advantage over the dollar due to the fact that the EU's GDP may seriously contract again in the fourth quarter. Unlike American GDP. But so far traders do not even take this factor into account. Therefore, we do expect the euro to fall and would only trade with the trend. No important macroeconomic report or fundamental event from the European Union and the United States on Friday, November 27. Traders had nothing to react to once again. We believe that volatility will be low again, unless we receive some discouraging news. In fact, there are quite interesting and important topics for the EUR/USD pair, but they cannot be used to predict when the next information will appear. We have two trading ideas for November 27: 1) Buyers managed to overcome the resistance area of 1.1886-1.1912, but they could not build on their success after that and rise further. Therefore, you are advised to open new long positions while aiming for the resistance levels of 1.1935 and 1.1976 if the price settles above the 1.1886-1.1912 area. Take Profit in this case will not exceed 55 points. 2) Bears are releasing the pair from their hands more and more every day, nevertheless, the current fundamental background allows them to count on a bright future. Therefore, you are advised to open new sell orders while initially aiming for the Senkou Span B line (1.1820) if the price settles below the Kijun-sen line (1.1870). Take Profit in this case can be up to 40 points. Forecast and trading signals for GBP/USD Explanations for illustrations: Support and Resistance Levels are the levels that serve as targets when buying or selling the pair. You can place Take Profit near these levels. Kijun-sen and Senkou Span B lines are lines of the Ichimoku indicator transferred to the hourly timeframe from the 4-hour one. Support and resistance areas are areas from which the price has repeatedly rebounded off. Yellow lines are trend lines, trend channels and any other technical patterns. Indicator 1 on the COT charts is the size of the net position of each category of traders. Indicator 2 on the COT charts is the size of the net position for the "non-commercial" group. Technical Analysis of EUR/USD for November 27, 2020 2020-11-27 Technical Market Outlook: Another higher high was made on the EUR/USD pair after the market had broken out of the range zone. The new high is located at the level of 1.1940, but the move up produced the yet another Bearish Engulfing candle. The next target for bulls is seen at the level of 1.1965. The key target for bulls is located at 1.2000. The nearest technical support is located at 1.1813, 1.1803 and 1.1789. The strong and positive momentum supports the short-term bullish outlook. Weekly Pivot Points: WR3 - 1.1973 WR2 - 1.1933 WR1 - 1.1892 Weekly Pivot - 1.1854 WS1 - 1.1815 WS2 - 1.1774 WS3 - 1.1735 Trading Recommendations: Since the middle of March 2020 the main trend is on EUR/USD pair has been up, which can be confirmed by almost 10 weekly up candles on the weekly time frame chart and 4 monthly up candles on the monthly time frame chart. The recent correction towards the level of 1.1612 seems to be completed and now market is ready for another wave up. This means any local corrections should be used to buy the dips until the key technical support is broken. The key long-term technical support is seen at the level of 1.1445. The key long-term technical resistance is seen at the level of 1.2555. 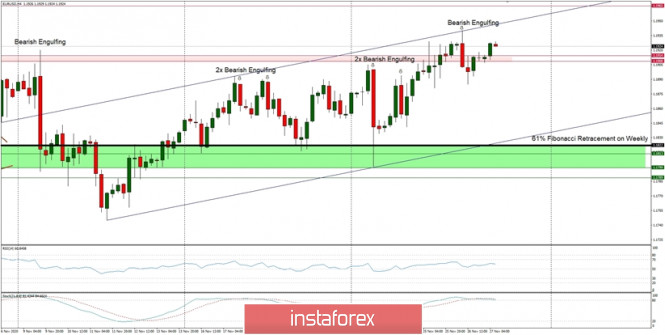
Technical Analysis of GBP/USD for November 27, 2020 2020-11-27 Technical Market Outlook: The GPB/USD pair had tested the swing high located at the level of 1.3395, but did not manage to break through towards the next level. It is worth to notice that Pound still keeps trading inside of the ascending channel after the rally has been capped at the level of 1.3395. The Bearish Engulfing candlestick pattern occurred on H4 time frame is still a valid trigger for a pull-back, so the market might test the zone between the levels of 1.3264 - 1.3295 again. The next target for bulls is still seen at the level of 1.3447(swing high) and then at 1.3512. The nearest technical support is located at 1.3306, 1.3295 and 1.3264. The strong and positive momentum supports the short-term bullish outlook. Weekly Pivot Points: WR3 - 1.3491 WR2 - 1.3401 WR1 - 1.3359 Weekly Pivot - 1.3256 WS1 - 1.3209 WS2 - 1.3108 WS3 - 1.3061 Trading Recommendations: The GBP/USD pair is in the down trend on the monthly time frame, but the recent bounce from the low at 1.1411 made in the middle of March 2020 looks very strong and might be a reversal swing. In order to confirm the trend change, the bulls have to break through the technical resistance seen at the level of 1.3518. All the local corrections should be used to enter a buy orders as long as the level of 1.2674 is not broken. 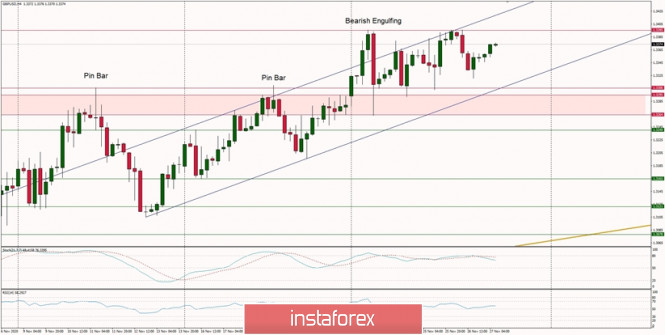
EUR/USD: plan for the European session on November 27. COT reports. ECB minutes weigh on euro 2020-11-27 To open long positions on EUR/USD, you need: In my morning forecast, I paid attention to buy positions from the 1.1929 level after a breakout and getting the pair to settle above this range, which happened. I marked an entry point for long deals after testing the 1.1929 level from top to bottom on the 5-minute chart. However, the bullish momentum failed to find support among major players, which ultimately led to a change in market sentiment. Returning and being able to settle below 1.1929 could have produced a good entry point for short positions, however, according to my trading strategy, this level was not tested upwards. If you read the afternoon forecast, then I was talking about the probability of buying in the support area of 1.1885. As you can see on the chart, testing this level led to a rapid upward reversal, which returned the pair to the 1.1929 resistance area during today's Asian session. 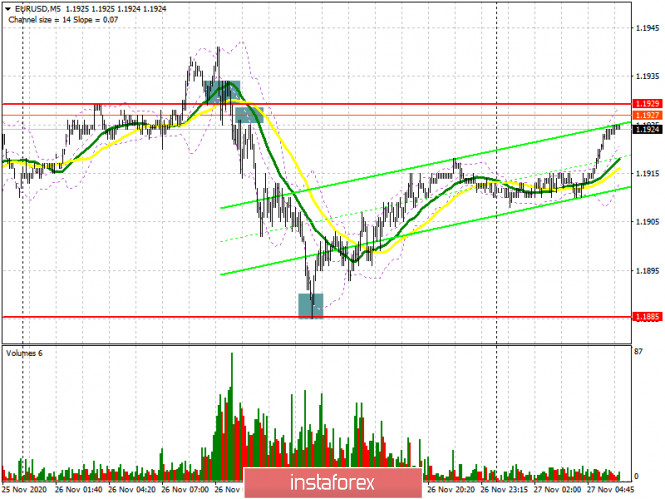
No important fundamental reports scheduled for release today, except for the report on the indicator of consumer confidence in the eurozone, which may turn out to be worse than economists' forecasts, which will put pressure on the euro. However, French GDP data will attract attention in the first half of the day, which is unlikely to affect the market. Good indicators will help the bulls in coping with their initial target, which is to break and settle at the 1.1929 high, testing it from top to bottom (similar to yesterday, which I analyzed above) provides a fairly convenient entry point into long positions in hopes for the euro to rise and reach a new level of 1.1964, where I recommend taking profits. The bulls will still aim for resistance of 1.2008, which is also psychological in nature. In case EUR/USD falls back to the 1.1885 area in the first half of the day, forming a false breakout there will be a signal to open long positions. If bulls are not active at this level, I recommend not to rush with long deals, but to wait for a downward correction to the support area of 1.1844, from where you can buy the euro immediately on a rebound, counting on an upward correction of 15-20 points. A larger support level is seen only at this week's low in the 1.1802 area, where you can also buy the euro immediately on the first test. To open short positions on EUR/USD, you need: The sellers' initial task is to return the 1.1885 level to themselves, where they have had huge problems for the second consecutive day. Even a negative report from the European Central Bank failed to influence buyers' sentiment at this level. Getting the pair to settle below 1.1885 and testing it from the bottom up provides a more convenient entry point for short positions, in hopes to bring back the downward trend. In this case, the nearest target will be the low of 1.1844, from which it was possible to observe the pair's active growth quite recently. However, updating this level will only be an indication that the trade is still in a horizontal channel. A breakout and being able to settle below this range will lead EUR/USD to the area of weekly lows at 1.1802, where I recommend taking profits. If the bulls turn out to be stronger and continue to push the pair after data on the French economy has been published, then it is best not to rush to sell, but to wait until a false breakout forms in the resistance area of 1.1929, which will be a signal to open short positions in the euro. I have analyzed an example of opening short positions from the 1.1929 level, see the 5-minute chart, where the entry point is shown after forming a false breakout and being able to return below the 1.1929 level. I recommend selling EUR/USD immediately on a rebound but only from a high of 1.1964, counting on a correction of 15-20 points within the day. 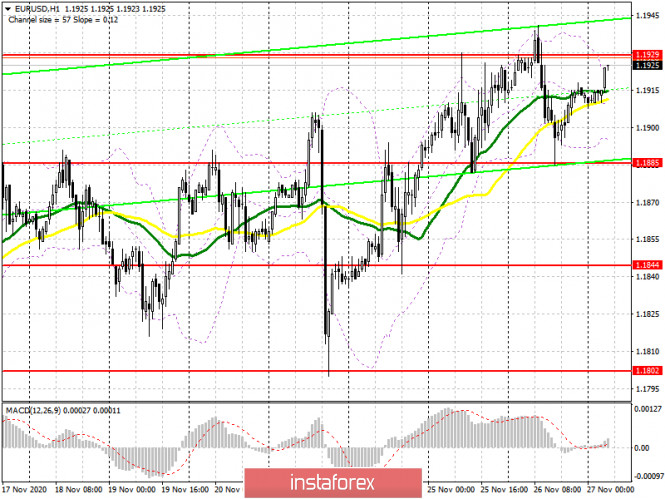
The COT report for November 17 showed an increase in long and short positions. Despite this, buyers of risky assets believe that the bull market will continue since the delta is on their side. Long non-commercial positions rose from 202,374 to 203,551, while short non-commercial positions increased from 67,087 to 69,591. The total non-commercial net position fell from 135,287 to 133,960 a week earlier. Take note that the delta has been declining for eight consecutive weeks, which confirms the euro buyers' reluctance to enter the market in the current conditions. We can talk about the euro's recovery only when European leaders have settled differences with Poland and Hungary, and also when the UK negotiates a new trade deal with Brussels. Otherwise, you will have to wait until restrictive measures have been lifted, which were implemented due to the second wave of coronavirus in many EU countries. Indicator signals: Moving averages Trading is carried out just above 30 and 50 moving averages, which indicates the euro's succeeding growth in the short term. Note: The period and prices of moving averages are considered by the author on the H1 hourly chart and differs from the general definition of the classic daily moving averages on the D1 daily chart. Bollinger Bands A breakout of the upper border of the indicator around 1.1930 will lead to a new wave of euro growth. In case the pair falls, support will be provided by the lower border at 1.1895. Description of indicators - Moving average (moving average, determines the current trend by smoothing out volatility and noise). Period 50. It is marked in yellow on the chart.
- Moving average (moving average, determines the current trend by smoothing out volatility and noise). Period 30. It is marked in green on the chart.
- MACD indicator (Moving Average Convergence/Divergence — convergence/divergence of moving averages) Quick EMA period 12. Slow EMA period to 26. SMA period 9
- Bollinger Bands (Bollinger Bands). Period 20
- Non-commercial speculative traders, such as individual traders, hedge funds, and large institutions that use the futures market for speculative purposes and meet certain requirements.
- Long non-commercial positions represent the total long open position of non-commercial traders.
- Short non-commercial positions represent the total short open position of non-commercial traders.
- Total non-commercial net position is the difference between short and long positions of non-commercial traders.
GBP/USD: plan for the European session on November 27. COT reports. Pound keeps pushing in the channel 2020-11-27 To open long positions on GBP/USD, you need: In yesterday's morning forecast, I advised you to open short positions when a false breakout is formed in the resistance area of 1.3395, which is what happened. If you look at the 5-minute chart, you will see how the bulls made an unsuccessful attempt to rise above the 1.3395 level, afterwards a signal to sell the pound appeared, which pulled down the pair to the support area of 1.3354, where the downward trend initially stopped. The bears broke through this range in the afternoon, and testing it from the bottom up formed an additional entry point for short positions, as a result of which the downward movement was about 35 points. But the bulls managed to regain control of the 1.3354 level towards the end of the US session, which led to forming a horizontal channel. 
And although we do not expect any news regarding Brexit today, the pound's succeeding direction still depends on it. Also, the direction can be determined by support at 1.3354, which will be emphasized in the morning. A false breakout on it produces a good entry point into long positions while aiming to return to the weekly high of 1.3395. Serious problems may arise with the pound's succeeding growth if this level is not updated. Let me remind you that quite recently, the president of the European Commission said that so far there has been no progress in the talks, and the chief negotiator from the EU side, Michel Barnier, noted his readiness to withdraw from negotiations if the UK does not make concessions. Being able to settle above the 1.3395 level and testing it from top to bottom provides a fairly good signal for buying GBP/USD in order for it to rise to the 1.3453 area. The next target will be a high of 1.3509, where I recommend taking profits. In case the pound falls in the first half of the day and it is not active around 1.3354, it is best to postpone long deals until the lower limit of the 1.3305 horizontal channel has been updated, in which the pair has been staying this whole week. You can buy the pound there immediately on a rebound, counting on an upward correction of 15-20 points. To open short positions on GBP/USD, you need: The bears are still looking to regain control over the 1.3354 level, which they missed in today's Asian session. Only its breakout and being able to settle below, similar to the entry point into short positions that I analyzed above, will return new large sellers to the market, which will quickly pull down GBP/USD to the lower limit of the 1.3305 horizontal channel, where I recommend taking profit. We can talk about bringing back the bear market only when we have gone beyond 1.3305, which will lead to removing a number of buyers' stop orders and the pair's fall to a low of 1.3251. If bulls make another attempt to break through the monthly highs in the first half of the day, then I recommend considering new short positions only after forming a false breakout at the 1.3395 level. In the absence of activity there, it is best to refuse to sell until a new high in the 1.3453 area has been updated, where you can sell the pound immediately on a rebound, counting on a correction of 20-30 points within the day. 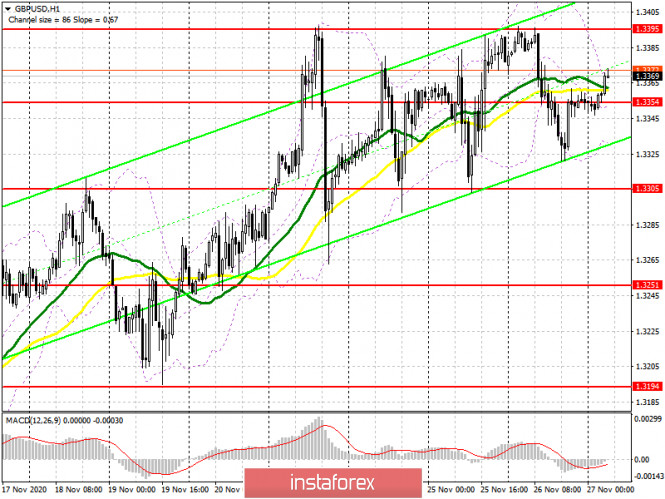
The Commitment of Traders (COT) reports for November 17 saw a reduction in long positions and a sharp inflow of short positions. Long non-commercial positions declined from 27,872 to 27,454. At the same time, short non-commercial positions increased from 45,567 to 47,200. As a result, the negative non-commercial net position was -19,746 against -17,695 a week earlier, which indicates that the sellers of the British pound retains control and also shows their slight advantage in the current situation. Lack of clarity on the trade deal, together with the lockdown of the British economy in November, clearly does not add optimism and confidence to buyers of the pound. Indicator signals: Moving averages Trading is carried out in the area of 30 and 50 moving averages, which indicates uncertainty regarding the pound's succeeding direction. Note: The period and prices of moving averages are considered by the author on the H1 hourly chart and differs from the general definition of the classic daily moving averages on the D1 daily chart. Bollinger Bands A breakout of the upper border of the indicator around 1.3368 will lead to a new wave of growth for the pound. In case the pair falls, support will be provided by the lower border at 1.3333. Description of indicators - Moving average (moving average, determines the current trend by smoothing out volatility and noise). Period 50. It is marked in yellow on the chart.
- Moving average (moving average, determines the current trend by smoothing out volatility and noise). Period 30. It is marked in green on the chart.
- MACD indicator (Moving Average Convergence/Divergence — convergence/divergence of moving averages) Quick EMA period 12. Slow EMA period to 26. SMA period 9
- Bollinger Bands (Bollinger Bands). Period 20
- Non-commercial speculative traders, such as individual traders, hedge funds, and large institutions that use the futures market for speculative purposes and meet certain requirements.
- Long non-commercial positions represent the total long open position of non-commercial traders.
- Non-commercial short positions represent the total short open position of non-commercial traders.
- Total non-commercial net position is the difference between short and long positions of non-commercial traders.
Indicator analysis. Daily review for the EUR/USD currency pair 27/11/2020 2020-11-27 Trend analysis (Fig. 1) Today, the market will try to continue moving up from the level of 1.1912 (the closing of yesterday's daily candle), with the goal of 1.1947 which is the historical resistance level (blue dotted line). In the case of testing this level, working up to the level of 1.2900 is the upper limit of the Bollinger line indicator (black dotted line).  Figure 1 (daily chart) Complex analysis: - Indicator Analysis – up
- Fibonacci Levels – up
- Volumes – up
- Candle Analysis – up
- Trend Analysis – up
- Bollinger Bands – up
- Weekly Chart – up
General conclusion: Today, from the level of 1.1912 (the closing of yesterday's daily candle), the price will try to continue moving up with the goal of 1.1947 which is the historical resistance level (blue dotted line). In the case of testing this level, working up to the level of 1.2900 is the upper limit of the Bollinger line indicator (black dotted line). Alternative scenario: When moving up and testing the upper fractal (daily candle from 26.11.2020), the price may start moving down with a target of 1.1891 which is a pullback level of 14.6% (red dotted line). Simplified wave analysis and forecast for GBP/USD, USD/JPY, and USD/CHF on November 27 2020-11-27 GBP/USD Analysis: The large scale of the British pound chart since March this year shows an upward momentum. Its last section counts down from September 10. The price reached intermediate resistance. The hidden correction is not completed in the wave structure. Forecast: Today, the flat is expected to continue in the corridor between the opposite zones. After an attempt to pressure the resistance zone, a reversal and decline are likely up to the support level. After that, the ascent will continue. Potential reversal zones Resistance: - 1.3380/1.3410 Support: - 1.3280/1.3250 Recommendations: Selling the British pound today is risky. It is recommended to look for signals to enter long positions at the end of the upcoming decline. 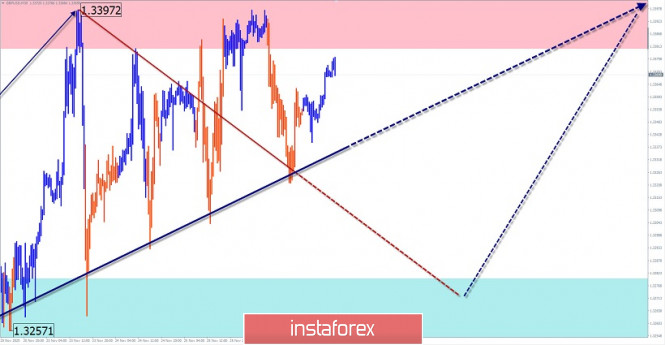
USD/JPY Analysis: Incomplete wave construction of the Japanese yen is bearish, from November 9. The first two parts (A-B) are formed in the structure. On November 23, the final part (C) started. The price reached the upper limit of the potential small-scale reversal zone. Before the price goes down further, it is necessary to work out an intermediate pullback. Forecast: Today, you can expect the pair to move in the price corridor between the nearest zones. After pressure on the support zone, a reversal and rise to the resistance area is expected. You can expect a return to the main exchange rate at the end of the day or at the beginning of the next trading week. Potential reversal zones Resistance: - 104.30/104.60 Support: - 103.80/103.50 Recommendations: Today, trading is only possible within the intraday. Purchases can be unprofitable. It is recommended to refrain from entering the market during the upcoming price growth and look for sell signals at the end of it. 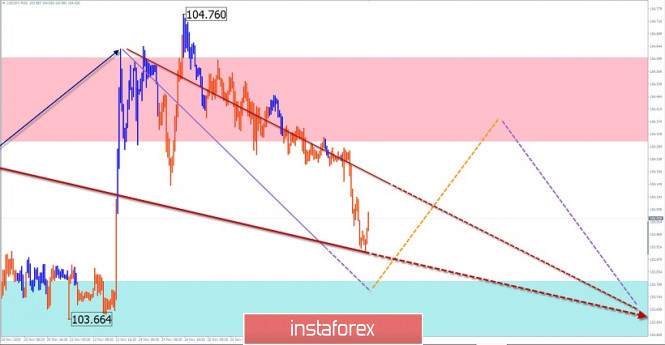
USD/CHF Analysis: On the hourly chart of the Swiss franc, the incomplete rising wave from November 6 sets the dominant rate. In the last 3 weeks, the price is adjusted. This phase of the price movement is close to completion. Forecast: A mostly downward trend is expected in the next 24 hours. The boundaries of the probable daily course are indicated by calculated zones. A short-term price increase is possible in the European session. A return to the main exchange rate is likely at the end of the day. Potential reversal zones Resistance: - 0.9090/0.9120 Support: - 0.9030/0.9000 Recommendations: Trading on the pair's market today is possible within the intra-session style, with a reduced lot. Purchases are not recommended. Sell signals should be looked for in the area of the calculated resistance. 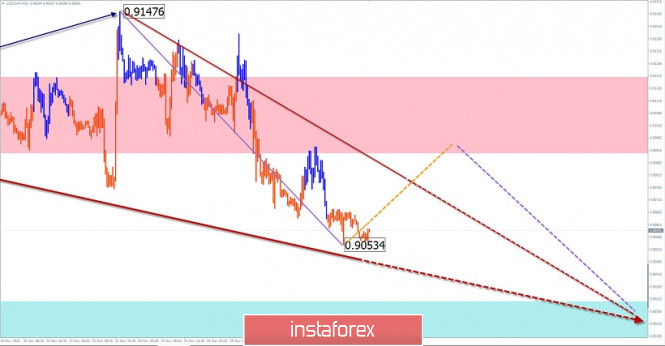
Explanation: In the simplified wave analysis (UVA), waves consist of 3 parts (A-B-C). The last incomplete wave is analyzed. The solid background of the arrows shows the formed structure, and the dotted one shows the expected movements. Note: The wave algorithm does not take into account the duration of the instrument's movements in time! Indicator analysis. Daily review for the GBP/USD currency pair 27/11/2020 2020-11-27 Trend analysis (Fig. 1). Today, the market will try to continue moving up from the level of 1.3351 (the closing of yesterday's daily candle) with the goal of 1.3393 which is the historical resistance level (blue dotted line). When this line is reached, the price can continue to move up with the goal of 1.3436 which is the target level of 161.8% (blue dotted line). 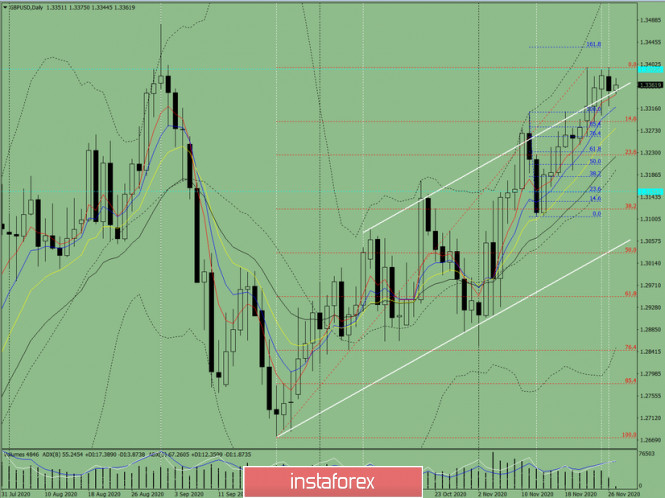 Figure 1 (daily chart) Complex analysis: - Indicator Analysis – up
- Fibonacci Levels – up
- Volumes – up
- Candle Analysis – up
- Trend Analysis – up
- Bollinger Bands – up
- Weekly Chart – up
General conclusion: Today, from the level of 1.3351 (closing of yesterday's daily candle), the price will try to continue moving up with the goal of 1.3393 which is the historical resistance level (blue dotted line). When this line is reached, the price can continue to move up with the goal of 1.3436 which is the target level of 161.8% (blue dotted line). Alternative scenario: When moving up and reaching the historical resistance level of 1.3393 (blue dotted line), the price may start moving down with the target of 1.3290 which is a pullback level of 14.6% (red dotted line). AUD/USD: Next goal is the level of 0.7430 2020-11-27 The US dollar index continued to decline towards the level of 0.91 again, after a temporary correction. The indicator was at such a low level more than two years ago, during the 2018 spring. Therefore, the inability of dollar bulls to develop more or less large-scale corrective growth suggests that the US dollar is unwelcomed in the currency market. In the context of the AUD/USD pair, this means that reaching the resistance level of 0.7430 (the upper line of the Bollinger Bands indicator on the daily chart) is only a matter of time. On the other hand, the market is already preparing for next week's events, which will be a lot and volatile, since today's economic calendar is quite empty. The US dollar is under pressure due to a combination of fundamental factors, which it fails to cope with. For example, any more or less large-scale corrective recession is used by AUD traders as a reason to open longs. The main driving force behind the growth of the AUD/USD pair is the weakening US dollar, which may strengthen its decline throughout the market next week. The Australian currency, in turn, is preparing for RBA's last meeting this year, which will be held next Tuesday, December 1. 
In terms of economic data, US Nonfarm will be published next Friday. However, the market already expects disappointing key data on the US labor market. Such conversations appeared after one of the more operational indicators of the US labor market was published – growth of initial applications for unemployment benefits. This indicator entered the red zone again, disappointing dollar bulls. This has been growing for the second week in a row, gradually approaching the 800 thousandth value and showed a stable downward trend from the end of September to the beginning of November. The publication of data on American spending and income were also disappointing. Here, the level of personal consumer income declined to the level of -0.7%, with a forecasted decline to zero. This is the weakest result since August this year. On the other hand, personal spending showed a similar trend, dropping to 0.5% from the previous value of 1.2%. The Core PCE Price Index also dropped to zero in monthly terms, which is the worst result since April while in annual terms, it slowed to 1.4%. These are quite alarming signals that indicate that key data on the labor market may come out in the "red zone", indicating negative trends. The above releases have reminded traders once again the consequences of the second wave of COVID-19 in the US. The US dollar is also under pressure from the coronavirus, which continues to update anti-records in the States, forcing many governors to tighten quarantine restrictions within their regions Hence, the growth in the number of unemployed. The situation worsened significantly in October-November, when the daily cases increased from 46 thousand (October 1) to 180 thousand (November 27). Amid such disastrous tendencies, the US dollar is still managing to defend itself well. In my opinion, the market overestimates the miracle of the COVID-19 vaccine. According to various estimates, the vaccination process will take from 4 to 9 months, since it will not be possible to vaccinate the entire population of the country at once. Therefore, the coronavirus factor will continue to put pressure on the dollar in the near future. The local lockdowns and the Fed's "dovish" monetary policy will contribute to this. In turn, the Australian dollar feels quite optimistic with the future, at least in the medium term. Australia's latest data on the labor market suggests that RBA members will take a wait-and-see attitude next week. It should be noted that the growth rate of the number of employed in October soared, reaching 178 thousand (with a forecasted decline of 29 thousand). This is the strongest growth rate since June this year, when Australia began to lift the lockdown. This result allows us to count on optimistic assessments from the members of the Australian regulator. Another factor that contributes to the growth of the AUD is the early lifting of strict restrictive measures in South Australia, as there are almost no new cases of COVID-19 in the country. 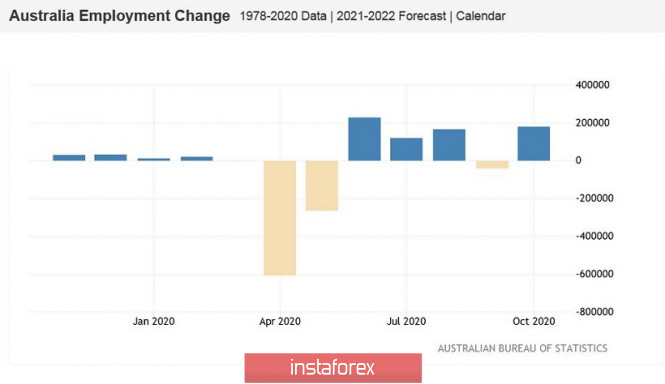
Therefore, the AUD/USD pair in the medium-term may test another resistance, that is, the level of 0.7430 (upper line of the Bollinger Bands indicator on the daily time frame). Technically, the pair is also inclined upwards. Its price on the same time frame is still between the middle and upper lines of the Bollinger Bands indicator, and the Ichimoku indicator still shows the bullish "Parade of Lines" signal. GBP/USD. November 27. COT report. The European Union and France accuse the UK of unwillingness to reach compromises and of dragging out negotiations 2020-11-27 GBP/USD – 1H. 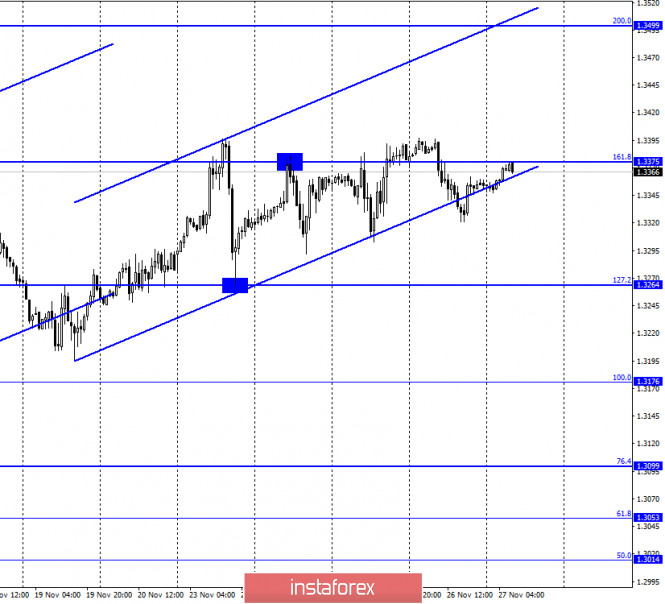
According to the hourly chart, the quotes of the GBP/USD pair performed a new reversal in favor of the US currency and consolidated under the upward trend corridor. They spent several hours below this corridor, after which they tried to resume the growth process. However, they immediately ran into the corrective level of 161.8% (1.3375). Thus, the pair's rebound from this level will work again in favor of the US dollar and will lead to a more obvious closing under the ascending corridor. Meanwhile, traders' faith in reaching a trade agreement with the European Union is slowly fading. This week, the British pound failed to move further up, so there is a high probability that the mood of traders will still change to "bearish". And the situation around the negotiations began to heat up. Last week, the talks were interrupted. This week, they were held in video format, however, by the end of the week, it became clear again that the negotiations were at an impasse and Michel Barnier threatened London that if it is not more lenient, Brussels will withdraw from the discussion of the deal. London replied that it would like to resume negotiations in London face-to-face, however, everything depends on the European Union. At the same time, Paris accused the UK of dragging out negotiations, focusing on minor details while the most important issues are not being resolved. Paris also said that France will not give in to the issue of fishing. Thus, all participants in the negotiation process continue to find it difficult to find a common language, and the negotiations themselves can end at any time. GBP/USD – 4H. 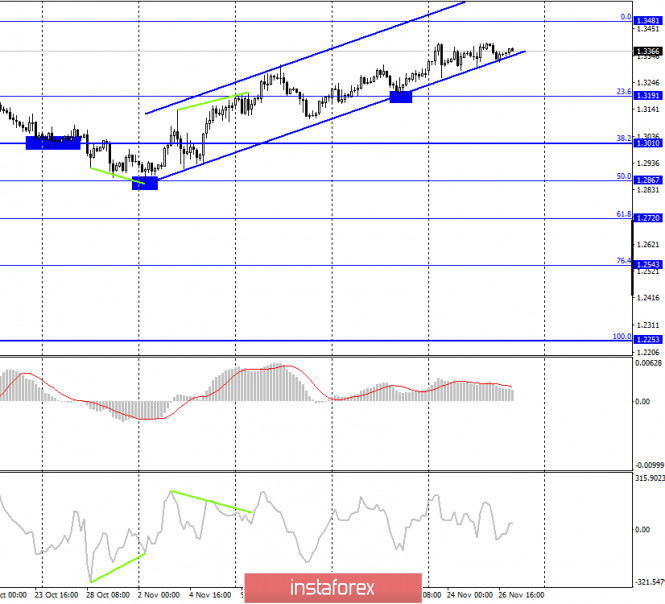
On the 4-hour chart, the GBP/USD pair generally continues to grow in the direction of the corrective level of 0.0% (1.3481). The upward trend corridor shows that the current mood of traders remains "bullish". Fixing the pair's rate under this corridor will work in favor of the US currency and the beginning of a fall in quotes towards the levels of 1.3191 and 1.3010. GBP/USD – Daily. 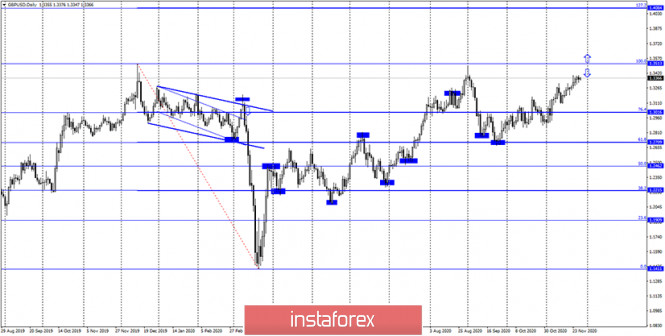
On the daily chart, the pair's quotes continue to grow in the direction of the corrective level of 100.0% (1.3513). However, when trading a pair, I recommend paying more attention to the lower charts. They are now more informative. Two corridors are especially important, one of which the quotes have already left. GBP/USD – Weekly. 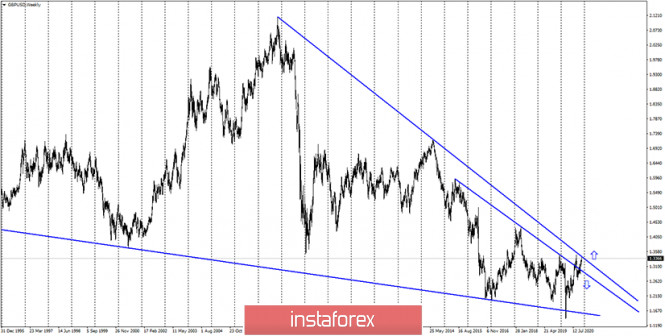
On the weekly chart, the pound/dollar pair completed a new close above the lower downward trend line, although a false breakout of this line followed earlier. In recent weeks, the pair has made new attempts to gain a foothold over both trend lines. Overview of fundamentals: There were no reports or major events in the UK and the US on Thursday. The information background on this day was practically absent. US and UK news calendar: On November 27, the US and UK news calendars are empty again. Today, there will be no information background, however, there may be news on the negotiation process between London and Brussels. COT (Commitments of Traders) report: 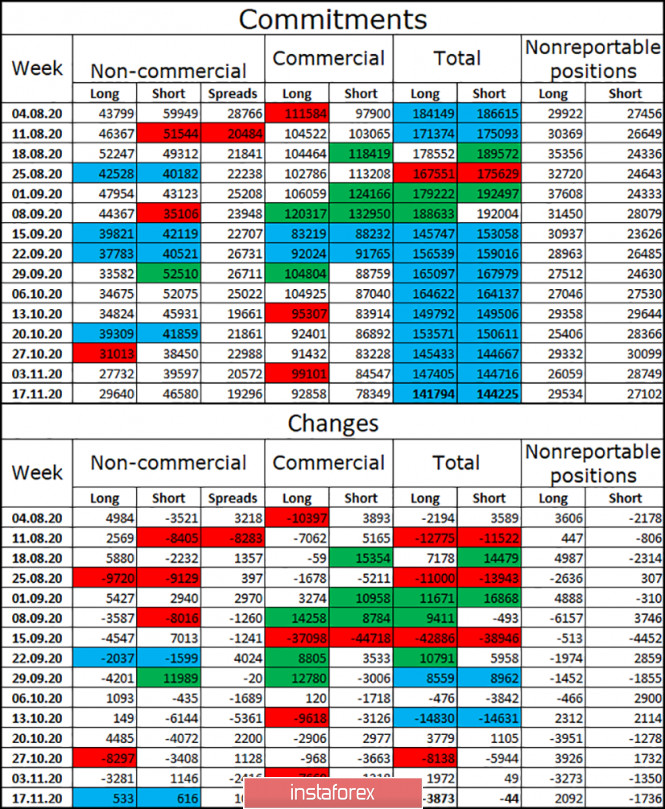
The last two COT reports showed a fairly sharp increase in the number of open short contracts for the "Non-commercial" category of traders. This suggests that speculators continue to believe in the fall of the British dollar in the very near future. Over the past three weeks, speculators have been building up short contracts and closing long ones. In general, major players are more afraid of opening new contracts, so their total number is falling. This is seen in the table above. Thus, conclusion number one: major players are afraid of the uncertainty associated with the trade deal and the British economy, so they do not want to trade the pound more actively. Conclusion number two: speculators believe more in the fall of the pound than in its growth. GBP/USD forecast and recommendations for traders: Today, I recommend selling the GBP/USD pair with targets of 1.3264 and 1.3191 if a close is made under the ascending corridor on the 4-hour chart or under the ascending corridor on the hourly chart. I recommend to be careful with the pair's purchases now, as the COT report shows the faith of major players in the fall of the pound, and there is still no trade deal between London and Brussels. Terms: "Non-commercial" - major market players: banks, hedge funds, investment funds, private, large investors. "Commercial" - commercial enterprises, firms, banks, corporations, companies that buy currency not for speculative profit, but for current activities or export-import operations. "Non-reportable positions" - small traders who do not have a significant impact on the price. EUR/USD. November 27. COT report. ECB minutes confirm Christine Lagarde's concerns. 2020-11-27 EUR/USD – 1H. 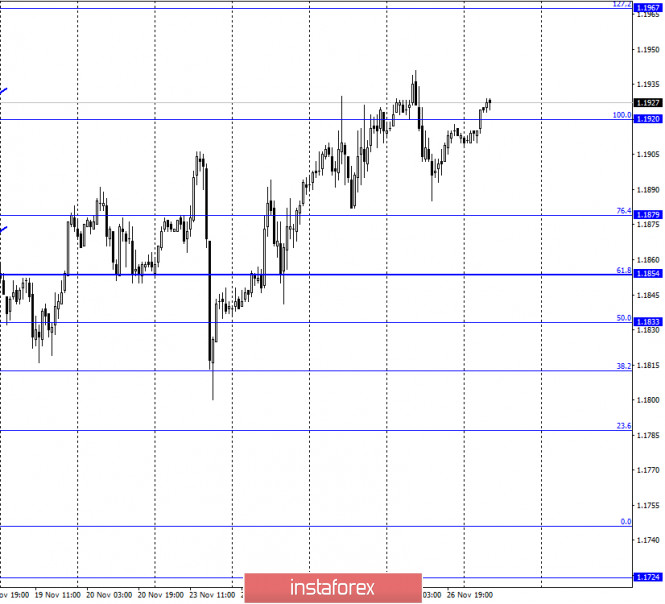
On November 26, the EUR/USD pair performed a new reversal in favor of the European currency and started a new growth process, closing above the corrective level of 100.0% (1.1920). Thus, the growth can be continued in the direction of the corrective level of 127.2% (1.1967). There were very few reports and news yesterday. The European Central Bank protocol was perhaps the most interesting event. However, as was the case with the Fed minutes a little earlier, traders did not learn anything new from it. And even more so, this information could not lead to the growth of the euro currency, which leaves more questions unanswered about its weak growth. Earlier, Christine Lagarde said in several speeches that the European economy may face new problems at the end of 2020 due to an increase in the number of diseases, due to the "lockdowns" introduced in November, and which may be extended in December. Moreover, doctors in many countries of the world are also talking about the third wave that can sweep the world. Thus, Lagarde noted the fact of creating a vaccine against coronavirus but urged not to rejoice ahead of time. Approximately the same was said in the protocol. The EU economy, according to ECB members, will recover long and hard after the crisis. Thus, the European economy will need an additional stimulus in almost any case. However, all this information, although very interesting, did not cause a strong reaction from traders. Like the Fed minutes. The euro/dollar pair continues to trade rather inactive, as can be seen from the 4-hour chart. EUR/USD – 4H. 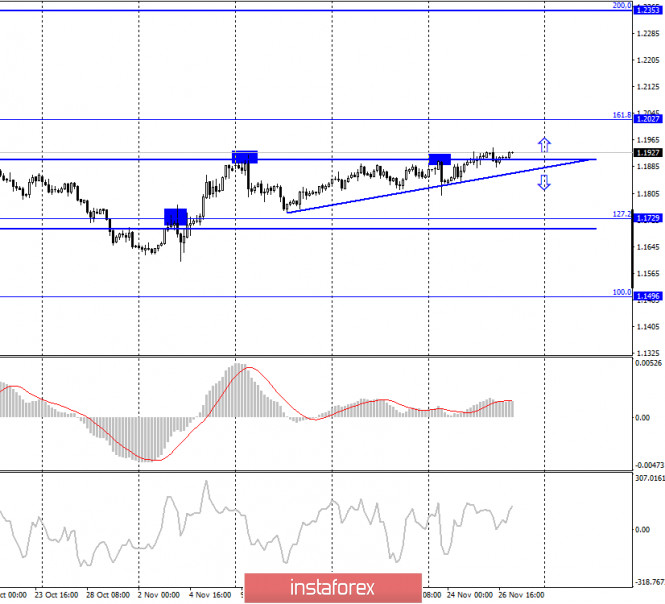
On the 4-hour chart, the pair's quotes were fixed above the upper border of the side corridor. Thus, the growth process can now be continued towards the next corrective level of 161.8% (1.2027). Today, the divergence is not observed in any indicator. The pair finally has a chance to start building a new trend. EUR/USD – Daily. 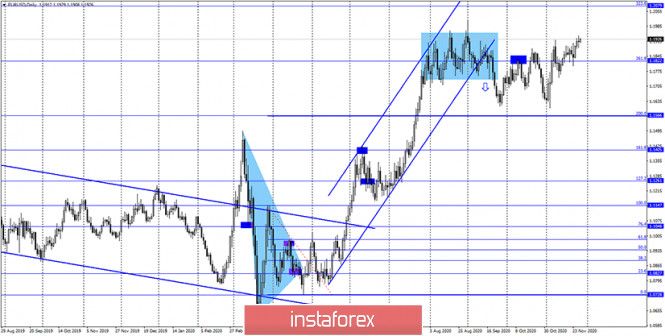
On the daily chart, the EUR/USD pair quotes performed a new consolidation above the corrective level of 261.8% (1.1822), which increases the chances of further growth. However, this level remains weak. Last time, the growth of quotes was interrupted several times around the level of 1.1960. EUR/USD – Weekly. 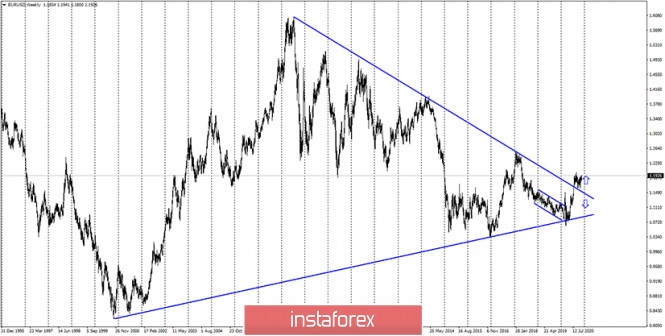
On the weekly chart, the EUR/USD pair performed a consolidation above the "narrowing triangle", which preserves the prospects for further growth of the pair, but in the long term. In the short term, a drop is preferable. Overview of fundamentals: On November 26, America and the European Union did not have a single economic report. Thus, the information background was extremely weak. News calendar for the United States and the European Union: On November 26, the economic event calendars in America and the European Union are empty again. The information background will be almost zero today, so trading activity is likely to remain weak. COT (Commitments of Traders) report: 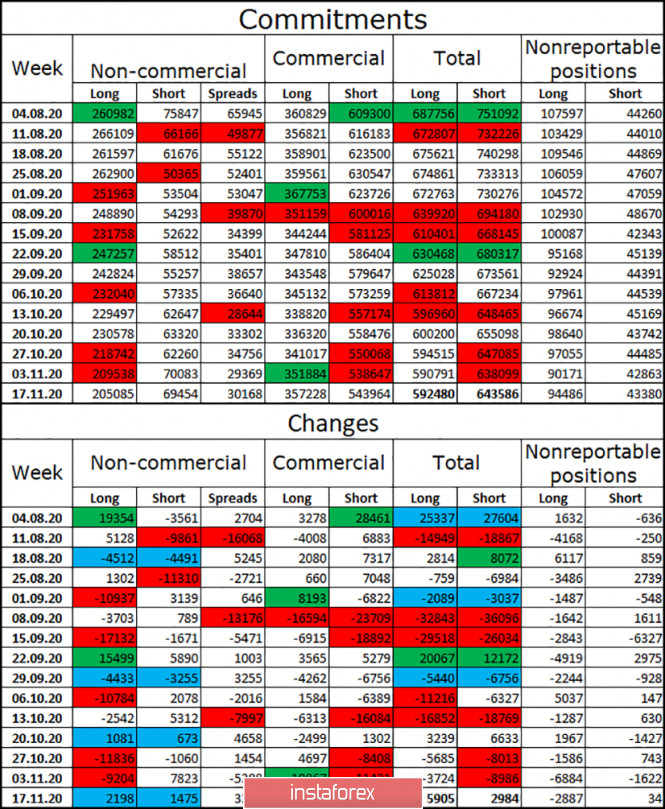
The penultimate COT report was released with some delay, so here I will analyze the changes in two reports at once. Fortunately, there are almost no changes. As well as the price changes of the euro/dollar pair in the last few months, which is visible on the 4-hour chart. Over the last two reporting weeks, the number of long contracts in the hands of the "Non-commercial" category of traders decreased by 4.5 thousand, and the number of short contracts - by 0.5 thousand. During the last reporting week, speculators opened approximately the same number of long and short contracts. Thus, in general, the changes are insignificant. The mood of speculators became a little more "bearish", but again slightly. There are even fewer changes in other categories of traders. The most important thing I would like to note is that the mood of major players is not becoming more "bullish", which means that the COT report does not indicate a resumption of the upward trend now. EUR/USD forecast and recommendations for traders: Today, I recommend selling the euro with a target of 1.1920, if the rebound from the level of 161.8% (1.2027) on the 4-hour chart is completed. Purchases of the pair had to be opened by fixing quotes above the side corridor on the 4-hour chart with the target level of 1.2027. However, it may take several days for the pair to reach their destination. Terms: "Non-commercial" - major market players: banks, hedge funds, investment funds, private, large investors. "Commercial" - commercial enterprises, firms, banks, corporations, companies that buy currency not for speculative profit, but for current activities or export-import operations. "Non-reportable positions" - small traders who do not have a significant impact on the price. Forex forecast 11/27/2020 on USD/JPY, AUD/USD, Gold and SP500 from Sebastian Seliga 2020-11-27 As the event calendar is empty today, let's take a look at the technical picture of USD/JPY, AUD/USD, Gold and SP500 in the last trading day of the week. EUR/USD: The euro is struggling to move due to a number of reasons. 2020-11-27 The European Central Bank published the minutes of its last meeting yesterday, which contained rather negative outlook for the eurozone economy. The current despondent state of the bloc could lead to the further expansion of the ECB's bond purchase program and additional stimulus. However, such an approach is likely to weaken the position of the euro against other world currencies. 
At the moment, the euro is struggling to move in a clear direction, mainly due to a number of reasons. One is the dispute over the US presidential elections, while another is the expectations that a massive stimulus program will be adopted in the US as soon as Joe Biden takes office, both of which support the euro. The other one, which drags demand for the European currency down, is the possible extension of quarantine measures, since COVID-19 incidence continues to increase in many European states. Yesterday, German Chancellor Angela Merkel urged the citizens to fight more actively against the virus. According to her, if more and more citizens fall under the grasp of the virus, the country may face an overloading in the healthcare system. Merkel also said the partial lockdown in Germany will be extended until at least December 20, while other restrictions will remain until early January 2021. If the situation fails to stabilize, the restrictions may be extended until March next year. On the topic of economic outlook for the euro area, the European Central Bank published the minutes of its last meeting yesterday, which contained rather negative prospects for the EU economy. Nonetheless, the central bank announced a wait-and-see attitude, in which the decision to change the monetary policy will be made on the basis of fresh data on the epidemiological situation in the eurozone, as well as on the basis of reports showing how much economic growth is slowing down and how quickly the unemployment rate is rising in the area. As for inflation expectations, they, on the contrary, decreased, which put downward pressure on risky assets. Inflation is expected to remain negative for the rest of this year, which will only increase the risk of deflation. Other macroeconomic reports were also published yesterday, one of which is data on France's consumer confidence. The latest statistics indicate the index fell to a 2-year low, dropping to 90 points against 94 points in October. Such deterioration is associated with the situation on the labor market, in which the country's unemployment rate is expected to jump 1.9% in the third quarter. The rest of economic reports, which will more fully clarify the state of France's economy, will be released today. With regards to the EUR/USD pair, the bulls are still looking towards the sharp strengthening of the European currency, but for this, the quotes need to get above the level of 1.1930. It is only by this that the euro will be able to move towards the 20th figure, and a breakout from 1.2008 will lead in a further move to 1.2060 and 1.2110. But if the quote returns to 1.1880, the euro will collapse to 1.1840 and then head to the 18th figure. Trading plan for the EUR/USD pair on November 27. Growth in COVID-19 incidence has stalled. The euro may continue climbing up, but other scenarios are also possible. 2020-11-27 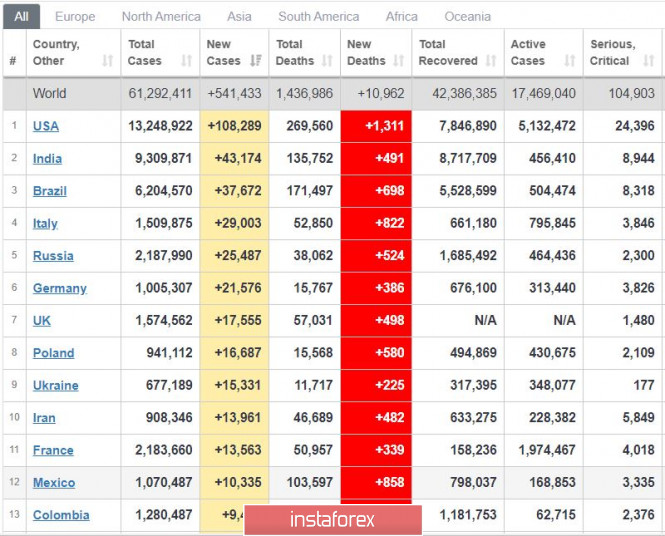
It seems that the situation with the coronavirus has finally stabilized, since global COVID-19 incidence has again decreased significantly. The day before, the overall number of new cases was 610,000, while yesterday it was 541,000 (lower by 10%). In the US, daily incidence was 180,000 two days ago, while yesterday it was 108,000. The situation in Europe has also stabilized. With regards to the vaccine, Pfizer's drug may receive approval by December 10. Moderna's, meanwhile, may come at a later date. In any case, mass vaccinations are expected to begin on December 11. As for AstraZeneca's COVID-19 vaccine, questions were raised about the test results, but that doesn't seem to stop regulators. 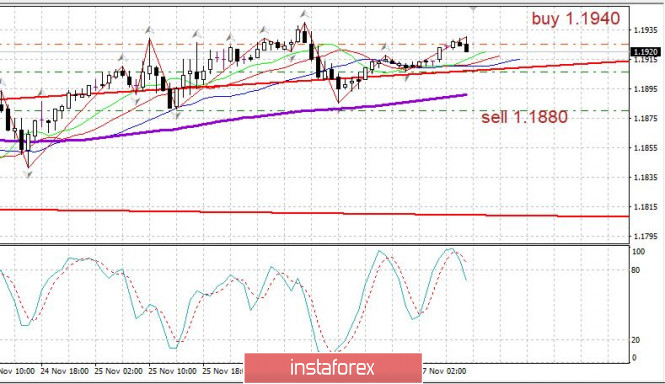
EUR/USD - the market is still sluggish, but the technical picture indicates a possible growth in the euro. Retain long positions at 1.1906, but be ready to change into short positions, from 1.1880 to 1.1925. Technical analysis of GBP/USD for November 27, 2020 2020-11-27 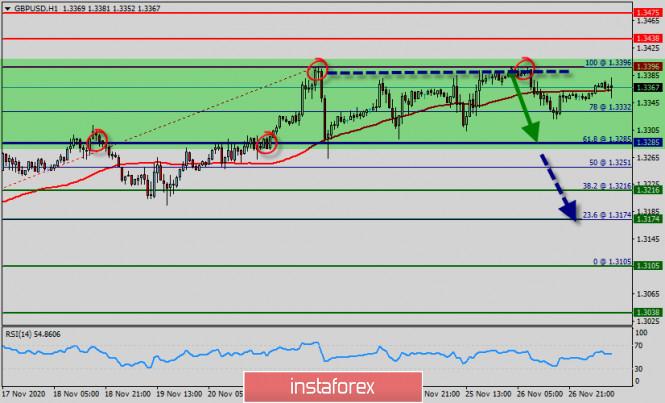 Overview : - Pair : GBP/USD.
- Pivot : 1.3285.
- Trend : Sideways.
- Forecast : Bearish market.
- Range : 1.3396 -1.3285
The GBP/USD pair is trying to settle below the top of 1.3396.The trend of GBP/USD pair movement was controversial as it took place in a narrow sideways channel, the market showed signs of instability. Amid the previous events, the price is still moving between the levels of 1.3396 and 1.3285. If the GBP/USD pair declines below the level of 1.3396, it will gain downside momentum and head towards the next support at the yearly lows at 1.3285 which will be bearish for GBP/USD. The nearest resistance level for the GBP/USD pair is located at the recent highs at 1.3396, although the GBP/USD pair may also face some resistance at the high of the previous trading day at 1.3396. This week, the market moved from its bottom at 1.3285 and continued to rise towards the top of 1.3396. Today, in the one-hour chart, the current drop will remain within a framework of correction. This would suggest a bearish market because the RSI indicator is still in a negative area and does not show any trend-reversal signs. The pair is expected to drop lower towards at least 1.3285 with a view to test the daily pivot point. However, if the pair fails to pass through the level of 1.3396, the market will indicate a bearish opportunity below the strong resistance level of 1.3396 (the level of 1.3396 coincides with the double top too). Sell deals are recommended below the level of 1.3396 with the first target at 1.3285. If the trend breaks the support level of 1.3285, the pair is likely to move downwards continuing the development of a bearish trend to the level 1.3216 in order to test the daily support 2 (horizontal green line). On the support side, the nearest support level for the GBP/USD pair is located at 1.3216. If the GBP/USD pair declines below this level, it will head towards the next support at 1.3174. A move below this support level will open the way to the test of the support at the 50 EMA at 1.3174. The price spot of 1.3396 remains a significant resistance zone. Thus, the trend is still bearish as long as the level of 1.3400 is not breached. At the same time, if a breakout happens at the support levels of 1.3400, then this scenario may be invalidated. But in overall, we still prefer the bearish scenario. Technical analysis of EUR/USD for November 27, 2020 2020-11-27 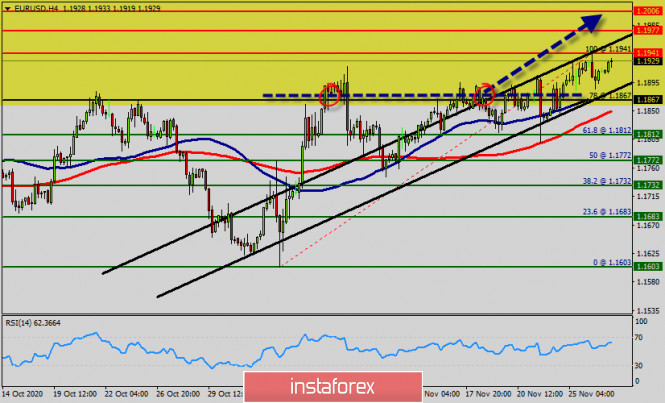 Overview : The EUR/USD pair is in uptrend without any reversal patterns because there is nothing new in this market, it is not bearish yet. Since the third November 2020, the EUR/USD pair continued moving upwards from the bottom of 1.1603. So, the pair rose from the level of 1.1603 to the top around 1.1941. The bulls remain in control. Simply because price action is above most of the moving averages (50 and 100) on multiple time frames. The key breakout would be above the 1.1941 resistance. The RSI starts signaling an upward trend, as the trend is still showing strength above the moving average (100) and (50). Thus, the market is indicating a bullish opportunity above 1.1867 . Currently, the price is in a bullish a strong channel. At the present time, the price sets at 1.1927. The first resistance has already formed at the level of 1.1941 and the pair is likely to try to approach it in order to test it again. The EUR/USD pair continues its attempts to settle above the key resistance level at 1.1941 while the U.S. dollar remains under pressure against a broad basket of currencies. Moreover, the European Central Bank may become worried about the rise of the euro at some point as stronger euro puts additional pressure on the European economy and on prices in the Euro Area. The next resistance for the EUR/USD pair is located at 1.1977, but the EUR/USD pair may also face some resistance at the highs of the previous trading session at 1.1941. If EUR/USD manages to settle above the resistance at 1.1941, it will gain upside momentum and head towards the next resistance level at 1.1977. Consequently, this breakout at 1.1941 should send the EUR/USD pair higher. Immediate targets, however, are located quite nearby at 1.1977 and the round 1.2006 level. However, if the pair fails to pass through the level of 1.1941, the market will indicate a bearish opportunity below the resistance level of 1.1941 (the double top - a ratio of 100% Fibonacci). Forecast : Buy above the level of 1.1867 with the first target at 1.1941so as to test the daily resistance 1 and further to 1.19677. Also, it might be noted that the level of 1.2006 is a good place to take profit because it will form a new double top. On the other hand, in case a reversal takes place and the GBP/USD pair breaks through the support level of 01.1867, a further decline to 1.1732 can occur which would indicate a bearish market.
Author's today's articles: Stanislav Polyanskiy  Graduated from Odessa State Economic University. On Forex since 2006. Writes analytical reviews about international financial markets for more than 3 years. Worked as a currency analyst in different finance companies for a long time including the biggest companies of Russia and Ukraine. Graduated from Odessa State Economic University. On Forex since 2006. Writes analytical reviews about international financial markets for more than 3 years. Worked as a currency analyst in different finance companies for a long time including the biggest companies of Russia and Ukraine. Sebastian Seliga  Sebastian Seliga was born on 13th Oсtober 1978 in Poland. He graduated in 2005 with MA in Social Psychology. He has worked for leading financial companies in Poland where he actively traded on NYSE, AMEX and NASDAQ exchanges. Sebastian started Forex trading in 2009 and mastered Elliott Wave Principle approach to the markets by developing and implementing his own trading strategies of Forex analysis. Since 2012, he has been writing analitical reviews based on EWP for blogs and for Forex websites and forums. He has developed several on-line projects devoted to Forex trading and investments. He is interested in slow cooking, stand-up comedy, guitar playing, reading and swimming. "Every battle is won before it is ever fought", Sun Tzu Sebastian Seliga was born on 13th Oсtober 1978 in Poland. He graduated in 2005 with MA in Social Psychology. He has worked for leading financial companies in Poland where he actively traded on NYSE, AMEX and NASDAQ exchanges. Sebastian started Forex trading in 2009 and mastered Elliott Wave Principle approach to the markets by developing and implementing his own trading strategies of Forex analysis. Since 2012, he has been writing analitical reviews based on EWP for blogs and for Forex websites and forums. He has developed several on-line projects devoted to Forex trading and investments. He is interested in slow cooking, stand-up comedy, guitar playing, reading and swimming. "Every battle is won before it is ever fought", Sun Tzu Maxim Magdalinin  In 2005 graduated from the Academy of the Ministry of Internal Affairs of the Republic of Belarus, law faculty. Worked as a lawyer for three years in one of the biggest country's company. Besides the trading, he develops trading systems, writes articles and analytical reviews. Works at stock and commodity markets explorations. On Forex since 2006. In 2005 graduated from the Academy of the Ministry of Internal Affairs of the Republic of Belarus, law faculty. Worked as a lawyer for three years in one of the biggest country's company. Besides the trading, he develops trading systems, writes articles and analytical reviews. Works at stock and commodity markets explorations. On Forex since 2006. Sergey Belyaev  Born December 1, 1955. In 1993 graduated from Air Force Engineering Academy. In September 1999 started to study Forex markets. Since 2002 has been reading lectures on the technical analysis . Is fond of research work. Created a personal trading system based on the indicator analysis. Authored the book on technical analysis "Calculation of the next candlestick". At present the next book is being prepared for publishing "Indicator Analysis of Forex Market. Trading System Encyclopedia". Has created eleven courses on indicator analysis. Uses classical indicators. Works as a public lecturer. Held numerous seminars and workshops presented at international exhibitions of financial markets industry. Is known as one of the best specialists in the Russian Federation researching indicator analysis. Born December 1, 1955. In 1993 graduated from Air Force Engineering Academy. In September 1999 started to study Forex markets. Since 2002 has been reading lectures on the technical analysis . Is fond of research work. Created a personal trading system based on the indicator analysis. Authored the book on technical analysis "Calculation of the next candlestick". At present the next book is being prepared for publishing "Indicator Analysis of Forex Market. Trading System Encyclopedia". Has created eleven courses on indicator analysis. Uses classical indicators. Works as a public lecturer. Held numerous seminars and workshops presented at international exhibitions of financial markets industry. Is known as one of the best specialists in the Russian Federation researching indicator analysis. Vyacheslav Ognev  Vyacheslav was born on August 24, 1971. In 1993, he graduated from Urals State University of Economics in the Russian city of Ekaterinburg holding a degree in Commerce and Economics of Trade. In 2007, he started concentrating on the Russian stock market, trading stocks on the RTS Stock Exchange and futures contracts on FORTS. Since 2008 he has been engaged in analyzing Forex market and trading currencies. He is an author of a simplified wave analysis method. He has also developed a trading strategy. At present, Vyacheslav is a co-author of training materials on two web portals dedicated to Forex trading education. Interests: fitness, F1 "Experience is the best of schoolmasters, only the school fees are heavy." - Thomas Carlyle Vyacheslav was born on August 24, 1971. In 1993, he graduated from Urals State University of Economics in the Russian city of Ekaterinburg holding a degree in Commerce and Economics of Trade. In 2007, he started concentrating on the Russian stock market, trading stocks on the RTS Stock Exchange and futures contracts on FORTS. Since 2008 he has been engaged in analyzing Forex market and trading currencies. He is an author of a simplified wave analysis method. He has also developed a trading strategy. At present, Vyacheslav is a co-author of training materials on two web portals dedicated to Forex trading education. Interests: fitness, F1 "Experience is the best of schoolmasters, only the school fees are heavy." - Thomas Carlyle Irina Manzenko  Irina Manzenko Irina Manzenko Grigory Sokolov  Born 1 January, 1986. In 2008 graduated from Kiev Institute of Business and Technology with "Finance and Credit" as a major. Since 2008 has studied the behavior of various currency pairs and their correlation on Forex. In his works and trading practice he uses candlestick analysis and Fibonacci technique. Since 2009 has written analytical reviews and articles which are published on popular Internet resources. Interests: music, computers and cookery. "Out of five deadly sins of business and as a rule, the most widespread, excessive striving to get profit is the worst". P. Drucker Born 1 January, 1986. In 2008 graduated from Kiev Institute of Business and Technology with "Finance and Credit" as a major. Since 2008 has studied the behavior of various currency pairs and their correlation on Forex. In his works and trading practice he uses candlestick analysis and Fibonacci technique. Since 2009 has written analytical reviews and articles which are published on popular Internet resources. Interests: music, computers and cookery. "Out of five deadly sins of business and as a rule, the most widespread, excessive striving to get profit is the worst". P. Drucker Pavel Vlasov  No data No data Mihail Makarov  - - Mourad El Keddani  Was born in Oujda, Morocco. Currently lives in Belgium. In 2003 obtained B.S. in Experimental Sciences. In 2007 obtained a graduate diploma at Institut Marocain Specialise en Informatique Applique (IMSIA), specialty – Software Engineering Analyst. In 2007–2009 worked as teacher of computer services and trainer in a professional school specializing in computer technologies and accounting. In 2005 started Forex trading. Authored articles and analytical reviews on Forex market on Forex websites and forums. Since 2008 performs Forex market research, and develops and implements his own trading strategies of Forex analysis (especially in Forex Research & Analysis, Currency Forecast, and Recommendations and Analysis) that lies in: Numerical analysis: Probabilities, equations and techniques of applying Fibonacci levels. Classical analysis: Breakout strategy and trend indicators. Uses obtained skills to manage traders' accounts since 2009. In April 2009 was certified Financial Technician by the International Federation of Technical Analysts. Winner of several social work awards: Education Literacy and Non-Formal Education (in Literacy and Adult Education in The National Initiative for Human Development). Was born in Oujda, Morocco. Currently lives in Belgium. In 2003 obtained B.S. in Experimental Sciences. In 2007 obtained a graduate diploma at Institut Marocain Specialise en Informatique Applique (IMSIA), specialty – Software Engineering Analyst. In 2007–2009 worked as teacher of computer services and trainer in a professional school specializing in computer technologies and accounting. In 2005 started Forex trading. Authored articles and analytical reviews on Forex market on Forex websites and forums. Since 2008 performs Forex market research, and develops and implements his own trading strategies of Forex analysis (especially in Forex Research & Analysis, Currency Forecast, and Recommendations and Analysis) that lies in: Numerical analysis: Probabilities, equations and techniques of applying Fibonacci levels. Classical analysis: Breakout strategy and trend indicators. Uses obtained skills to manage traders' accounts since 2009. In April 2009 was certified Financial Technician by the International Federation of Technical Analysts. Winner of several social work awards: Education Literacy and Non-Formal Education (in Literacy and Adult Education in The National Initiative for Human Development).
Languages: Arabic, English, French and Dutch.
Interests: Algorithm, Graphics, Social work, Psychology and Philosophy.
Subscription's options management Theme's:
Fundamental analysis, Fractal analysis, Wave analysis, Technical analysis, Stock Markets
Author's :
A Zotova, Aleksey Almazov, Alexander Dneprovskiy, Alexandr Davidov, Alexandros Yfantis, Andrey Shevchenko, Arief Makmur, Dean Leo, Evgeny Klimov, Fedor Pavlov, Grigory Sokolov, I Belozerov, Igor Kovalyov, Irina Manzenko, Ivan Aleksandrov, l Kolesnikova, Maxim Magdalinin, Mihail Makarov, Mohamed Samy, Mourad El Keddani, Oleg Khmelevskiy, Oscar Ton, Pavel Vlasov, Petar Jacimovic, R Agafonov, S Doronina, Sebastian Seliga, Sergey Belyaev, Sergey Mityukov, Stanislav Polyanskiy, T Strelkova, Torben Melsted, V Isakov, Viktor Vasilevsky, Vladislav Tukhmenev, Vyacheslav Ognev, Yuriy Zaycev, Zhizhko Nadezhda
Edit data of subscription settings
Unsubscribe from the mailing list Sincerely,
Analysts Service | If you have any questions, you can make a phone call using one of the
InstaForex Toll free numbers right now:
|  | InstaForex Group is an international brand providing online trading services to the clients all over the world. InstaForex Group members include regulated companies in Europe, Russia and British Virgin Islands. This letter may contain personal information for access to your InstaForex trading account, so for the purpose of safety it is recommended to delete this data from the history. If you have received this letter by mistake, please contact InstaForex Customer Relations Department. |


No comments:
Post a Comment