| Trading idea for the USD/JPY pair 2020-11-25  Last week's trading recommendation was to work for a price increase in the USD / JPY pair . The plan involved completing the wave pattern (ABC) on the daily chart, which formed amid positive news on Pfizer's COVID-19 vaccine. The pair's bullish impulse waves were arranged like this: 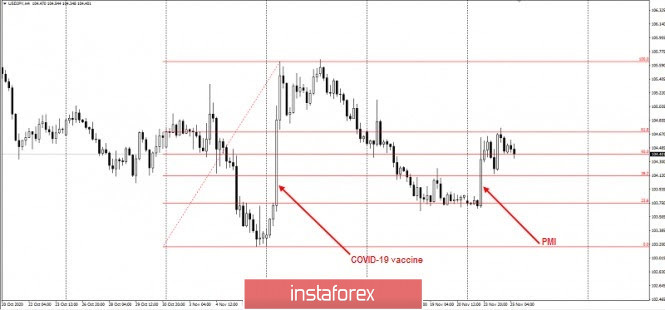 In the plan, the initial risk was the monthly low. But now, due to the strong data on US PMI, it should decrease according to the scenario below: 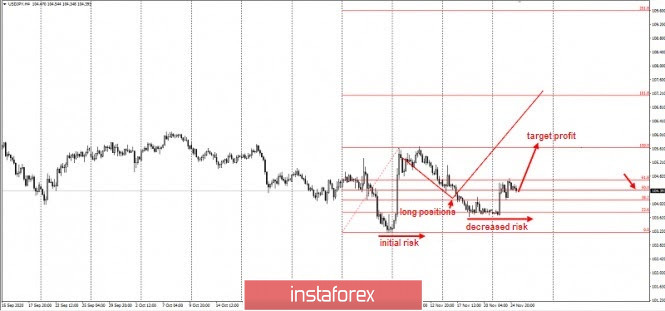 Target profit will remain the same, that is, a quote of 105.6. Price Action and Stop Hunting were used for this trading strategy. Good luck! Analysis of EUR/USD on November 25. The US dollar is teetering on the verge of a new fall, this time to the 20th figure 2020-11-25 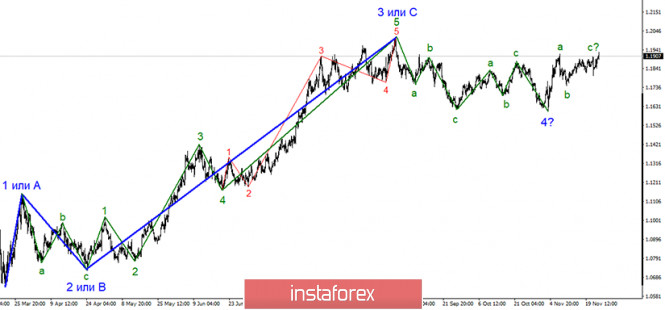
The wave marking of the EUR/USD instrument continues to look quite confusing. The current wave structure still allows the completion of the construction of the alleged global wave 4 and the construction of a rising wave 5. However, it is also possible that the instrument will continue to move in three-wave structures. Therefore, the construction of the supposed wave from the next three-wave upward trend section continues. In any case, according to the current markup, the instrument's quotes are expected to increase in the near future. 
The wave marking on a smaller scale also indicates that the next three-wave section of the trend is still being built. It is also possible that the upward section of the trend within the global wave 5 has resumed, as I mentioned when analyzing the 24-hour timeframe. In any case, the current wave should lead to an increase in quotes above the peak of the previous wave a, which is above figure 19. A successful attempt to break through the minimum of wave b will require making adjustments and additions to the current wave markup. It can be said this time that the wave marking is much more important than the news background. It is still too soon for me to come to the conclusion that the Euro currency has sufficient grounds to continue to be in demand. In recent months, it would seem that there has been a lot of important information from America and the European Union. But after all this time, there was no trend in the instrument. The instrument moved with three wave structures and continues to do so currently. What's important in America right now? Joe Biden won the election, Donald Trump conceded defeat and gave the order to start the process of transferring power to the Democrat. In no state has the current President of the United States been able to review the voting results. Former Fed Chair Janet Yellen might be appointed to the post of Finance Minister, at least Joe Biden offered her the post. But all this news doesn't really matter for the dollar right now. Well, Yellen is likely to be appointed, but so what? In any case, the markets will react to its actions, to the actions of the Ministry of Finance and so on, and not to the fact of the appointment of a particular person to a particular post. Currently, the situation in the European Union is not very interesting. It was reported a week ago that the seven-year budget and the recovery fund after the pandemic were blocked by Poland and Hungary. However, these countries vetoed these funds more than a day before they were supposed to be implemented. To put it simply, the EU authorities have plenty of time to reach an agreement with the authorities of Poland and Hungary. At the same time, the heads of the Central Banks of the United States and the European Union said that in the near future, we should not expect a sharp economic recovery due to the mere fact of creating a vaccine against coronavirus. Christine Lagarde is completely pessimistic and expects a serious contraction of the economy at the end of 2020 due to the repeated "lockdown." Thus, I can't call which positions are more attractive, the dollar or the euro. General conclusions and recommendations: The euro-dollar pair presumably continues to build a three-wave upward trend section. Therefore, I recommend buying the instrument with targets located near the 1.2010 mark, which corresponds to 0.0% Fibonacci, for each MACD signal "up," based on the construction of wave C. The assumed wave b has presumably completed its construction. GBP/USD analysis on November 25. The subject of lengthy negotiations between the European Union and the UK is the trade turnover of almost $ 900 billion 2020-11-25 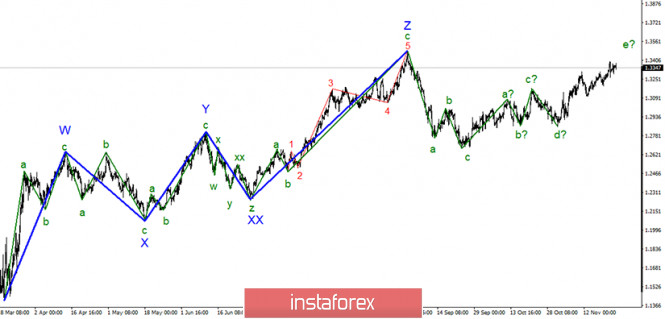
In the most global terms, the construction of the upward trend section continues but the wave marking takes a complex form and may become even more complicated. The section of the trend that started on September 23 took a five-wave form but not an impulse one. A successful attempt to break the previous peak indicates that the markets are ready for further purchases of the British pound. The supposed e-wave also took a five-wave form. 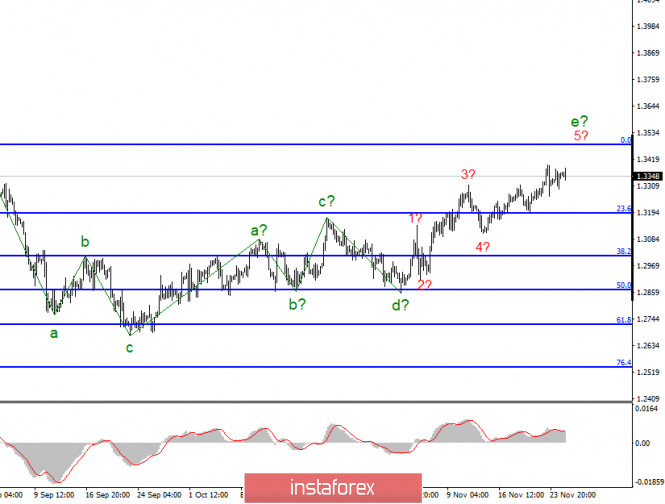
The lower chart clearly shows the a-b-c-d-e waves of the uptrend section. The assumed e-wave took a more complex five-wave form. However, even with this complication, it is nearing completion. At the same time, the demand for the British remains quite high. This means that the upward section of the trend can be complicated almost indefinitely. I am still inclined to the option of a fall in the instrument's quotes. Trade negotiations between the EU and the UK are continuing and that says it all. I have repeatedly said that there has been no important news on this topic for the past weeks. All other messages that come to the market do not deserve special attention at all. Today I propose to find out why a trade deal is so important for both the EU and Britain. The answer is really simple and short: $ 900 billion in trade. At this time, Britain and the EU continue to trade without any duties, so the trade turnover has not been affected. However, it will suffer very much from January 1, 2021 if London and Brussels will fail to conclude an agreement. By comparison, the UK signed a $ 1.5 billion free trade agreement with Japan and $ 27 billion with Canada in 2020. The agreement with the EU is worth 900 billion and that is what's at stake. This is understood by almost everyone and this agreement is more important for Britain than for the European Union. The UK business sector is calling on Boris Johnson to conclude an agreement with the EU, saying that business is depleted by the coronavirus pandemic. Without a deal, most of the business will be forced to reduce its production and for some it will be a critical moment and will have to close. Therefore, the prospects for the British economy are absolutely black now. The end of the transition period is just over a month away. And the parties still need to ratify the agreement in Parliaments. In General, everything is going so far to the fact that the parties simply do not have enough time. Today, America will release important reports on GDP, orders for durable goods, as well as on personal income and expenses. I'm suggesting paying attention to these figures because they can trigger a market reaction if the actual values do not match expectations. General conclusions and recommendations: The Pound-Dollar instrument has resumed building an uptrend but its last wave is nearing completion. Thus, now I recommend that you look closely at the sales of the instrument but the British is not yet giving clear signals about the end of the upward section of the trend. At the same time, purchases of the instrument are now quite dangerous, given the uncertainty associated with the trade deal. Gold lost its luster after consecutive fall 2020-11-25 At present, the dollar is facing a rough time, however, if there is anything having it worst than the dollar, that would be the gold. The USD is experiencing serious difficulties due to hopes for vaccination and the associated global economic recovery, as well as due to the reduction of political uncertainty in the US. Almost the same concerns that troubles the precious metals. The gold is losing its luster amid the desire of investors to jump on opportunities through the S&P 500 and Bitcoin. The US stock indexes continue to update historical highs, and the cryptocurrency is one step away from updating the record peak. People need money to buy something that will make a profit in the future, and they are ready to get rid of other assets. Including selling XAUUSD. Until recently, the position of gold seemed unshakable. There was confidence in the precious metal against the background of low real yields on US Treasury bonds, forecasts of a weak dollar, and huge flows of cheap liquidity from the Fed. There were rumors in the market that it was ready to return above $ 2,000 an ounce, and ETF stocks at their peak in October increased by 900 tons, twice as much as in the whole of 2019. Unfortunately, news of successful trials of COVID-19 vaccines turned everything upside down. The announcement of the first of them, from Pfizer and BioNTech, triggered a rapid rally in the US debt market rates and the second-largest sale of XAUUSD in the last 7 years. Since then, stocks of specialized exchange-traded funds have declined by 60 tons, and gold has reached the critical level of $ 1,800 per ounce at arm's length. Gold ETF stock dynamics: 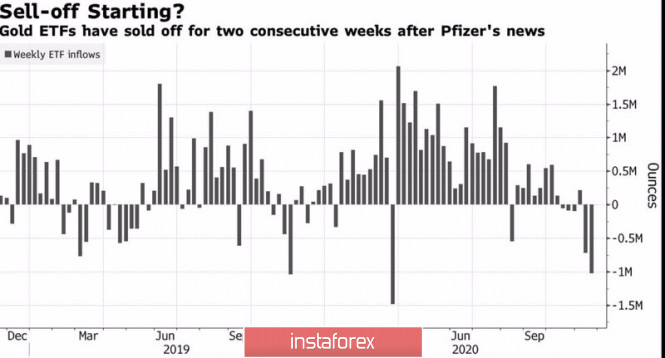
It should be noted that not all the bulls threw out a white flag. According to Goldman Sachs, the current collapse of gold is nothing more than a correction to an upward trend, which should be used for purchases. Inflation will accelerate, and with it, interest in the precious metal will return. Personally, this reminds me of the events of 2011-2013, when XAUUSD buyers also gave many arguments in favor of restoring the bullish trend. We mentioned cheap liquidity, low rates on the global debt market, an increase in the debt burden, and inflation. To their disappointment, the gold fell like a stone. Deutsche Bank believes that this time it may be different, as the savings rates of American households increased from 8.3% before the pandemic to 14.3%, which is fraught with a crackdown on consumer prices. However, in my opinion, Macquarie's forecast of a decline in prices for the precious metal to $ 1,550 per ounce in 2021 looks much more realistic. According to the company, the cyclical bull market for gold has come to an end. Even a falling US dollar won't save it. When the crisis subsides, and expectations of future monetary easing by the Fed are reduced, XAUUSD falls into a wave of sales. Technically, in accordance with the 161.8% and 200% targets for the AB = CD harmonious trading pattern, gold can collapse to $ 1,775 and $ 1,725 per ounce. I recommend keeping and increasing short positions on the precious metal formed within the previous recommendations from the levels of $ 1882, $ 1872, and $ 1855 on pullbacks. Gold, daily chart: 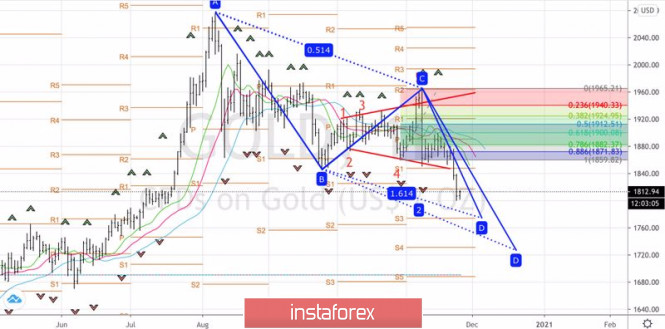
EUR/USD: plan for the American session on November 25 (analysis of morning deals) 2020-11-25 To open long positions on EURUSD, you need: In my morning forecast, I paid attention to purchases from the level of 1.1890, as well as sales after the resistance update of 1.1929. Let's take a look at the 5-minute chart and talk about what happened and where you could earn money. In the absence of important fundamental statistics, the bulls made another attempt to increase the euro, and the test of the level of 1.1890 led to the formation of a buy signal. The goal of the movement was the resistance of 1.1929, from where it was possible to open short positions. To be fair, I personally expected a false breakout to form at this level and did not open short positions at the first update of the level of 1.1929. 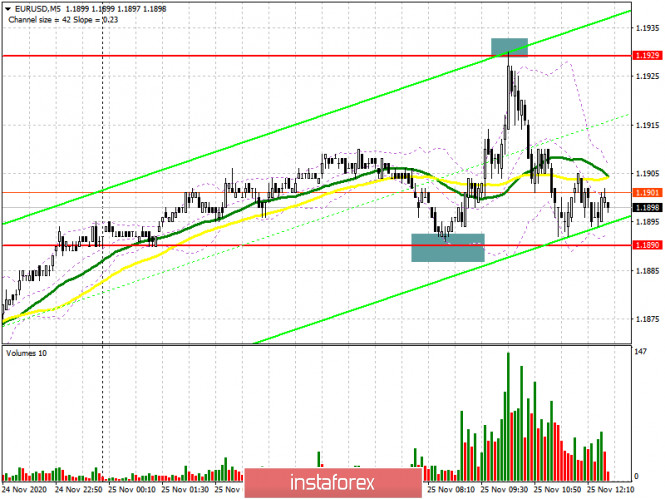
As a result of all the movements, the technical picture remained completely unchanged. The entire focus in the second half of the day will be shifted to a fairly large number of fundamental statistics on the American economy. Today, important US GDP reports and Federal Reserve minutes are published, which may lead to a slight strengthening of the dollar. If the data turns out to be worse than economists' forecasts, and we are also interested in the income and expenses of Americans, then the demand for the euro will only increase. Only another false breakout formation around 1.1890 in the afternoon will form a new entry point for long positions. In this case, the next target for buyers will be the same high of 1.1929, from which the pair quickly bounced down today. The longer-term target is the resistance at 1.1964, where I recommend taking the profit. In the scenario of a decline in EUR/USD back to the area of 1.1890 in the second half of the day and the lack of bull activity at this level, I recommend that you do not rush to buy but wait for a downward correction to the area of yesterday's support of 1.1844, from where you can buy euros today immediately for a rebound based on an upward correction of 15-20 points. A larger support level is seen only at this week's low in the area of 1.1802, where you can also buy euros immediately on the first test. To open short positions on EURUSD, you need to: The initial task of sellers is to return to the level of 1.1890, which they failed to recapture in the first half of the day. Only a consolidation below 1.1890 and its test from the reverse side from the bottom up form a more convenient entry point for short positions in the expectation of a resumption of the downward trend. In this case, the nearest target of the bears will be a minimum of 1.1844, from which yesterday it was possible to observe the active growth of the pair. However, an update to this level will only be an indication that trading remains in the side channel. Only a breakdown and consolidation below this range will lead EUR/USD to the area of weekly lows of 1.1802, where I recommend fixing the profits. If the bulls turn out to be, and the data on the US economy disappoints traders, then it is best not to rush with sales, but wait for the next update of the resistance at 1.1929, where only the formation of a false breakdown will signal the opening of short positions in the euro. I recommend selling EUR/USD immediately for a rebound only from the maximum of 1.1964, based on a correction of 15-20 points within the day. 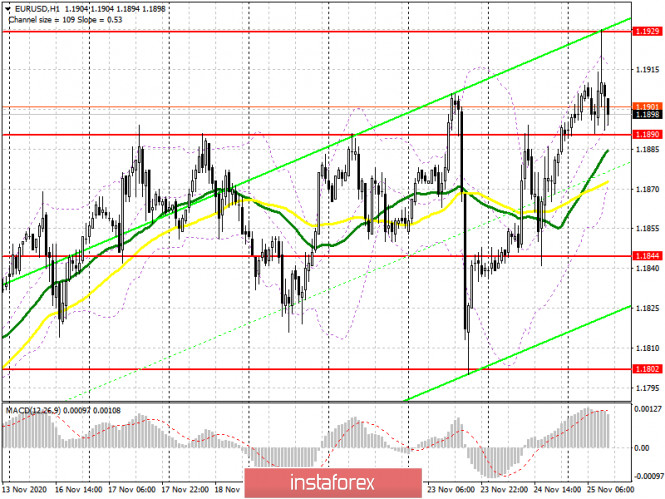
Let me remind you that the COT report (Commitment of Traders) for November 17 recorded an increase in long and short positions. So, long non-commercial positions increased from the level 202,374 to the level of 203,551, while non-commercial short positions increased from 69,591 to the level of 67,087. The total non-commercial net position fell to 133,960, down from 135,287 weeks earlier. It is worth noting that the delta has been declining for 8 consecutive weeks, which confirms the lack of desire of euro buyers to go to the market in the current conditions. It will be possible to talk about a further recovery of the euro only after European leaders "settle" their differences with Poland and Hungary, and the UK agrees with Brussels on a new trade agreement. Otherwise, we will have to wait for the lifting of restrictive measures imposed due to the second wave of coronavirus in many EU countries. Signals of indicators: Moving averages Trading is conducted above 30 and 50 daily moving averages, which indicates an attempt by the bulls to continue pushing the market up. Note: The period and prices of moving averages are considered by the author on the hourly chart H1 and differ from the general definition of the classic daily moving averages on the daily chart D1. Bollinger Bands A break of the upper limit of the indicator around 1.1920 will lead to new growth of the pair. If the euro declines, the lower border of the indicator in the area of 1.1875 will provide support. Description of indicators - Moving average (moving average determines the current trend by smoothing out volatility and noise). Period 50. The graph is marked in yellow.
- Moving average (moving average determines the current trend by smoothing out volatility and noise). Period 30. The graph is marked in green.
- MACD indicator (Moving Average Convergence / Divergence - moving average convergence / divergence) Fast EMA period 12. Slow EMA period 26. SMA period 9
- Bollinger Bands (Bollinger Bands). Period 20
- Non-profit speculative traders, such as individual traders, hedge funds, and large institutions that use the futures market for speculative purposes and meet certain requirements.
- Long non-commercial positions represent the total long open position of non-commercial traders.
- Short non-commercial positions represent the total short open position of non-commercial traders.
- Total non-commercial net position is the difference between the short and long positions of non-commercial traders.
GBP/USD: plan for the American session on November 24 (analysis of morning deals) 2020-11-25 To open long positions on GBPUSD, you need: In my morning forecast, I recommended opening short positions when a false breakout is formed in the resistance area of 1.3376, which happened. And if yesterday the pound caused a lot of trouble, today, the first sale from 1.3376 made it possible to compensate for all losses, as the downward movement was more than 40 points. Let's look at a 5-minute chart. On it, I marked the point where a false breakout was formed after an unsuccessful attempt by the bulls to resume the growth of the pound. A return under 1.3376 quickly pushed the pair to the morning support of 1.3325, for which the main fight will unfold in the second half of the day. 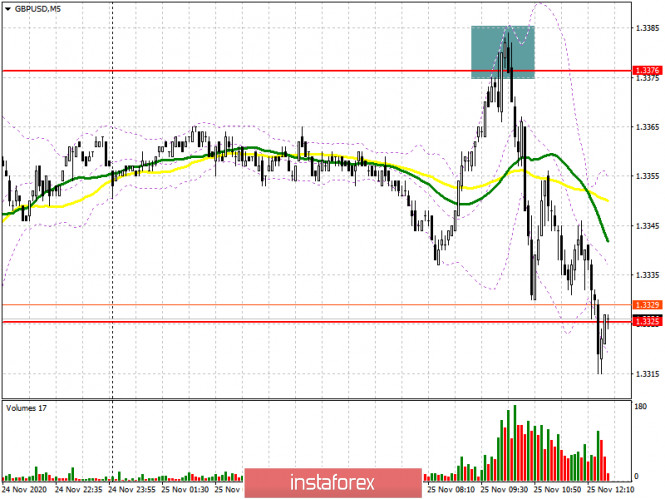
As a result of all the movements, the technical picture remained completely unchanged. The entire focus in the second half of the day will be shifted to a fairly large number of fundamental statistics on the American economy. Today, important US GDP reports and Federal Reserve minutes are published, which may lead to a slight strengthening of the dollar. If the data turns out to be worse than economists' forecasts, and we are also interested in the income and expenses of Americans, then demand for the pound will quickly increase. Only if a false breakout is formed in the support area of 1.3325, by analogy, as it was yesterday, buyers will be able to form a signal to open long positions in the expectation of resuming the bull market. In this case, the goal will be to re-update the maximum of 1.3376, which now determines the further movement of the pair. Fixing above 1.3376 will open up a real prospect for GBP/USD to update the highs of 1.3453 and 1.3523, where I recommend fixing the profits. However, such a large increase will occur only if there is good news on Brexit, or if the fundamentals of the US economy are very weak. If the bulls do not show any activity in the area of 1.3325, then I recommend returning to buying the pound only for a rebound from the minimum of 1.3267, based on a correction of 20-30 points within the day. To open short positions on GBP / USD, you need to: Breaking the level of 1.3325 is the primary task of the bears for the second half of the day. Only fixing below this area with its test from the bottom up, similar to yesterday's entry point into short positions, will return new large sellers to the market, which will quickly push GBP/USD to the area of the minimum of 1.3267, where I recommend fixing the profits. It will be possible to talk about the resumption of the bear market only after the breakdown of 1.3267, which will lead to the demolition of several stop orders from buyers and a rapid movement of the pair down to the area of 1.3194. If in the second half of the day the bulls again manage to defend the area of 1.3325, then it is better not to rush with sales. Only another return with the formation of a false breakout in the resistance area of 1.3376 will be a signal to open short positions. If there is no noticeable activity of sellers, it is best to abandon short positions until the new high is updated in the area of 1.3453, where you can sell the pound immediately on the rebound with the expectation of a correction of 20-30 points within the day. 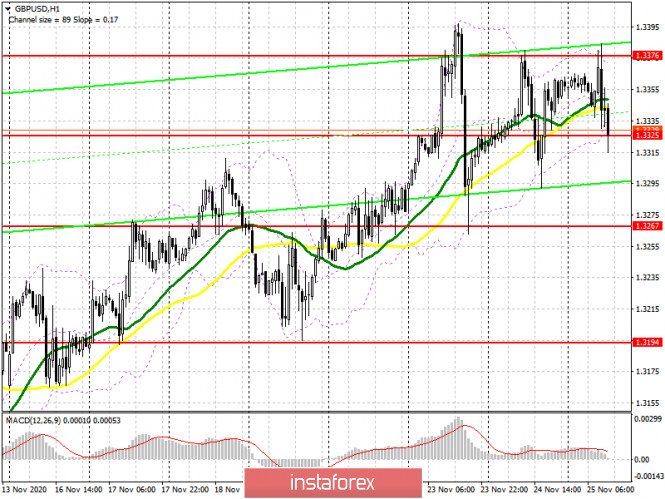
Let me remind you that in the COT reports (Commitment of Traders) for November 17, there was a reduction in long positions and a sharp influx of short positions. Long non-commercial positions declined from 27,872 to 27,454. At the same time, short non-commercial positions rose from 45,567 to 47,200. As a result, the negative non-commercial net position was -19,746, against -17,695 weeks earlier, which indicates that the sellers of the British pound retain control and their preponderance in the current situation. Lack of clarity on the trade agreement, together with the lockdown of the British economy in November this year, clearly does not add optimism and confidence to the buyers of the pound. Signals of indicators: Moving averages Trading is below 30 and 50 daily averages, which indicates a likely resumption of the downward correction for the pound. Note: The period and prices of moving averages are considered by the author on the hourly chart H1 and differ from the general definition of the classic daily moving averages on the daily chart D1. Bollinger Bands A break of the lower limit of the indicator around 1.3320 will lead to a new wave of falling of the pound. A break of the upper limit in the area of 1.3376 will form a new upward trend. Description of indicators - Moving average (moving average determines the current trend by smoothing out volatility and noise). Period 50. The graph is marked in yellow.
- Moving average (moving average determines the current trend by smoothing out volatility and noise). Period 30. The graph is marked in green.
- MACD indicator (Moving Average Convergence / Divergence - moving average convergence / divergence) Fast EMA period 12. Slow EMA period 26. SMA period 9
- Bollinger Bands (Bollinger Bands). Period 20
- Non-profit speculative traders, such as individual traders, hedge funds, and large institutions that use the futures market for speculative purposes and meet certain requirements.
- Long non-commercial positions represent the total long open position of non-commercial traders.
- Short non-commercial positions represent the total short open position of non-commercial traders.
- Total non-commercial net position is the difference between the short and long positions of non-commercial traders.
EUR/USD analysis for November 25 2020 - Fake breakout of the multi day resistance at 1.1915 and potential for the stronger downside movment towards 1.1800 2020-11-25 Prior -0.3% - Market index 863.6 vs 831.5 prior
- Purchase index 314.6 vs 303.9 prior
- Refinancing index 4,077.7 vs 3,901.6 prior
- 30-year mortgage rate 2.92% vs 2.99% prior
The long-term mortgage rate fell to a survey low in the past week and that is continuing to spur housing market activity, with purchases and refinancing both jumping. After a bit of a slow period in mid-September to October, we're starting to see more of a pickup again. Further Development 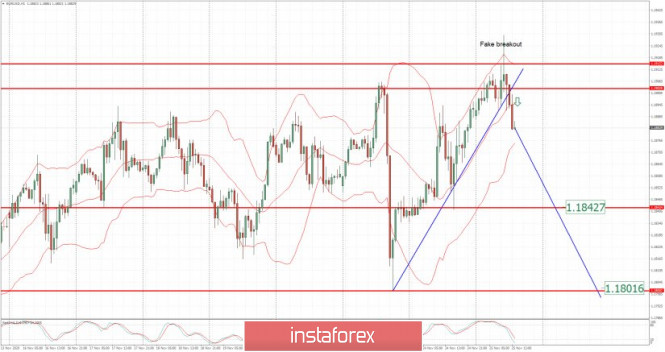
Analyzing the current trading chart fo EUR/USD, I found that there is fake breakout of the breakout of the balance high at 1,1915, which is sign that we might see downside movement. 1-Day relative strength performance Finviz 
Based on the graph above I found that on the top of the list we got VIX and Coffee today and on the bottom Lumber and Cocoa. EUR looks neutral on the list but with the fake of multi day high in the background, which is good sign of weakness. Key Levels: Resistance: 1,1,915/30 Support levels: 1,1842 and 1,1800. Analysis of Gold for November 25,.2020 - Potential completion of the ABC upside correction and downside rotation towards $1.800 2020-11-25 here is still quite a degree of silence surrounding the latest round of talks Both sides aren't giving much away and as the saying goes, silence is golden. It could very well just be some political theater before we get some imminent announcement of a makeshift agreement as alluded to earlier in the weekBut we'll see. 
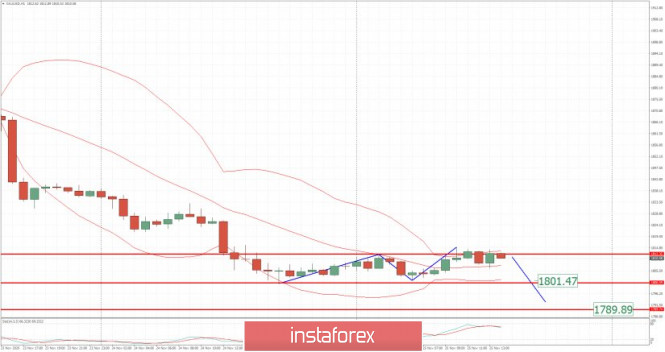
Further Development Analyzing the current trading chart fo Gold, I found that there is potential completion of the upside correction ABC, which is sign that we might see furhter downside movement. Watch for selling opportunities on the the rallies using the intraday charts. Downward targets are set at the price of $1,800 and $1,790 Stochastic oscillator is in overbought zone, which is another sign of weakness. 1-Day relative strength performance Finviz 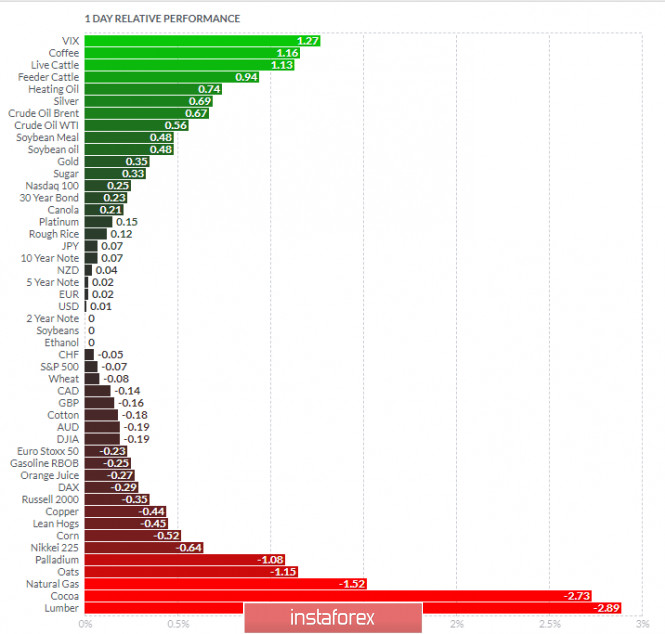
Based on the graph above I found that on the top of the list we got VIX and Coffee today and on the bottom Lumber and Cocoa. Gold is positive today on the list.... Key Levels: Resistance: $1,815 Support levels: 11,800 and $1,790
Author's today's articles: Andrey Shevchenko  Andrey Shevchenko Andrey Shevchenko Alexander Dneprovskiy  Graduated from Kiev State University of Economics. On Forex market since 2007. Started his work at Forex as a trader. Since 2008 is working as a currency analyst. Graduated from Kiev State University of Economics. On Forex market since 2007. Started his work at Forex as a trader. Since 2008 is working as a currency analyst. Igor Kovalyov  Igor Kovalyov was born on September 24, 1985. Igor graduated from Krasnoyarsk State University with a degree in Philology and Journalism. He has a wide experience as a newspaper and information agency correspondent. He got interested in financial markets in 2001. He also graduated from Moscow State University of Economics, Statistics, and Informatics (MESI) with a degree in Global Economics and then served as an analyst in an investment company. He has been working at InstaForex since 2014. Igor Kovalyov was born on September 24, 1985. Igor graduated from Krasnoyarsk State University with a degree in Philology and Journalism. He has a wide experience as a newspaper and information agency correspondent. He got interested in financial markets in 2001. He also graduated from Moscow State University of Economics, Statistics, and Informatics (MESI) with a degree in Global Economics and then served as an analyst in an investment company. He has been working at InstaForex since 2014. Maxim Magdalinin  In 2005 graduated from the Academy of the Ministry of Internal Affairs of the Republic of Belarus, law faculty. Worked as a lawyer for three years in one of the biggest country's company. Besides the trading, he develops trading systems, writes articles and analytical reviews. Works at stock and commodity markets explorations. On Forex since 2006. In 2005 graduated from the Academy of the Ministry of Internal Affairs of the Republic of Belarus, law faculty. Worked as a lawyer for three years in one of the biggest country's company. Besides the trading, he develops trading systems, writes articles and analytical reviews. Works at stock and commodity markets explorations. On Forex since 2006. Petar Jacimovic  Petar was born on July 08, 1989 in Serbia. Graduated from Economy University and after has worked as a currency analyst for large private investors. Petar has been involved in the world of finance since 2007. In this trading he specializes in Volume Price Action (volume background, multi Fibonacci zones, trend channels, supply and demand). He also writes the market analytical reviews for Forex forums and websites. Moreover Petar is forex teacher and has wide experience in tutoring and conducting webinars. Interests : finance, travelling, sports, music "The key to success is hard work" Petar was born on July 08, 1989 in Serbia. Graduated from Economy University and after has worked as a currency analyst for large private investors. Petar has been involved in the world of finance since 2007. In this trading he specializes in Volume Price Action (volume background, multi Fibonacci zones, trend channels, supply and demand). He also writes the market analytical reviews for Forex forums and websites. Moreover Petar is forex teacher and has wide experience in tutoring and conducting webinars. Interests : finance, travelling, sports, music "The key to success is hard work"
Subscription's options management Theme's:
Fundamental analysis, Fractal analysis, Wave analysis, Technical analysis, Stock Markets
Author's :
A Zotova, Aleksey Almazov, Alexander Dneprovskiy, Alexandr Davidov, Alexandros Yfantis, Andrey Shevchenko, Arief Makmur, Dean Leo, Evgeny Klimov, Fedor Pavlov, Grigory Sokolov, I Belozerov, Igor Kovalyov, Irina Manzenko, Ivan Aleksandrov, l Kolesnikova, Maxim Magdalinin, Mihail Makarov, Mohamed Samy, Mourad El Keddani, Oleg Khmelevskiy, Oscar Ton, Pavel Vlasov, Petar Jacimovic, R Agafonov, S Doronina, Sebastian Seliga, Sergey Belyaev, Sergey Mityukov, Stanislav Polyanskiy, T Strelkova, Torben Melsted, V Isakov, Viktor Vasilevsky, Vladislav Tukhmenev, Vyacheslav Ognev, Yuriy Zaycev, Zhizhko Nadezhda
Edit data of subscription settings
Unsubscribe from the mailing list Sincerely,
Analysts Service | If you have any questions, you can make a phone call using one of the
InstaForex Toll free numbers right now:
|  | InstaForex Group is an international brand providing online trading services to the clients all over the world. InstaForex Group members include regulated companies in Europe, Russia and British Virgin Islands. This letter may contain personal information for access to your InstaForex trading account, so for the purpose of safety it is recommended to delete this data from the history. If you have received this letter by mistake, please contact InstaForex Customer Relations Department. |


No comments:
Post a Comment