| Elliott wave analysis of EUR/JPY for November 17, 2020 2020-11-17 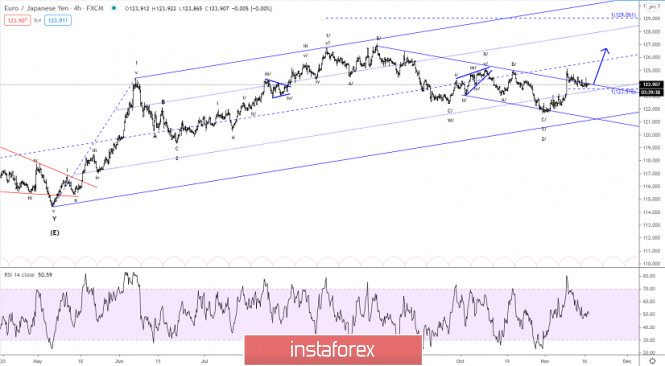
EUR/JPY is hardly moving at the moment. It tried to rally past minor resistance at 124.30, but failed, which keeps the corrective target at 123.58 to be hit before the next impulsive rally higher. Only a clear break above yesterdays peak at 124.44 will confirm the completion of the correction from 125.13 and the onset of a new impulsive rally towards the former peak at 127.02 and higher towards 129.36. R3: 125.75 R2: 125.00 R1: 124.65 Pivot: 124.13 S1: 123.95 S2: 123.58 S3: 123.23 Trading recommendation: We are long EUR from 122.25 with our stop placed at 123.25 Elliott wave analysis of GBP/JPY for November 17, 2020 2020-11-17 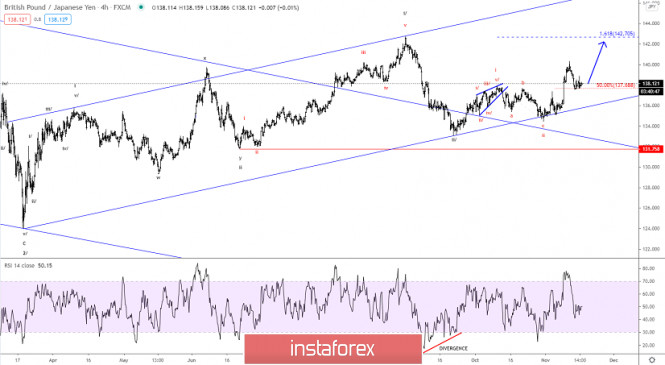
The failure to rally impulsive of the 137.52 low is of concern, but as long as the 137.52 low is able to protect the downside we will stay biased towards the bullish option for a new impulsive rally above minor resistance at 137.87 towards the former peak at 142.72 and much higher longer term. A break below 137.52 will be of concern, but back-up support inform of the rising trend-line is seen near 136.25. R3: 140.17 R2: 139.06 R1: 138.51 Pivot: 138.14 S1: 137.93 S2: 137.51 S3: 137.16 Trading recommendation: We are long GBp from 135.45 with our stop placed at 137.45 EUR/USD: plan for the European session on November 17. COT reports. Euro buyers actively push back, ready to break through resistance of 1.1868 2020-11-17 To open long positions on EUR/USD, you need: The European currency was best sold at 1.1868 yesterday morning. The attempt to settle above 1.1868 failed and there was also a lack of buying activity, all this caused the EUR/USD pair to return to the area below this level and a good entry point for short positions to appear, which quickly pushed the pair into the area of the morning support at 1.1832. The bears tried to secure the area below 1.1832 closer to the US session, having tested it from the bottom up, which produced a fairly good entry point for short positions, but this did not lead to a serious sale and the bulls regained control over this level by the middle of the US session. Testing 1.1832 from top to bottom became a signal to buy the euro, which was realized today in the Asian session. But, before talking about the prospects for the pair's movement, let's see what happened in the futures market and how the Commitment of Traders positions changed. Last week kept the market in balance due to the news that the third trials of the coronavirus vaccine were successful, and the fundamental reports on the US economy were not very encouraging. The rise in coronavirus cases continues to put pressure on risky assets, as the data show. The Commitment of Traders (COT) report for November 3 showed a reduction in long positions and an increase in short positions. Despite this, buyers of risky assets still believe in the bull market, although they prefer to proceed with caution. Thus, long non-commercial positions fell from 217,443 to 208,237, while short non-commercial positions rose from 61,888 to 67,888. The total non-commercial net position fell from 155,555 to 140,349 a week earlier. It is worth noting that the delta has been declining for seven consecutive weeks, which confirms the euro buyers' lack of desire to enter the market in the current conditions. Growth will only begin after Joe Biden's victory as he intends to endow the American economy with the next largest monetary aid package worth more than $2 trillion. 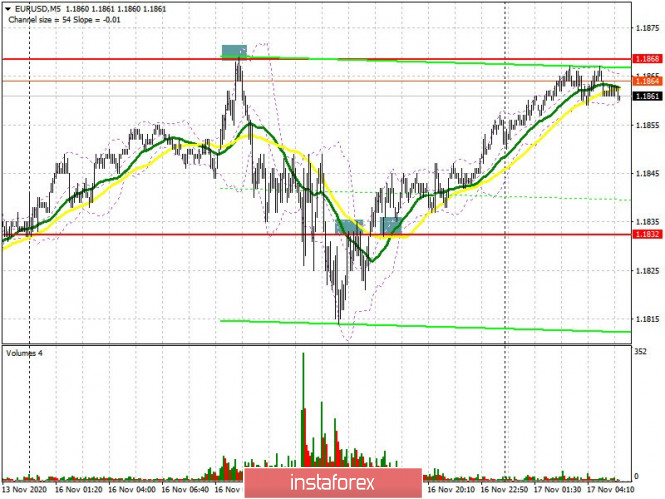 In regards to the pair's technical picture, it has not changed in any way compared to yesterday. The initial task of the bulls is to break and settle above the high of 1.1868, which produces a good entry point for continuing the upward correction and will open a direct road to the monthly high of 1.1915, where I recommend taking profits. Weak data on the US economy may strengthen the demand for the euro, especially in the field of retail sales, which will be released once the US session opens. The breakout of 1.1915 opens an opportunity to renew the highs of 1.1964 and 1.2008. In the event that EUR/USD falls today in the morning, an equally important task for the bulls will be to protect support at 1.1832. Forming a false breakout there, similar to yesterday, forms an entry point into long positions. In case bulls are not active in the 1.1832 area, it is better to postpone buy positions until the 1.1797 level has been updated. However, you can open long positions from it on the initial test, counting on a correction of 15-20 points within the day. Larger support is seen in the 1.1749 area, where you can buy the euro immediately on a rebound, counting on a correction of 15-20 points within the day. To open short positions on EUR/USD, you need: The initial task of the sellers is to protect resistance at 1.1868. Forming a false breakout there, similar to yesterday, will be another signal to open short positions in the euro, which will push the pair back to the support of 1.1832. Only a real breakout and being able to get the pair to settle below this range and testing it from the bottom up produces an additional entry point to short positions in hopes of bringing back the downward trend. In this case, the nearest target of the bears will be the low of 1.1797, which was not reached yesterday. However, even a test of this level will only be an indication that the pair is stuck in a horizontal channel. Going beyond and being able to settle below this range will lead EUR/USD to the area of the lower border of the horizontal channel at 1.1749, where I recommend taking profits. If the bulls turn out to be stronger and continue to push the pair up against the background of the absence of important fundamental statistics in the first half of the day, then it is best not to rush to sell, but wait until the larger resistance at 1.1915 has been updated. You can sell from this level during the first test, counting on a correction of 15-20 points. However, for the market to reverse, a false breakout must be present. I recommend opening short positions in EUR/USD immediately on a rebound, but only from a new monthly high of 1.1964. 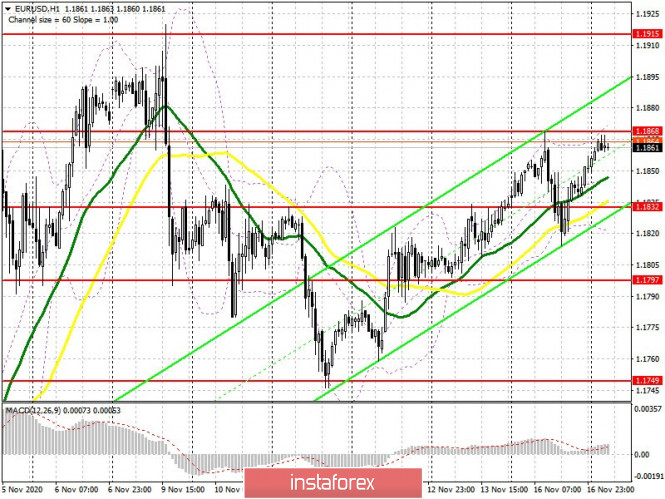 Indicator signals: Moving averages Trading is carried out above 30 and 50 moving averages, which indicates the continued bull market. Note: The period and prices of moving averages are considered by the author on the H1 hourly chart and differs from the general definition of the classic daily moving averages on the daily D1 chart. Bollinger Bands A breakout of the upper border of the indicator around 1.1868 will lead to a new wave of euro growth. Pressure on the euro will increase in case of a breakout of the lower border of the indicator in the 1.1820 area. Description of indicators - Moving average (moving average, determines the current trend by smoothing out volatility and noise). Period 50. It is marked in yellow on the chart.
- Moving average (moving average, determines the current trend by smoothing out volatility and noise). Period 30. It is marked in green on the chart.
- MACD indicator (Moving Average Convergence/Divergence — convergence/divergence of moving averages) Quick EMA period 12. Slow EMA period to 26. SMA period 9
- Bollinger Bands (Bollinger Bands). Period 20
- Non-commercial speculative traders, such as individual traders, hedge funds, and large institutions that use the futures market for speculative purposes and meet certain requirements.
- Long non-commercial positions represent the total long open position of non-commercial traders.
- Short non-commercial positions represent the total short open position of non-commercial traders.
- Total non-commercial net position is the difference between short and long positions of non-commercial traders.
GBP/USD: plan for the European session on November 17. COT reports. Bulls not ready to give up the market 2020-11-17 To open long positions on GBP/USD, you need: Like the bears yesterday, they did not try to pick up support at 1.3172. The pair kept returning to this level every time this range was tested, which ultimately led to producing a signal to buy the pound. I marked a long entry point on the 5-minute chart, afterwards the bears could no longer do anything. There is still a strong demand for the British pound today in the Asian session, which indicates a fairly large investor interest in this instrument. But, before we analyze the technical picture of the pound and run to take long deals, let's see what happened in the futures market last week, which continues to signal the increase in sellers. Lack of clarity on the trade agreement, together with the lockdown of the British economy in November, clearly does not add optimism and confidence to the buyers of the pound. There is also the risk of imposing negative interest rates early next year, especially if the coronavirus situation continues to worsen. This is reflected in the sentiment of market participants. The Commitment of Traders (COT) report for November 3 showed a reduction in long positions and a slight increase in short positions. Long non-commercial positions fell from 31,799 to 27,701. At the same time, short non-commercial positions slightly rose from 38,459 to 38,928. As a result, the negative non-commercial net position was 11,227 against 6,660 a week earlier, which indicates that the sellers of the British pound retain control and also shows their minimal advantage in the current situation. 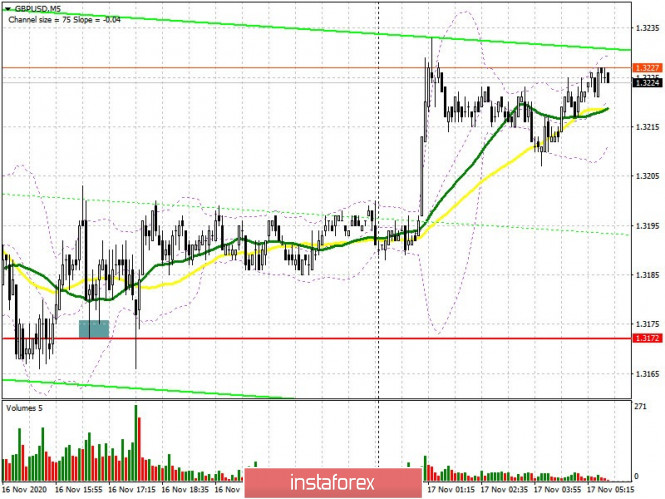 Buyers of the British pound aim for a breakout and to get the pair to settle above the resistance of 1.3237 in the first half of the day, which was not done yesterday. Only this produces a new entry point into long positions in hopes for GBP/USD to continue rising and reach a high of 1.3310, where I recommend taking profits. The next target will be resistance at 1.3378, but it will require good reasons for its update. One of them could come from Bank of England Governor Andrew Bailey's speech today, who may allay fears related to the negative interest rate, which is planned to be introduced early next year. In case the pound falls in the first half of the day, protecting support at 1.3168 will be an equally important task for the bulls. They got it over with yesterday. Today, forming a false breakout in that area will stop the bears. This will provide buyers with confidence and bring GBP/USD back to the resistance area of 1.3237, which is currently being traded around. In case bulls are not active in the 1.3168 area, it is best not to rush and postpone long positions until the test of a new low at 1.3106, where you can buy the pound immediately on a rebound, counting on a correction of 20-30 points within the day. To open short positions on GBP/USD, you need: The bears have taken a wait-and-see attitude and the main focus is currently on protecting resistance at 1.3237. Sellers' behavior at this level will determine the pair's succeeding direction. If buyers are not active, forming a false breakout in the 1.3237 area will be the first signal to open short positions in the pound, counting on it to fall to support 1.3168, which is now the middle of the horizontal channel. We can say that the bears have taken control of the market only when they have settled below 1.3168, which will quickly pull down the pound to the lower border of this channel at 1.3106. Only its breakout will indicate the resumption of the bearish trend, which could pull down the pound to new lows of 1.3034 and 1.2976, where I recommend taking profits. In case bears are not active at 1.3237, it is best to postpone short positions until the test of the monthly high of 1.3310, or sell the pound immediately upon a rebound from resistance 1.3378, counting on a correction of 20-30 points within the day. 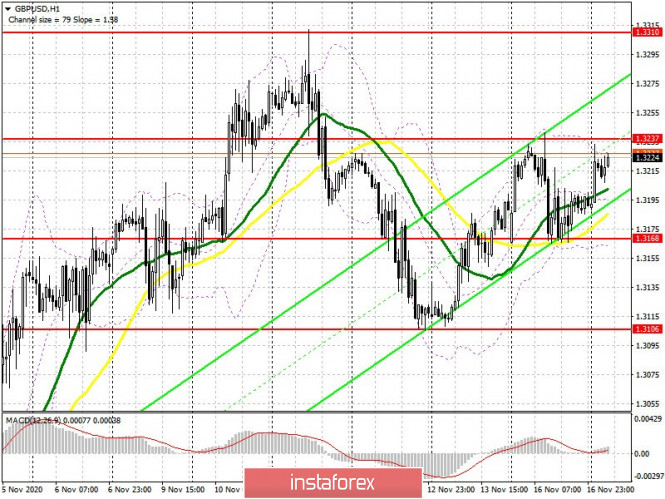 Indicator signals: Moving averages Trading is carried out just above the 30 and 50 moving averages, which indicates a slight advantage for the buyers of the pound. Note: The period and prices of moving averages are considered by the author on the H1 hourly chart and differs from the general definition of the classic daily moving averages on the daily D1 chart. Bollinger Bands A breakout of the upper border of the indicator in the 1.3235 area will lead to a new wave of growth for the pound. In case the pair falls, support will be provided by the lower border of the indicator at 1.3170. Description of indicators - Moving average (moving average, determines the current trend by smoothing out volatility and noise). Period 50. It is marked in yellow on the chart.
- Moving average (moving average, determines the current trend by smoothing out volatility and noise). Period 30. It is marked in green on the chart.
- MACD indicator (Moving Average Convergence/Divergence — convergence/divergence of moving averages) Quick EMA period 12. Slow EMA period to 26. SMA period 9
- Bollinger Bands (Bollinger Bands). Period 20
- Non-commercial speculative traders, such as individual traders, hedge funds, and large institutions that use the futures market for speculative purposes and meet certain requirements.
- Long non-commercial positions represent the total long open position of non-commercial traders.
- Short non-commercial positions represent the total short open position of non-commercial traders.
- Total non-commercial net position is the difference between short and long positions of non-commercial traders.
Indicator analysis. Daily review for the EUR/USD currency pair on November 17, 2020 2020-11-17 Trend analysis (Fig. 1). Today, the market from the level of 1.1850 (closing of yesterday's daily candlestick) may continue to move upward with the goal of 1.1875, which is a 76.4% pullback level (blue dotted line). Upon testing this level, the price will continue to work upward with the target of 1.1920 - the upper fractal (red dotted line). 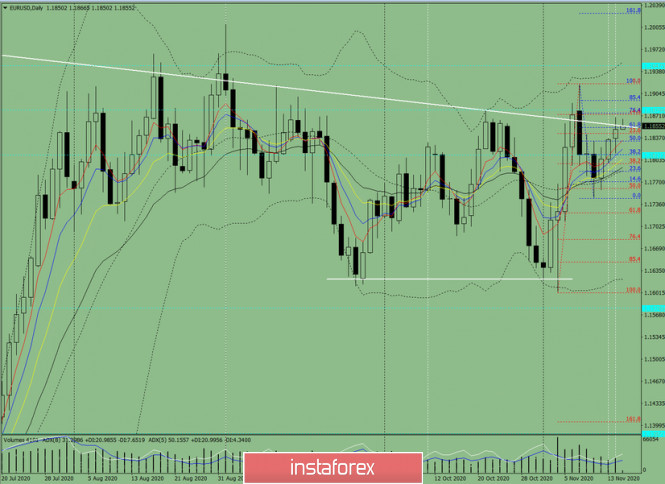
Figure 1 (Daily Chart). Comprehensive analysis: - Indicator analysis - up
- Fibonacci levels - up
- Volumes - up
- Candlestick analysis - up
- Trend analysis - up
- Bollinger bands - up
- Weekly chart - up
General conclusion: Today, the price from the level of 1.1850 (closing yesterday's daily candlestick) can continue to move upward with the goal of 1.1875, which is a 76.4% pullback level (blue dotted line). Upon testing this level, the price will continue to work upward with the goal of 1.1920 - the upper fractal (red dotted line). Unlikely scenario: when working upward, after reaching the 76.4% pullback level, which is 1.1875 (blue dotted line), the pair will work downward with the goal of 1.1798 - a pullback level of 38.2% (red dotted line). Technical Analysis of GBP/USD for November 17, 2020 2020-11-17 Technical Market Outlook: The GBP/USD pair has been trading close to the level of 1.3241 which is the intraday resistance and is struggling to break above it. The nearest technical resistance is seen at the level of 1.3264 - 1.3283, so any violation of this zone will open the road towards the swing high seen at 1.3306. The local technical support is seen at the level of 1.3165 and 1.3121, so as long as GBP trades above this levels the outlook remains bullish. The higher time frame trend remains up as well with a target seen at the level of 1.3380. Weekly Pivot Points: WR3 - 1.3481 WR2 - 1.3397 WR1 - 1.3286 Weekly Pivot - 1.3197 WS1 - 1.3085 WS2 - 1.2994 WS3 - 1.2882 Trading Recommendations: The GBP/USD pair is in the down trend on the monthly time frame, but the recent bounce from the low at 1.1411 made in the middle of March 2020 looks very strong and might be a reversal swing. In order to confirm the trend change, the bulls have to break through the technical resistance seen at the level of 1.3518. All the local corrections should be used to enter a buy orders as long as the level of 1.2674 is not broken. 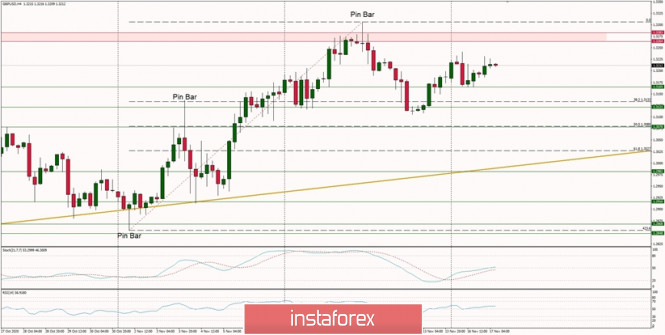
Analytics and trading signals for beginners. How to trade EUR/USD on November 17? Plan for opening and closing trades on Tuesday 2020-11-17 Hourly chart of the EUR/USD pair 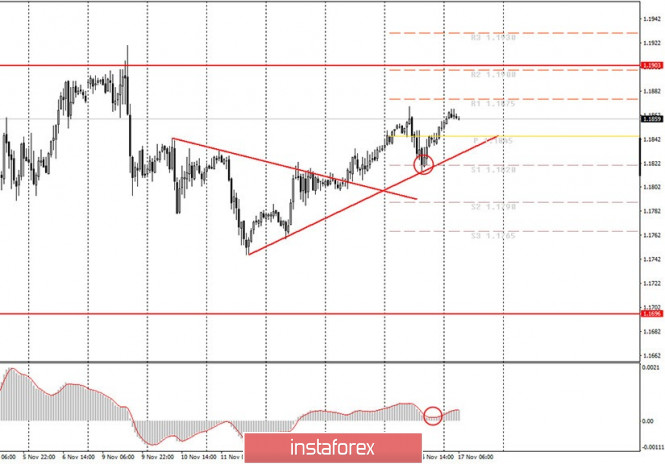 The EUR/USD pair continued a weak upward movement last night, according to our forecasts, which were presented in the previous evening article. Since novice traders have an upward trend line, the trend is clearly visible now - an upward trend. Therefore, you are advised to trade up now. The MACD indicator produced a buy signal last night, and those who used it to enter the market are currently in profit of about 20 points. Now you can wait for any of the new targets to be reached, or you can leave a long position by a downward reversal of MACD. Take note that the EUR/USD pair continues to trade within the $1.17-1.19 horizontal channel. Thus, a reversal in the opposite direction is very likely when the price approaches any of the channel boundaries. Since at the time of this writing, the rate is 1.1860, then one can expect a new downward movement to begin at these positions. However, remember that the trend will remain upward until the price settles below the trendline. Today we will turn our attention to the US retail sales report for the month of October. Frankly speaking, the market ignored the latest reports on this indicator, however, provided that the real value differs greatly from the forecast, we can see a definite reaction. In addition to this report, the next speech by the Chairman of the European Central Bank Christine Lagarde will take place today. Lately she has been speaking almost every day, but you should understand that speaking also means through video conferences. That is, in fact, Lagarde can discuss various pressing issues with colleagues via video link, and this event is marked on the calendar as a speech. Thus, with a high degree of probability, Lagarde will not mention anything important and of interest to the markets today. Consequently, trading can remain calm for most of the day. However, this does not mean that the pair will simply stand still. Recall that in the long term, the pair has been standing still on higher timeframes for three months, but it has been quite active on lower timeframes, just in a limited price range. Perhaps the US could provide some interesting information today, but now only appalling levels of coronavirus incidence can be noted there. The account is already in the hundreds of thousands. This factor may put pressure on the dollar, but will it be enough to break through the upper boundary of the 1.1900 channel? Possible scenarios for November 17: 1) Since the price continues to trade above the upward trend line, long positions are now relevant. The growth potential of the euro, as always, is limited by the 1.1903 level, however, you can manage to get a profit even before this level. The MACD indicator is preparing to turn to the downside, which can be used to close long positions. In this case, to open new buy positions, you will need to wait for a new buy signal and trade up while aiming for 1.1875 and 1.1900. 2) Trading for a fall at this time is irrelevant, since there is a pronounced upward trend. Thus, novice traders are advised to wait until the upward trend has ended in order to have a reason to open short positions. Namely, the price should settle below the trend line. In this case, open sell orders while aiming for 1.1820 and 1.1790. On the chart: Support and Resistance Levels are the Levels that serve as targets when buying or selling the pair. You can place Take Profit near these levels. Red lines are the channels or trend lines that display the current trend and show in which direction it is better to trade now. Up/down arrows show where you should sell or buy after reaching or breaking through particular levels. The MACD indicator (14,22,3) consists of a histogram and a signal line. When they cross, this is a signal to enter the market. It is recommended to use this indicator in combination with trend lines (channels and trend lines). Important announcements and economic reports that you can always find in the news calendar can seriously influence the trajectory of a currency pair. Therefore, at the time of their release, we recommended trading as carefully as possible or exit the market in order to avoid a sharp price reversal. Beginners on Forex should remember that not every single trade has to be profitable. The development of a clear strategy and money management are the key to success in trading over a long period of time. Technical Analysis of EUR/USD for November 17, 2020 2020-11-17 Technical Market Outlook: The EUR/USD pair has been moving up inside of a ascending channel towards the level of 1.1879. The move up looks like a bounce for now, but if the level of 1.1879 is violated, then the bulls will be in control of the market again and might push the price higher towards the swing high seen at the level of 1.1920. The strong and positive momentum supports the bullish short-term outlook for Euro. Please notice the overbought market conditions might cause temporary pull backs along the way up. Weekly Pivot Points: WR3 - 1.2099 WR2 - 1.2008 WR1 - 1.1924 Weekly Pivot - 1.1834 WS1 - 1.1747 WS2 - 1.1659 WS3 - 1.1571 Trading Recommendations: Since the middle of March 2020 the main trend is on EUR/USD pair has been up, which can be confirmed by almost 10 weekly up candles on the weekly time frame chart and 4 monthly up candles on the monthly time frame chart. The recent correction towards the level of 1.1612 seems to be completed and now market is ready for another wave up. This means any local corrections should be used to buy the dips until the key technical support is broken. The key long-term technical support is seen at the level of 1.1445. The key long-term technical resistance is seen at the level of 1.2555. 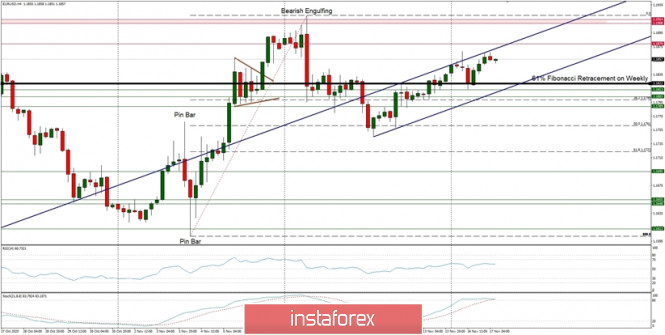
Simplified wave analysis and forecast for GBP/USD and USD/JPY on November 17 2020-11-17 GBP/USD Analysis: An upward wave has been forming on the British pound chart since September 10. A counter correction has been forming since October 21. According to Eliot, it has the appearance of a shifting plane. The corrective movement is in its final phase. Forecast: In the first half of the day today, a flat mood of movement is expected, with a downward vector. By the end of the day, you can expect an increase in activity and a return to the bullish rate. A break above the calculated resistance is unlikely today. Potential reversal zones Resistance: - 1.3270/1.3300 Support: - 1.3160/1.3130 Recommendations: Until the correction is complete, trading in the pound may be unprofitable. It is recommended to refrain from entering the pair's market at this time. In the area of the support zone, you should track the signals for buying the instrument. 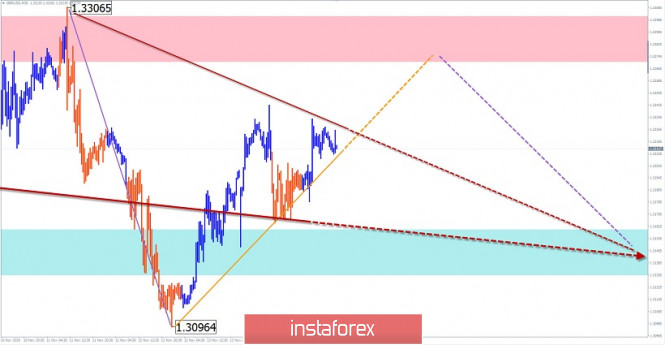
USD/JPY Analysis: Since November 6, an upward reversal wave pattern has been forming on the Japanese yen major chart. In the last decade, the price is adjusted down. Analysis of the structure shows that this movement is not over. Forecast: By the end of the current day, the price is expected to move between the nearest zones. An upward movement vector is more likely in the European session. By the end of the day, you can expect a reversal and a repeated decline in the support area. Potential reversal zones Resistance: - 104.90/105.20 Support: - 104.20/103.90 Recommendations: Trading on the pair's market today is only possible within the intraday. You should be careful when purchasing. Sales are more promising. 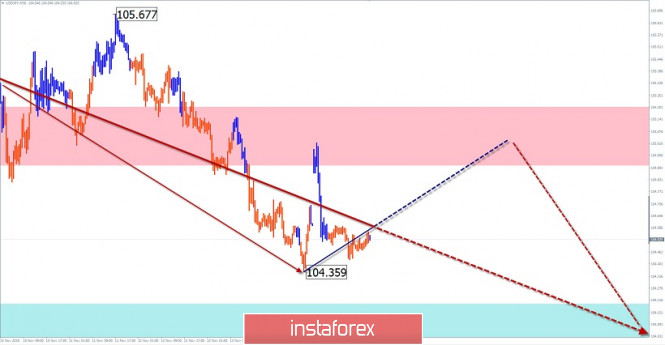
Explanation: In the simplified wave analysis (UVA), waves consist of 3 parts (A-B-C). The last incomplete wave is analyzed. The solid background of the arrows shows the formed structure, and the dotted background shows the expected movements. Note: The wave algorithm does not take into account the duration of the instrument's movements in time! EUR/USD. November 17. COT report. Will Donald Trump take revenge on China and what could be the consequences for the dollar and America 2020-11-17 EUR/USD – 1H. 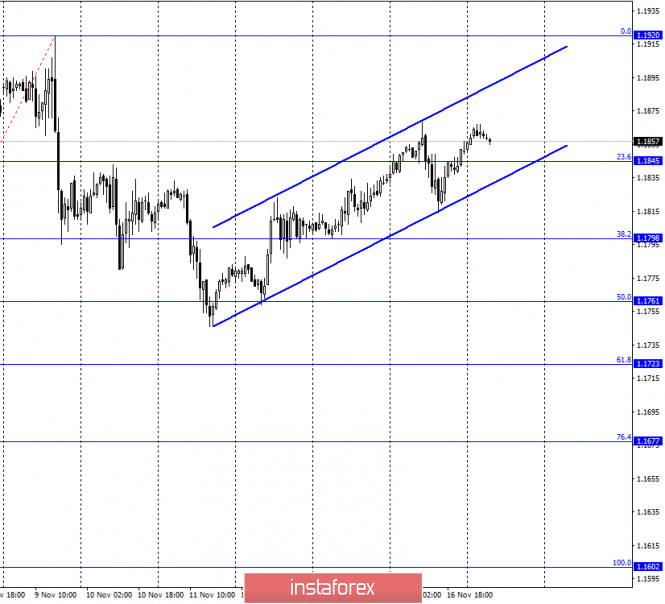
On November 16, the EUR/USD pair performed a slight drop of 50 points, after which it turned in favor of the European currency and resumed the growth process in the direction of the corrective level of 0.0% (1.1920). Thus, the mood of traders remains "bullish", as indicated by the upward trend corridor. Meanwhile, there is very little news and reports now, so all the attention is back on Donald Trump, who continues to leave a huge number of messages in his Twitter account, most of which relate to the election. Yesterday, Donald Trump, for example, once again wrote that "he won the election", and "the recount of votes in Georgia does not mean anything, since none of the representatives of his party are still allowed to sign". However, the world community is now openly afraid not of the election results, but the last 2.5 months of Trump at the helm of America. Many experts believe that Trump will try to slam the door loudly for the last time, and this slam may be inflicted on China. Trump has repeatedly blamed China for unfair trade with America, and then for the coronavirus that swept the world, but hit the United States the hardest. It is possible that if it were not for COVID-2019, then Trump would have been re-elected for a second term. There would not have been millions infected, there would not have been hundreds of thousands of deaths, the country's economy would not have collapsed by a record 33%. Thus, it is possible that Trump blames China for the election defeat and, accordingly, may inflict a "blow of revenge" in the form of new sanctions and trade restrictions. However, this step will also affect the American economy, however, Trump will no longer care. EUR/USD – 4H. 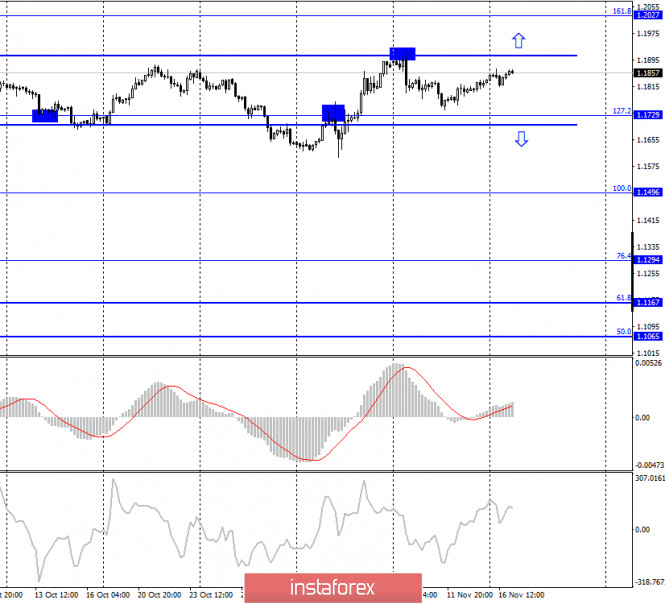
On the 4-hour chart, the pair's quotes performed a reversal in favor of the EU currency and continue the growth process in the direction of the upper border of the 1.1907 side corridor. A new rebound of quotes from this line will again work in favor of the US currency and some fall in the direction of the corrective level of 127.2% (1.1729). Fixing the pair's rate above the side corridor will significantly increase the probability of further growth towards the next corrective level of 161.8% (1.2027). EUR/USD – Daily. 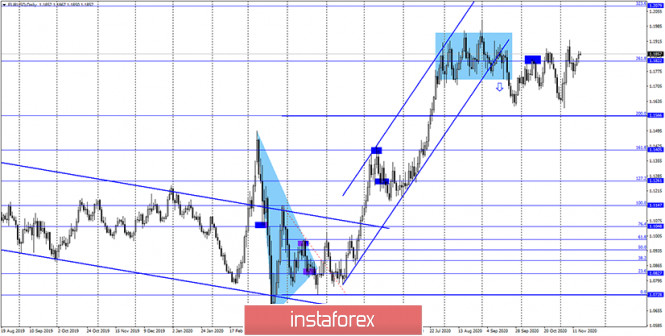
On the daily chart, the quotes of the EUR/USD pair performed a new reversal in favor of the European currency and fixed above the corrective level of 261.8% (1.1825). This level remains weak, and I recommend paying more attention to the lower charts, which respond more quickly to changes in the market. EUR/USD – Weekly. 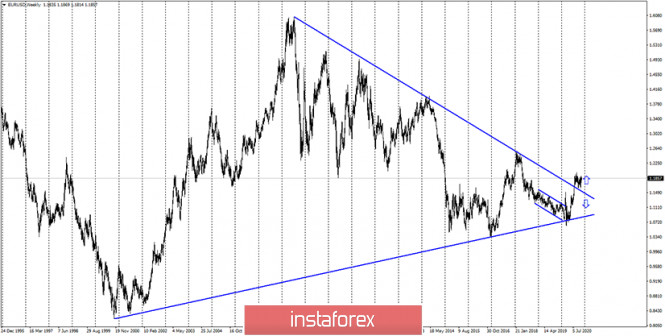
On the weekly chart, the EUR/USD pair performed a consolidation above the "narrowing triangle", which preserves the prospects for further growth of the pair, but in the long term. In the short term, a drop is preferable. Overview of fundamentals: On November 16, a new speech by Christine Lagarde took place in the European Union, which did not interest traders. There was no more important news during the day. The information background was rather weak. News calendar for the USA and the European Union: US - retail trade volume change (13:30 GMT). EU - ECB President Christine Lagarde will deliver a speech (16:00 GMT). On November 17, the European Union calendar again includes a speech by ECB President Christine Lagarde. However, her recent speeches were more about the coronavirus vaccine, and economic problems were very superficial. In America – a report on retail sales. COT (Commitments of Traders) report: 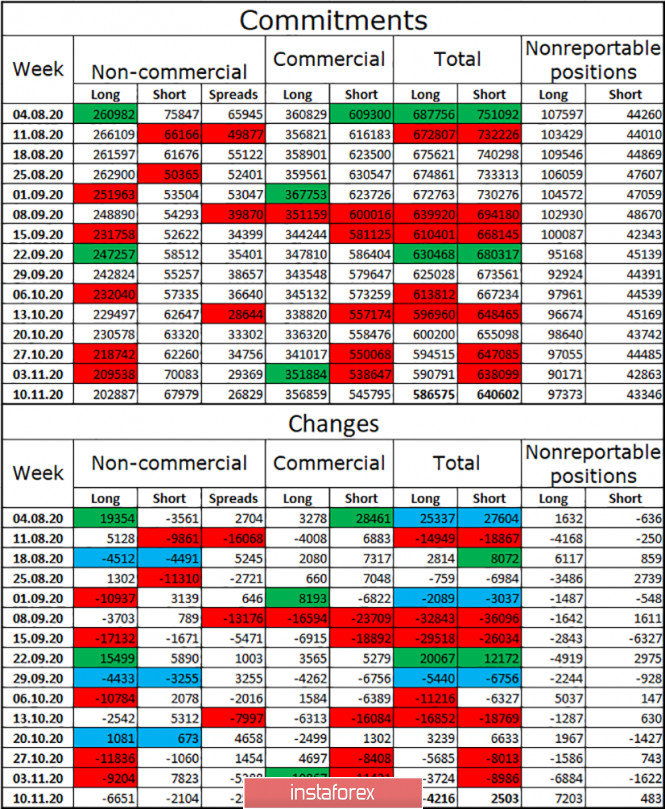
The latest COT report was released with some delay. The most important category of "Non-commercial" traders got rid of another 6.6 thousand long contracts during the reporting week (-9.2 thousand a week earlier), so speculators continue to close contracts for the purchase of the European currency. However, they also closed 2.1 thousand short-contracts. However, despite this, the strengthening of the "bearish" mood continues in the most important category of traders. Based on this, I conclude that the European currency is falling, but recent months show that the euro currency is not falling. However, the total number of long contracts in the hands of speculators continues to decline, while short contracts continue to grow. Therefore, no other conclusions can be drawn now. Forecast for EUR/USD and recommendations for traders: Today, I recommend selling the euro currency with targets of 1.1798 and 1.1761, if the closing is performed under the ascending corridor on the hourly chart. Purchases of the pair will be possible with a target of 1.2027 if it is fixed above the side corridor on the 4-hour chart. Terms: "Non-commercial" - major market players: banks, hedge funds, investment funds, private, large investors. "Commercial" - commercial enterprises, firms, banks, corporations, companies that buy currency not for speculative profit, but for current activities or export-import operations. "Non-reportable positions" - small traders who do not have a significant impact on the price. GBP/USD. November 17. COT report. The information space is being torn apart by differing opinions about trade deal negotiations. 2020-11-17 GBP/USD – 1H. 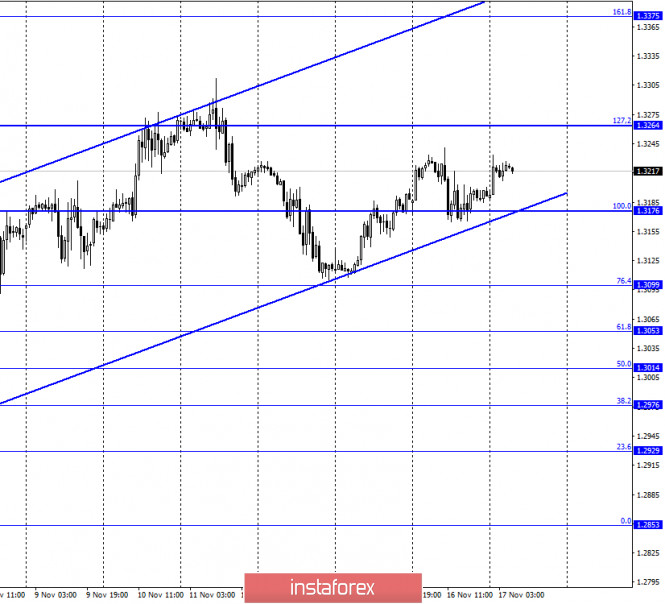
According to the hourly chart, the quotes of the GBP/USD pair fell to the corrective level of 100.0% (1.3176), rebounded from it, and resumed the growth process in the direction of the corrective level of 127.2% (1.3264), while being inside the ascending corridor, which characterizes the current mood of traders as "bullish". Fixing the pair's rate under the corridor will work in favor of the US currency and the beginning of the fall. At the same time, negotiations between London and Brussels continue. Still, both sides do not make any statements about the progress in the negotiations, however, this topic is extremely important, so many media outlets try to get their insider information. For example, Reuters said that the previous round of negotiations again ended in nothing, and there is extremely little time left for negotiations and the subsequent ratification of the deal. According to some European officials, it may already be too late. At the same time, the Guardian writes that negotiations on the deal may continue until December 28. The British tabloid also reports that differences over fishing in British waters remain significant. The Guardian considers the small amount of time left for negotiations to be the main problem. However, David Frost still believes that the deal can be agreed upon in time, but does not specify how many issues the parties have yet to agree on. In general, it is difficult to say something definite now, however, it is even more difficult to conclude. GBP/USD – 4H. 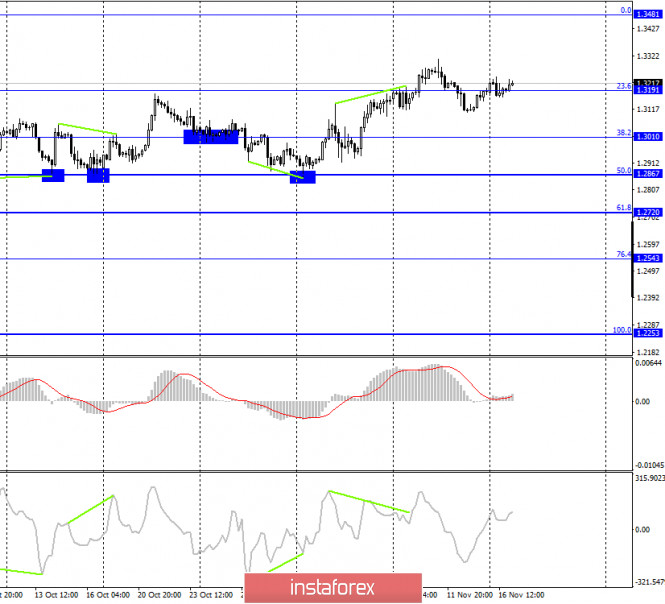
On the 4-hour chart, the GBP/USD pair performed a new reversal in favor of the British, and a new consolidation above the corrective level of 23.6% (1.3191). Thus, the growth process can be continued towards the next Fibo level of 0.0% (1.3481). There are no emerging divergences today. Closing the pair's exchange rate under the corrective level of 23.6% will again work in favor of the US dollar and some fall in the direction of the corrective level of 38.2% (1.3010). GBP/USD – Daily. 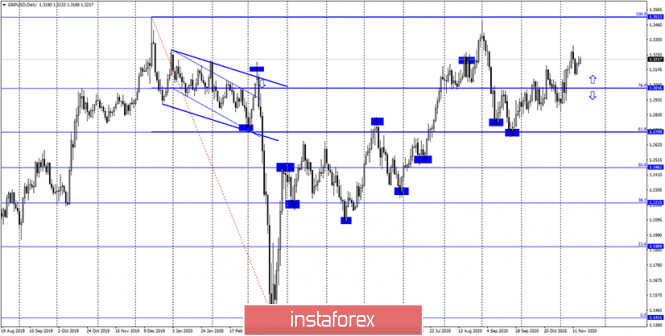
On the daily chart, the pair's quotes continue to grow in the direction of the corrective level of 100.0% (1.3513). However, when trading a pair, I recommend paying more attention to the most lower charts. They are now more informative. GBP/USD – Weekly. 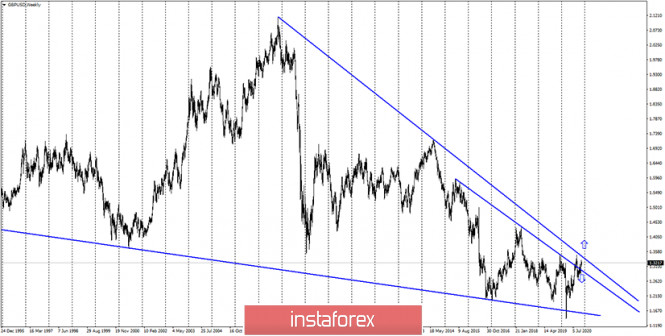
On the weekly chart, the pair GBP/USD has performed a new close above the upper descending trend line, although it had previously been falsely broken through this line. In recent weeks, the pair has made new attempts to gain a foothold over both trend lines. Overview of fundamentals: There were no major reports or other events in the UK or America on Monday. The information background was extremely weak. Us and UK news calendar: UK - Bank of England Governor Andrew Bailey will deliver a speech (11:00 GMT). US - retail trade volume change (13:30 GMT). On November 17, the Governor of the Bank of England will speak. He might have something interesting to say. In America – this is a fairly important report on retail trade. COT (Commitments of Traders) report: 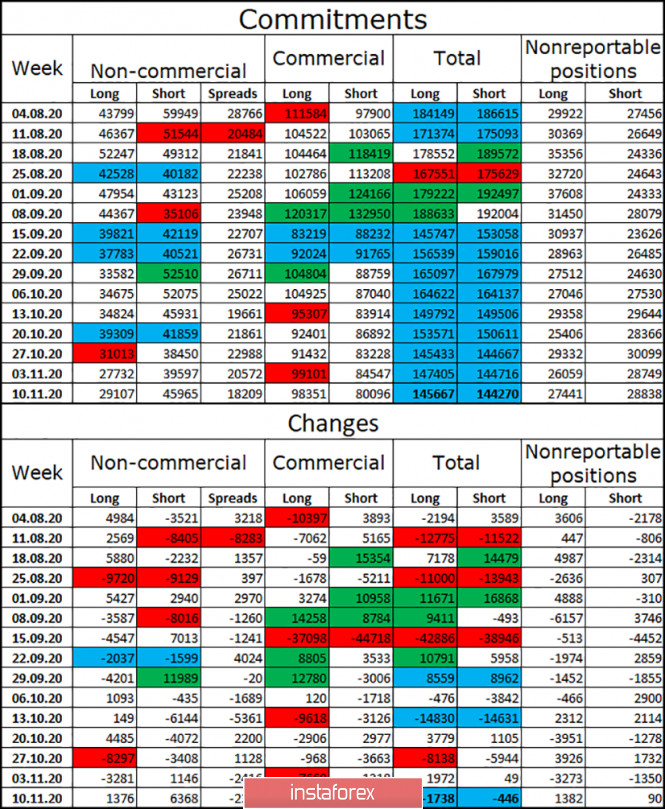
The latest COT report on the British pound showed that the mood of the "Non-commercial" category of traders became even more "bearish" during the reporting week. Speculators this time opened 1.4 thousand long-contracts, but at the same time increased 6.4 thousand short-contracts. The British pound as a whole has continued to grow in recent weeks despite COT reports. However, not every week the mood of traders became more "bearish". However, the latest COT report suggests that the British currency is about to fall. I also note an almost equal number of open long and short contracts for all categories of traders and a fairly small total number of contracts in the hands of the "Non-commercial" category. This means that speculators are not eager to deal with the pound right now. Forecast for GBP/USD and recommendations for traders: Today, I recommend selling the GBP/USD pair with targets of 1.3099 and 1.3053 if the closing is performed under the ascending corridor on the hourly chart. A rebound was made from the lower border of the ascending channel and the level of 100.0% (1.3176). Thus, now you can stay in purchases with the goal of 1.3264. Terms: "Non-commercial" - major market players: banks, hedge funds, investment funds, private, large investors. "Commercial" - commercial enterprises, firms, banks, corporations, companies that buy currency not for speculative profit, but for current activities or export-import operations. "Non-reportable positions" - small traders who do not have a significant impact on the price. Forex forecast 11/17/2020 on Bitcoin, EURUSD, SP500 and Gold from Sebastian Seliga 2020-11-17 Let's take a look at the technical picture of Bitcoin, EUR/USD, SP500 and GOLD ahead of very busy day on the financial markets. Macroeconomic events review is also included in the video. Trading plan for the EUR/USD pair on November 17. New COVID-19 vaccine; unclear direction of the European currency. 2020-11-17 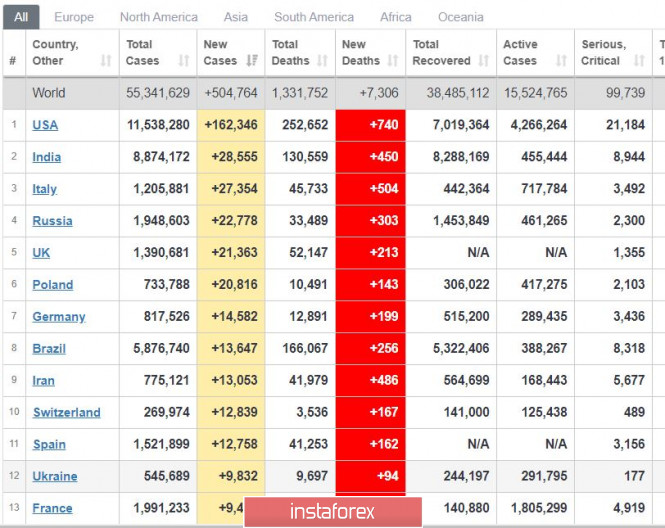
COVID-19 incidence around the world is again high - at 504 thousand - but noticeably below the peak, which is 660 thousand. About 162 thousand were from the United States, while 10 thousand were from France. Good news is that although most of Europe records a high number of coronavirus infections, there is no significant increase in new cases. To add to that, another vaccine came out, in which American biotechnology company, Moderna, announced the successful trial and high efficacy of its vaccine. Such pushed the US market to record highs. 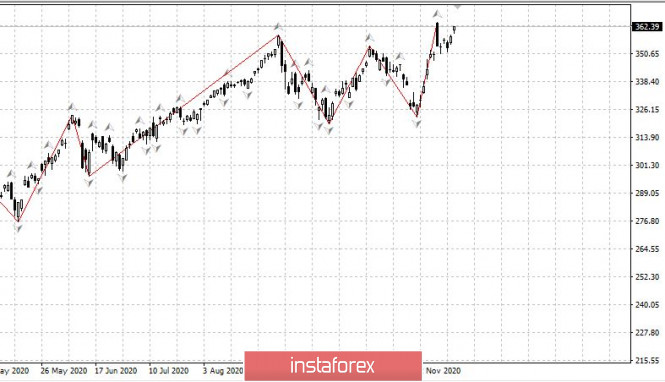
S&P 500, US market. 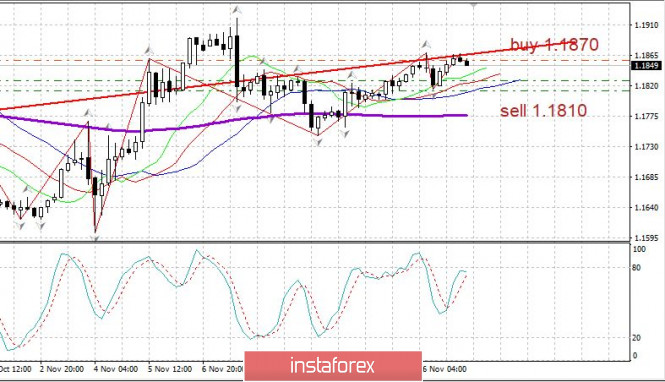
EUR/USD - the situation is extremely unclear. Open long positions at 1.1825 or 1.1790, but be ready for a stop and a downward reversal from 1.1810. Technical analysis of AUD/USD for November 17, 2020 2020-11-17 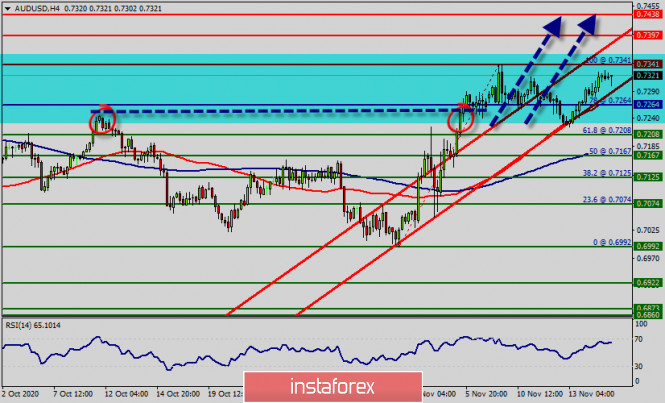 Overview : The AUD/USD pair has faced strong support at the level of 0.7264 because resistance became support. So, the strong support has been already faced at the level of 0.7264 and the pair is likely to try to approach it in order to test it again. The level of 0.7264 represents a weekly pivot point for that it is acting as minor support this week. Furthermore, the AUD/USD pair is continuing to trade in a bullish trend from the new support level of 0.7264. Currently, the price is in a bullish channel. According to the previous events, we expect the AUD/USD pair to move between 0.7264 and 0.7341. Also, it should be noticed that the double top is set at 0.7341. Additionally, the RSI is still signaling that the trend is upward as it remains strong above the moving average (100). This suggests the pair will probably go up in coming hours. Accordingly, the market is likely to show signs of a bullish trend. This would suggest a bearish market because the moving average (100 & 50) is still in a positive area and does not show any trend-reversal signs at the moment. In other words, buy orders are recommended above 0.7264 with the first target at the level of 0.7341. If the trend is be able to break the double top at the level of 0.7341, then the market will continue rising towards the weekly resistance 1 at 0.7397. Thus, the market is indicating a bullish opportunity above the above-mentioned support levels, for that the bullish outlook remains the same as long as the 100 EMA is headed to the upside. Moreover, if the pair succeeds in passing through the level of 0.7397, the market will indicate a bullish opportunity above the level of 0.7397. A breakout of that target will move the pair further upwards to 0.7438. On the other hand, if the AUD/USD pair fails to break through the resistance level of 0.7397 this week, the market will decline further to 0.7264. The pair is expected to drop lower towards at least 0.7264 with a view to test the weekly pivot point. Also, it should be noted that the weekly pivot point will act as minor support today. But in overall, we still prefer the bullish scenario.
Author's today's articles: Torben Melsted  Born in November 1962. Graduated from CBS, got Diploma in Finance. Began trading on Forex in 1986 and since that time held various positions such as advising clients, hedging client flows on FX and commodity markets. Also worked for major corporations as Financial Risk Manager. Uses Elliott wave analysis in combination with classic technical analysis, and has been using a Calmar Ratio of 5.0 for over 3 years. Has his own blog, where he uses Elliott wave and technical analysis on all financial markets. Born in November 1962. Graduated from CBS, got Diploma in Finance. Began trading on Forex in 1986 and since that time held various positions such as advising clients, hedging client flows on FX and commodity markets. Also worked for major corporations as Financial Risk Manager. Uses Elliott wave analysis in combination with classic technical analysis, and has been using a Calmar Ratio of 5.0 for over 3 years. Has his own blog, where he uses Elliott wave and technical analysis on all financial markets. Maxim Magdalinin  In 2005 graduated from the Academy of the Ministry of Internal Affairs of the Republic of Belarus, law faculty. Worked as a lawyer for three years in one of the biggest country's company. Besides the trading, he develops trading systems, writes articles and analytical reviews. Works at stock and commodity markets explorations. On Forex since 2006. In 2005 graduated from the Academy of the Ministry of Internal Affairs of the Republic of Belarus, law faculty. Worked as a lawyer for three years in one of the biggest country's company. Besides the trading, he develops trading systems, writes articles and analytical reviews. Works at stock and commodity markets explorations. On Forex since 2006. Sergey Belyaev  Born December 1, 1955. In 1993 graduated from Air Force Engineering Academy. In September 1999 started to study Forex markets. Since 2002 has been reading lectures on the technical analysis . Is fond of research work. Created a personal trading system based on the indicator analysis. Authored the book on technical analysis "Calculation of the next candlestick". At present the next book is being prepared for publishing "Indicator Analysis of Forex Market. Trading System Encyclopedia". Has created eleven courses on indicator analysis. Uses classical indicators. Works as a public lecturer. Held numerous seminars and workshops presented at international exhibitions of financial markets industry. Is known as one of the best specialists in the Russian Federation researching indicator analysis. Born December 1, 1955. In 1993 graduated from Air Force Engineering Academy. In September 1999 started to study Forex markets. Since 2002 has been reading lectures on the technical analysis . Is fond of research work. Created a personal trading system based on the indicator analysis. Authored the book on technical analysis "Calculation of the next candlestick". At present the next book is being prepared for publishing "Indicator Analysis of Forex Market. Trading System Encyclopedia". Has created eleven courses on indicator analysis. Uses classical indicators. Works as a public lecturer. Held numerous seminars and workshops presented at international exhibitions of financial markets industry. Is known as one of the best specialists in the Russian Federation researching indicator analysis. Sebastian Seliga  Sebastian Seliga was born on 13th Oсtober 1978 in Poland. He graduated in 2005 with MA in Social Psychology. He has worked for leading financial companies in Poland where he actively traded on NYSE, AMEX and NASDAQ exchanges. Sebastian started Forex trading in 2009 and mastered Elliott Wave Principle approach to the markets by developing and implementing his own trading strategies of Forex analysis. Since 2012, he has been writing analitical reviews based on EWP for blogs and for Forex websites and forums. He has developed several on-line projects devoted to Forex trading and investments. He is interested in slow cooking, stand-up comedy, guitar playing, reading and swimming. "Every battle is won before it is ever fought", Sun Tzu Sebastian Seliga was born on 13th Oсtober 1978 in Poland. He graduated in 2005 with MA in Social Psychology. He has worked for leading financial companies in Poland where he actively traded on NYSE, AMEX and NASDAQ exchanges. Sebastian started Forex trading in 2009 and mastered Elliott Wave Principle approach to the markets by developing and implementing his own trading strategies of Forex analysis. Since 2012, he has been writing analitical reviews based on EWP for blogs and for Forex websites and forums. He has developed several on-line projects devoted to Forex trading and investments. He is interested in slow cooking, stand-up comedy, guitar playing, reading and swimming. "Every battle is won before it is ever fought", Sun Tzu Stanislav Polyanskiy  Graduated from Odessa State Economic University. On Forex since 2006. Writes analytical reviews about international financial markets for more than 3 years. Worked as a currency analyst in different finance companies for a long time including the biggest companies of Russia and Ukraine. Graduated from Odessa State Economic University. On Forex since 2006. Writes analytical reviews about international financial markets for more than 3 years. Worked as a currency analyst in different finance companies for a long time including the biggest companies of Russia and Ukraine. Vyacheslav Ognev  Vyacheslav was born on August 24, 1971. In 1993, he graduated from Urals State University of Economics in the Russian city of Ekaterinburg holding a degree in Commerce and Economics of Trade. In 2007, he started concentrating on the Russian stock market, trading stocks on the RTS Stock Exchange and futures contracts on FORTS. Since 2008 he has been engaged in analyzing Forex market and trading currencies. He is an author of a simplified wave analysis method. He has also developed a trading strategy. At present, Vyacheslav is a co-author of training materials on two web portals dedicated to Forex trading education. Interests: fitness, F1 "Experience is the best of schoolmasters, only the school fees are heavy." - Thomas Carlyle Vyacheslav was born on August 24, 1971. In 1993, he graduated from Urals State University of Economics in the Russian city of Ekaterinburg holding a degree in Commerce and Economics of Trade. In 2007, he started concentrating on the Russian stock market, trading stocks on the RTS Stock Exchange and futures contracts on FORTS. Since 2008 he has been engaged in analyzing Forex market and trading currencies. He is an author of a simplified wave analysis method. He has also developed a trading strategy. At present, Vyacheslav is a co-author of training materials on two web portals dedicated to Forex trading education. Interests: fitness, F1 "Experience is the best of schoolmasters, only the school fees are heavy." - Thomas Carlyle Grigory Sokolov  Born 1 January, 1986. In 2008 graduated from Kiev Institute of Business and Technology with "Finance and Credit" as a major. Since 2008 has studied the behavior of various currency pairs and their correlation on Forex. In his works and trading practice he uses candlestick analysis and Fibonacci technique. Since 2009 has written analytical reviews and articles which are published on popular Internet resources. Interests: music, computers and cookery. "Out of five deadly sins of business and as a rule, the most widespread, excessive striving to get profit is the worst". P. Drucker Born 1 January, 1986. In 2008 graduated from Kiev Institute of Business and Technology with "Finance and Credit" as a major. Since 2008 has studied the behavior of various currency pairs and their correlation on Forex. In his works and trading practice he uses candlestick analysis and Fibonacci technique. Since 2009 has written analytical reviews and articles which are published on popular Internet resources. Interests: music, computers and cookery. "Out of five deadly sins of business and as a rule, the most widespread, excessive striving to get profit is the worst". P. Drucker Mihail Makarov  - - Mourad El Keddani  Was born in Oujda, Morocco. Currently lives in Belgium. In 2003 obtained B.S. in Experimental Sciences. In 2007 obtained a graduate diploma at Institut Marocain Specialise en Informatique Applique (IMSIA), specialty – Software Engineering Analyst. In 2007–2009 worked as teacher of computer services and trainer in a professional school specializing in computer technologies and accounting. In 2005 started Forex trading. Authored articles and analytical reviews on Forex market on Forex websites and forums. Since 2008 performs Forex market research, and develops and implements his own trading strategies of Forex analysis (especially in Forex Research & Analysis, Currency Forecast, and Recommendations and Analysis) that lies in: Numerical analysis: Probabilities, equations and techniques of applying Fibonacci levels. Classical analysis: Breakout strategy and trend indicators. Uses obtained skills to manage traders' accounts since 2009. In April 2009 was certified Financial Technician by the International Federation of Technical Analysts. Winner of several social work awards: Education Literacy and Non-Formal Education (in Literacy and Adult Education in The National Initiative for Human Development). Was born in Oujda, Morocco. Currently lives in Belgium. In 2003 obtained B.S. in Experimental Sciences. In 2007 obtained a graduate diploma at Institut Marocain Specialise en Informatique Applique (IMSIA), specialty – Software Engineering Analyst. In 2007–2009 worked as teacher of computer services and trainer in a professional school specializing in computer technologies and accounting. In 2005 started Forex trading. Authored articles and analytical reviews on Forex market on Forex websites and forums. Since 2008 performs Forex market research, and develops and implements his own trading strategies of Forex analysis (especially in Forex Research & Analysis, Currency Forecast, and Recommendations and Analysis) that lies in: Numerical analysis: Probabilities, equations and techniques of applying Fibonacci levels. Classical analysis: Breakout strategy and trend indicators. Uses obtained skills to manage traders' accounts since 2009. In April 2009 was certified Financial Technician by the International Federation of Technical Analysts. Winner of several social work awards: Education Literacy and Non-Formal Education (in Literacy and Adult Education in The National Initiative for Human Development).
Languages: Arabic, English, French and Dutch.
Interests: Algorithm, Graphics, Social work, Psychology and Philosophy.
Subscription's options management Theme's:
Fundamental analysis, Fractal analysis, Wave analysis, Technical analysis, Stock Markets
Author's :
A Zotova, Aleksey Almazov, Alexander Dneprovskiy, Alexandr Davidov, Alexandros Yfantis, Andrey Shevchenko, Arief Makmur, Dean Leo, Evgeny Klimov, Fedor Pavlov, Grigory Sokolov, I Belozerov, Igor Kovalyov, Irina Manzenko, Ivan Aleksandrov, l Kolesnikova, Maxim Magdalinin, Mihail Makarov, Mohamed Samy, Mourad El Keddani, Oleg Khmelevskiy, Oscar Ton, Pavel Vlasov, Petar Jacimovic, R Agafonov, S Doronina, Sebastian Seliga, Sergey Belyaev, Sergey Mityukov, Stanislav Polyanskiy, T Strelkova, Torben Melsted, V Isakov, Viktor Vasilevsky, Vladislav Tukhmenev, Vyacheslav Ognev, Yuriy Zaycev, Zhizhko Nadezhda
Edit data of subscription settings
Unsubscribe from the mailing list Sincerely,
Analysts Service | If you have any questions, you can make a phone call using one of the
InstaForex Toll free numbers right now:
|  | InstaForex Group is an international brand providing online trading services to the clients all over the world. InstaForex Group members include regulated companies in Europe, Russia and British Virgin Islands. This letter may contain personal information for access to your InstaForex trading account, so for the purpose of safety it is recommended to delete this data from the history. If you have received this letter by mistake, please contact InstaForex Customer Relations Department. |


No comments:
Post a Comment