| Technical analysis of USD/JPY for October 26, 2020 2020-10-26 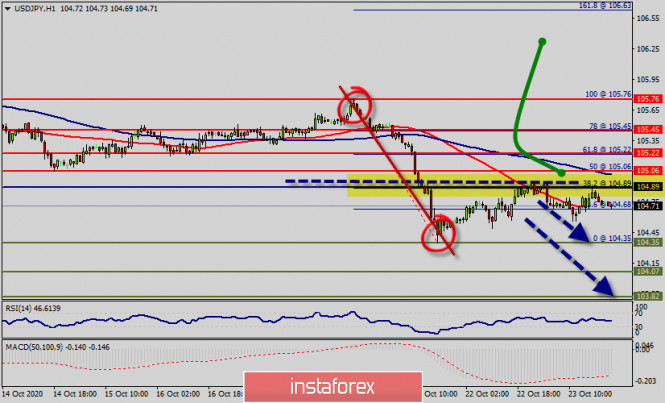 Overview : The trend is still trading around the key level of 104.89 which represents with the daily pivot point on the H1 chart. Bullish outlook : The USD/JPY pair is continuing in a bullish market from the supports of 104.68 and 104.89. Also, it should be noted that the current price is in a bullish channel. Equally important, the RSI is still signaling that the trend is upward as it is still strong above the moving average (100) since yesterday. Immediate support is seen at 104.89 which coincides with a ratio (23.6% of Fibonacci). Consequently, the first support sets at the level of 104.89. So, the market is likely to show signs of a bullish trend around the spot of 104.89. In other words, buy orders are recommended above the pivot point (104.89) with the first target at the level of 105.22. Furthermore, if the trend is able to break through the first resistance of 105.06. The movement is likely to resume to the point 105.22 and further to the point 105.22. As a result, the pair will climb towards the double top (105.76) to test it. Bearish outlook : The USD/JPY pair will drop sharply from the 104.89 level towards 104.68 in case a breakout at the 0.9915 (daily pivot point). It should be noted that the volatility is very high for that the price of the USD/JPY pair is still moving between 104.89 and 104.35 in the coming hours. Additionally, currently the price is in a bearish channel. According to the previous events, the pair is still in a downtrend. From this point, the USD/JPY pair is continuing in a bearish trend from the new resistance of 104.89. Thereupon, the price spot of 104.89 remains a significant resistance zone. Therefore, the possibility that the Yen will have a downside momentum is rather convincing and the structure of the fall does not look corrective. In order to indicate a bearish opportunity below 104.89, it will be a good signal to sell below 104.89 with the first target of 104.68. It is equally important that it will call for downtrend in order to continue bearish trend towards 104.35. Technical analysis of EUR/USD for October 26, 2020 2020-10-26 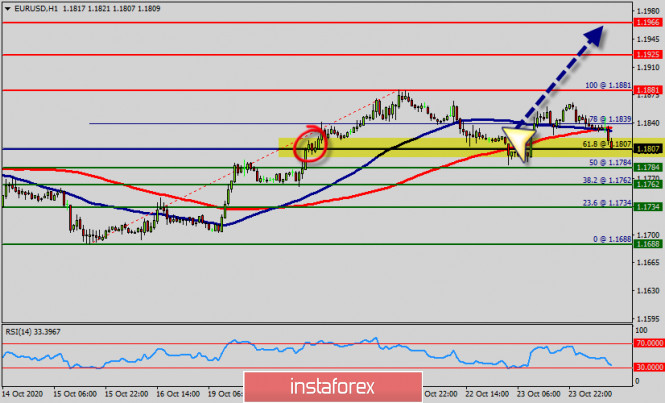 Overview : The EUR/USD pair climbed from 1.1807 to 1.1881 and closed at the price of 1.1881 (return to pivot). Today we note that the market is still trading below the level of 1.1881. Please, note that the resistance stands at the levels of 1.1881 and 1.1925 in the daily time frame. In the longer term, the strong resistance at 1.1996, continues to represent a major hurdle. Therefore, right now the first ascending impulse is forming the first one; the market is being corrected from the area of 1.1807. Hence, the EUR/USD pair faced resistance at the level of 1.1925, while minor resistance is seen at 1.1881. Support is found at the levels of 1.1807 and 1.1784. Pivot point has already set at the level of 1.1807. Equally important, the EUR/USD pair is still moving around the key level at 1.1807, which represents a daily pivot in the H1 time frame at the moment. Yesterday, the EUR/USD pair continued to move upwards from the level of 1.1807. The pair will rise to the top around 1.1881 from the level of 1.1807 (coincides with the ratio of 61.8% Fibonacci retracement). In consequence, the EUR/USD pair broke resistance, which turned into strong support at the level of 1.1807. The level of 1.1807 is expected to act as the major support today. We expect the EUR/USD pair to keep to trade in the bullish trend towards the target levels of 1.1925 and 1.1966. On the other hand, if a breakout happens at the support level of 1.1807 , then this scenario may be invalidated. If the pair fails to pass through the level of 1.1807, the market will indicate a bearish opportunity below the level of 1.1807. So, the market will decline further to 1.1784 and 1.1762 to return to the daily support. Moreover, a breakout of that target will move the pair further downwards to 1.1688 in order to form the double bottom. Remark: The depicted resistance level of 1.1807 acted as an important key level offering a valid buy entry. So, buy above the 1.1807 level with the targets of 1.1881, 1.1925, and 1.1966 today. Conversely, stop loss should be placed below the high reached near the first support (1.1762). What would Biden's victory mean for gold? 2020-10-26 
The latest presidential debate has ended, and polls show that Democratic candidate Joe Biden has the upper hand. This means that traders who have invested in gold should understand the possible impact of Biden's victory on the price of gold. To analyze, it's easy to look at the history of how gold prices reacted in the past presidential elections. In November 2016, when Donald Trump won the election, most analysts thought that gold would rise sharply. However, it did not happen. This time, they believe that a contested election will lead to a fall in the US stock market, and accordingly, a fall in the price of gold. But since the Congress is still in the process of deciding on a new stimulus package, the yellow metal could rise in the market. To add to that, the Federal Reserve said that regardless of who wins the elections, more money will pour into the world economy, more than $ 7 trillion, which will also lead to an increase in the price of gold. In addition, deposits around the world are gradually depleting, and it is becoming more difficult not only to find profitable deposits, but also to extract. Meanwhile, contrary to that, the demand for gold continues to grow. And, if history can teach us anything, it is to anticipate the unexpected. Since forecasts on stock and commodity prices are not set in stone, it is highly likely that the election results will lead to unexpected movements in terms of gold prices. So, what would this mean for gold? Many analysts believe that Biden's victory will be extremely bullish for gold. 
Analysis of EUR/USD on October 26. Markets are still targeting the 20 figure. Aid package for the US economy was never accepted 2020-10-26 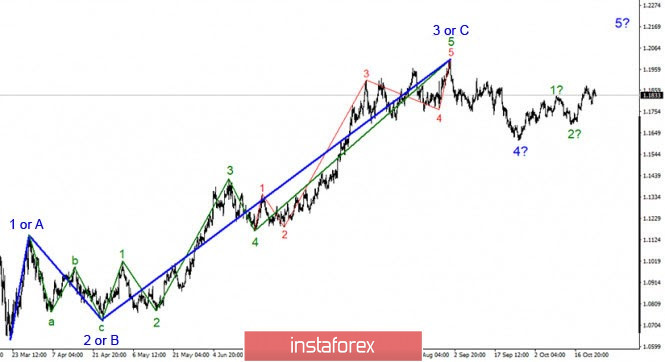 On the global scale, the wave marking of the EUR/USD instrument still looks quite convincing and has not changed recently. Thus, the formation of wave 5 of the upward trend section is still expected, which dates back to March. At the moment, waves 1 and 2 can be seen inside this wave. If the current wave markup is correct, then the price increase will continue from the current values with targets located near the peak of wave 3 or C. Three waves are also visible inside wave 4. There is at least one alternative variant of a wave marking. Let's look at it below: 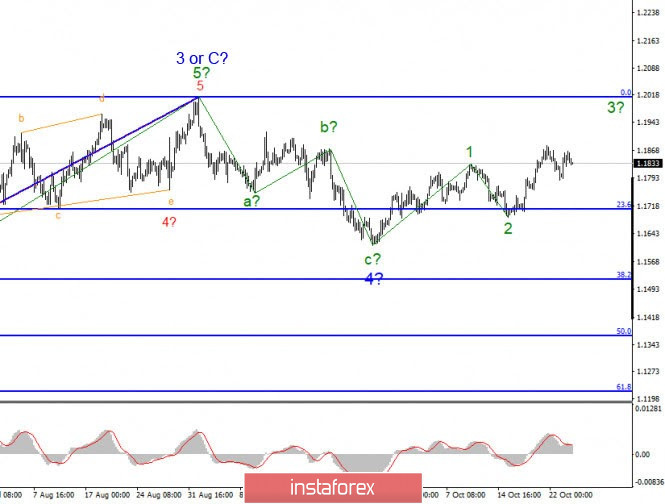 The wave counting on a smaller scale still shows that the intended wave 4 has assumed a three-wave form and is complete. If this is true, then the price increase will continue within the 3 to 5 wave. At the same time, a not-too-active increase in quotes suggests that the entire section of the trend that begins on September 25 may take a three-wave form, and the entire section of the trend that begins on September 1 will take a corrective form. In this case, after completing the top three, you can start building the bottom three. But for now, this is a fallback option. In recent weeks, the news background has had a very weak impact on the instrument. First, it should be recognized that the instrument has spent the last few months in a fairly narrow price range: only 200 or 250 basis points. Therefore, I would not talk about the influence of the news background on the wave picture and the movement of the instrument in general. It is unlikely that there have been no important news and economic statistics over the past two months. However, the markets are still avoiding to trade the instrument more actively. There is only one hope now — the US presidential election. It is possible that this event and its consequences will go unnoticed by the markets. After all, this is politics, not Economics. Nevertheless, the end of the election may give the markets a sense of confidence in the future and a sense of certainty. At least for now, there are no other catalysts that can take the instrument out of a very narrow price range. Another crucial matter is the aid package for the US economy, which is still not agreed and accepted. For now, it is unlikely to be passed by Congress before the election. But there are still no definite answers to these questions: what will happen after the election, how long will the vote count last, and who will become the next President of the United States. It is this uncertainty that can keep the markets from active trading. Nevertheless, the wave pattern continues to be quite convincing and suggests the construction of an upward wave. General conclusions and recommendations: Since the euro-dollar pair is presumably continuing to build a 3-in-5 wave, it is recommended to buy with targets located near the estimated 1.2012 mark, which corresponds to 0.0% Fibonacci, for each MACD signal up, in the expectation of building an upward wave. The option with a possible complication of the internal wave structure of wave 4 is not yet confirmed. However, a further decline in quotes may lead to a more complex wave pattern. Wave analysis of GBP/USD on October 26. Markets expect UK-EU negotiations results. Pound loses ground on lack of optimism 2020-10-26  + +
On the global scale, the formation of a new structure of the upward trend continues. Its internal wave pattern looks uncertain. However, the trend structure that started on October 23 is unlikely to be part of the downward wave structure that has been forming since September 1. Therefore, this is likely to be a new upward global wave that can consist of three or five sub-waves. This wave can become part of the upward trend as of March 20 or it can be an upward correction wave that is part of the downward structure of the trend that has been forming since September 1. 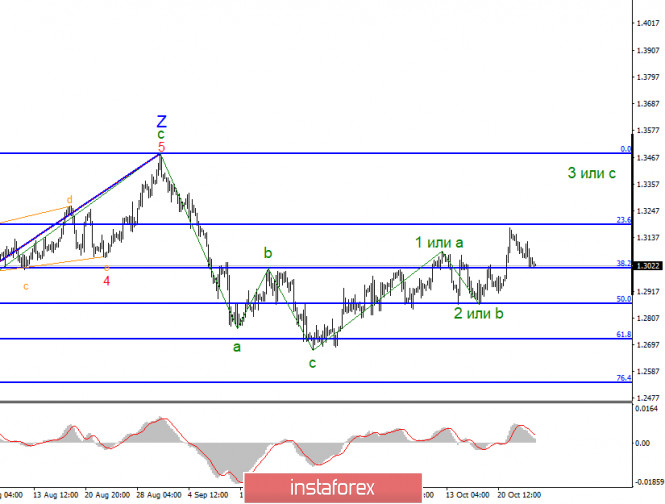
The wave pattern on the younger time frame looks uncertain and unclear. Given that the quotes have been rising for a short period of time after the completion of wave 2 or b, we can assume that the upward wave will either take a very extended form, or is already completed. Firstly, the pound will be able to rise only if there is a positive information background. Secondly, the current wave pattern is becoming even more complex. An unsuccessful attempt to break through the Fibonacci retracement level 38.2% will be able to preserve the upward market sentiment. There is still very little positive news for the pound. It became known during the weekend that Michel Barnier and David Frost agreed on another round of trade talks. Reportedly, the parties achieved certain progress. However, this information is not confirmed. At the start of Monday, the British pound was moving in the downward trend. In general, the start of the week was relatively calm for the pound. Thus, it is unclear how the news about the extended trade talks between London and Brussels affected the market. The wave pattern is likely to become more complex today if the Fibonacci retracement level of 38.2% is broken. Nevertheless, the information background for the pound is more negative than for the US dollar. Therefore, I believe that the price has all chances to fall. In such a case, the upward structure of the trend is likely to consist of three sub-waves. After that, the formation of three downward sub-waves will start and the wave structure will look the same as the structure that formed during October 1-23. On Monday, the macroeconomic calendar will be empty. No important information is set for release either in the United States or Europe. At the same time, several significant reports will come out during the week, including GDP and durable goods orders in the US. However, as for the given instruments, some news about US presidential elections and EU-UK trade talks will bear more meaning as they can drastically change market sentiment and the current wave pattern. General conclusions and recommendations: Most likely, the pound/dollar pair has finished the construction of the downward section of the trend. A successful breakout attempt at the Fibonacci retracement level of 38.2% will indicate the unwillingness of market players to buy the British pound. Apart from that, the whole wave pattern may become even more complex and the formation of a new downward wave may start. Thus, if there is a breakout at 1.3013, short positions will be preferable with the targets near 1.2867, that is the 50.0% Fibonacci retracement level, given a possible formation of a new downward wave. Technical analysis of GBP/USD for October 26, 2020 2020-10-26 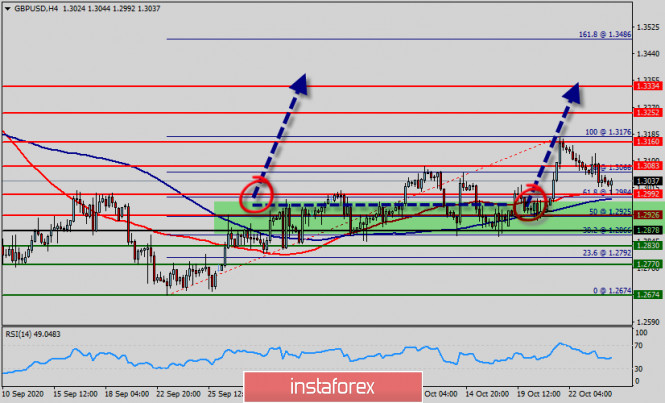 Trading recommendations : - According to the previous events the price is expected to remain between 1.2878 and 1.3334 levels. Buy-deals are recommended above 1.2878 with the first target seen at 1.2992. The movement is likely to resume to the point 1.3036 and further to the point 1.3160. Thereupon, it is possible that the pair will move upwards continuing the development of the bullish trend to the level 1.3334 in order to test the daily resistance 3. However, stop-loss is to be placed below the price of 1.2830.
Explanation : - The GBP/USD pair can still form an ascending impulse, it continues to rise upwards. The major support is seen at 1.2878 which coincides with the ratio of 50% Fibonacci. According to the main scenario, it may start forming correctional structures. Today, we foresee the price to move towards the level of 1.2992 and then reach a new maximum again around the price of 1.3082. Please, note that the strong resistance stands at the level of 1.3082. If the price breaks the level of 1.3082, we expect potential testing of 1.3160. The current ascending structure implies that the market may reach the level of 1.3160. In this area, the trend is challenging a major resistance level. RSI (14) is seeing major support above 30 where we expect further upside movement from ths area of 1.2878. The market is still indicating a strong bullish trend from the level of 1.2878. The ascending impulse is strong enough to buy above the support of 1.2878. Therefore, the price is expected to reach a high once again. It is rather gainful to buy at 1.2900 with the targets at 1.2992 and 1.3082. So, it is recommended to place take profit at the price of 1.3160 as the first target today. On the contrary, stop loss should be placed at the price of 1.2830 (below the daily support). The bullish outlook remains the same as long as the RSI indicator is pointing to the upside on the four-hour chart.
Trading idea for the GBP/USD pair 2020-10-26  After a strong rally last week, when the pound exited the triangle, the GBP / USD pair pulled back quite deep, which created a good opportunity to open long positions at a better price: 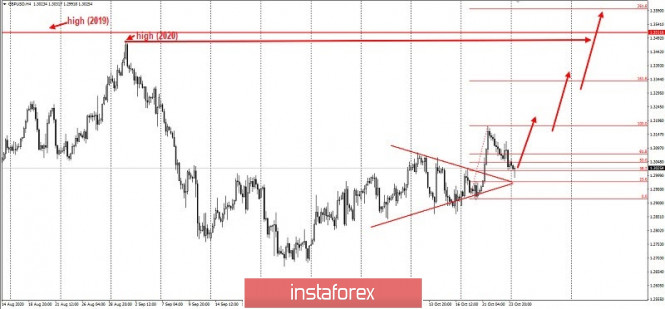 Despite that, the main target is still the level of 1.35 - a double top between 2019 and 2020:  Given the fact that the dollar is currently weakening ahead of the US presidential elections, as well as on the possible signing of a trade agreement between the UK and the EU, the pound has a high chance of increasing sharply in the market. Thus, the best bet is to open long positions, expecting for a price increase towards the goal presented above. Of course, the risk is still needed to be controlled to avoid losing profit. Trading in the market is very precarious and uncertain, but also very profitable as long as you use the right approach. The strategy used here is in accordance to Price Action and Stop Hunting techniques. Good luck! Technical analysis of AUD/USD for October 26, 2020 2020-10-26 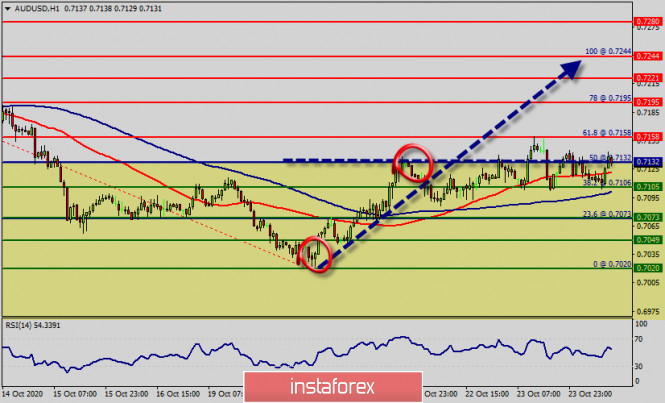 Overview : Pivot point : 0.7132. The AUD/USD pair broke resistance, which turned into strong support at 0.7073. Right now, the pair is trading above this level (0.7073). It is likely to trade in a higher range as long as it remains above the support (0.7073), which is expected to act as a major support today. Therefore, there is a possibility that the AUD/USD pair will move upwards and the structure does not look corrective. The trend is still below the 100 EMA for that the bullish outlook remains the same as long as the 100 EMA is headed to the upside. We expect to see a strong reaction off this level to push price up towards 0.7132 before 0.7073 support (Fibonacci retracement, horizontal swing high support). RSI (14) sees major ascending resistance line acting as support to push price up from the zone of 0.7073. From this point of view, the first resistance level is seen at 0.7132 followed by 0.7195, while daily support 1 is seen at 0.7073 (23.6% Fibonacci retracement). According to the previous events, the AUD/USD pair is still moving between the levels of 0.7100 and 0.7195; so we expect a range of 95 pips at least in coming hours. Consequently, buy above the level of 0.7100 with the first target at 0.7158 so as to test the daily resistance 1 and further to 0.7195. Besides, the level of 0.7195 is a good place to take profit because it will form a double top. On the contrary, in case a reversal takes place and the AUD/USD pair breaks through the support level of 0.7023, a further decline to 0.7020 can occur, which would indicate a bearish market. Overall, we still prefer the bullish scenario, which suggests that the pair will stay below the zone of 0.7023 today. EUR/USD: plan for the American session on October 26 (analysis of morning deals) 2020-10-26 To open long positions on EURUSD, you need: In my morning forecast, I drew attention to the report on the economic expectations indicator from the IFO, which turned out to be worse than economists' forecasts, which returned pressure on the euro. Let's look at the 5-minute chart and talk about where you could enter the market. The formation of a false breakout in the first half of the day at the level of 1.1826 formed a good signal to buy the euro, however, the reports were worse than economists' forecasts, and the euro did not move up. Even after the bears took the level of 1.1826, a convenient entry point was not immediately formed. However, the pair have already returned to this range and tested it, which keeps the market on the side of euro sellers. 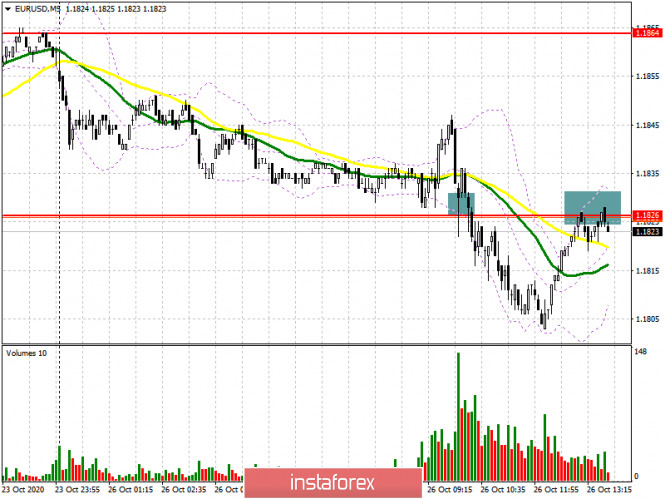
The primary task of buyers for the second half of the day is to regain control over the resistance of 1.1826. Fixing at this level and testing it from top to bottom forms a good signal to open long positions in the expectation of continuing the upward trend observed over the past week. The goal of the bulls in this scenario will be to return to the maximum of 1.1864, where I recommend fixing the profit. But even if the euro's decline continues, it is too early to panic, as the pair may remain in the side channel with the lower limit of 1.1792. However, I recommend opening long positions from this area only if a false breakout is formed. You can buy EUR/USD immediately for a rebound only from the minimum of 1.1762, based on a correction of 15-20 points within the day. To open short positions on EURUSD, you need to: Sellers coped with the morning task and regained control over the support of 1.1826, which now acts as a resistance. The bottom-up test of this level has already formed a good entry point for short positions. I marked it on the 5-minute chart. As long as trading is conducted below this range, you can expect a further decline in the euro, as the bullish momentum continues its gradual completion. The immediate goal is to return EUR/USD to the support of 1.1792, where I recommend fixing the profits. The longer-term target will be at least 1.1762. In the scenario of EUR/USD growth above 1.1826 and lack of activity among sellers at this level, it is best not to rush to open short positions, but to wait for the update of the maximum of 1.1864 and sell the euro for a rebound for a correction of 15-20 points. 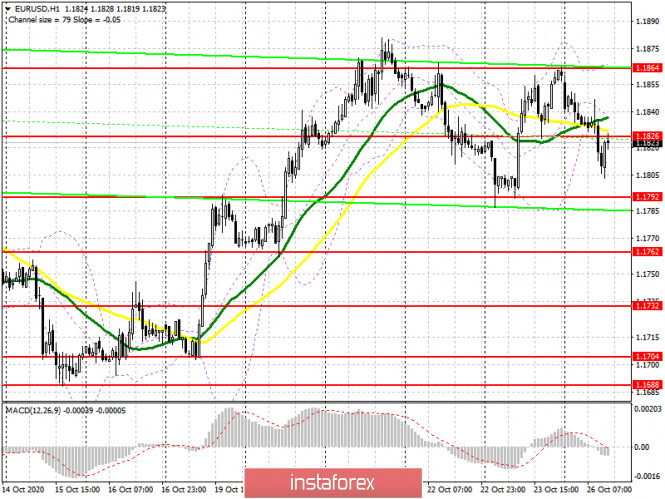
Let me remind you that the COT report (Commitment of Traders) for October 20 recorded both the growth of long positions and the growth of short ones. However, the latter turned out to be more, which led to an even greater decrease in the positive delta. But despite this, buyers of risky assets believe in the continuation of the bull market, but prefer to proceed cautiously, as there is no good news on the Eurozone yet. Thus, long non-profit positions rose from the level of 228,295 to the level of 229,878, while short non-profit positions rose from the level of 59,658 to the level of 63,935. The total non-commercial net position fell to 165,943, down from 168,637 a week earlier. However, bullish sentiment on the euro remains quite high in the medium term. The stronger the euro declines against the US dollar at the end of this year, the more attractive it will be for new investors. Signals of indicators: Moving averages Trading is conducted below 30 and 50 daily moving averages, which indicates the formation of a downward correction in the market. Note: The period and prices of moving averages are considered by the author on the hourly chart H1 and differ from the general definition of the classic daily moving averages on the daily chart D1. Bollinger Bands If the pair grows, the average border of the indicator around 1.1840 will act as a resistance, and you can sell the euro immediately on a rebound from the upper border of the indicator in the area of 1.1870. Description of indicators - Moving average (moving average determines the current trend by smoothing out volatility and noise). Period 50. The graph is marked in yellow.
- Moving average (moving average determines the current trend by smoothing out volatility and noise). Period 30. The graph is marked in green.
- MACD indicator (Moving Average Convergence / Divergence - moving average convergence / divergence) Fast EMA period 12. Slow EMA period 26. SMA period 9
- Bollinger Bands (Bollinger Bands). Period 20
- Non-profit speculative traders, such as individual traders, hedge funds, and large institutions that use the futures market for speculative purposes and meet certain requirements.
- Long non-commercial positions represent the total long open position of non-commercial traders.
- Short non-commercial positions represent the total short open position of non-commercial traders.
- Total non-commercial net position is the difference between the short and long positions of non-commercial traders.
October 26, 2020 : EUR/USD daily technical review and trade recommendations. 2020-10-26 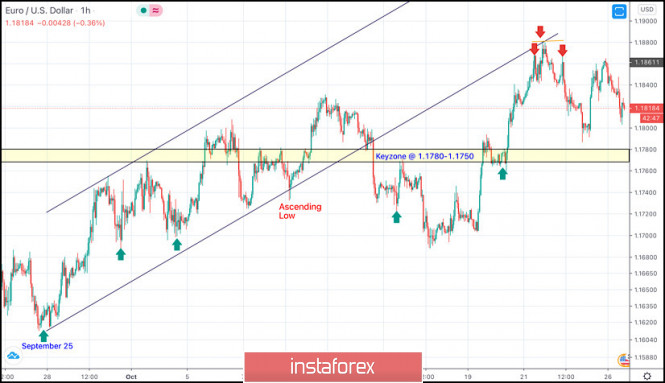
On September 25, The EURUSD pair has failed to maintain enough bearish momentum to enhance further bearish decline. Instead, recent ascending movement has been demonstrates within the depicted movement channel leading to bullish advancement towards 1.1750-1.1780 which failed to offer sufficient bearish pressure in the first attempt. Two weeks ago, temporary breakout above 1.1750 was demonstrated as an indicator for a possible bullish continuation towards 1.1880. However, temporary downside pressure pushed the EUR/USD pair towards 1.1700. This is where the previous bullish spike was initiated. Currently, the price zone around 1.1880-1.1900 constitutes a KEY Price-Zone as it corresponds to the backside of the depicted broken ascending channel. Recent Upside breakout above 1.1780 enabled further advancement towards the price levels around 1.1880-1.1900 where significant bearish pressure and a reversal Head & Shoulders pattern were demonstrated. Trade Recommendations :- Recently, Two opportunities for valid SELL Entries were offered upon the recent upside movement towards 1.1880-1.1900. Initial Bearish target remains projected towards 1.1780 while Exit level should be placed around 1.1870 to offset the associated risk EUR/USD analysis for October 26 2020 - Watch for the breakout of the balance and potential upside continuation 2020-10-26 Germany October Ifo business climate index 92.7 vs 93.0 expected 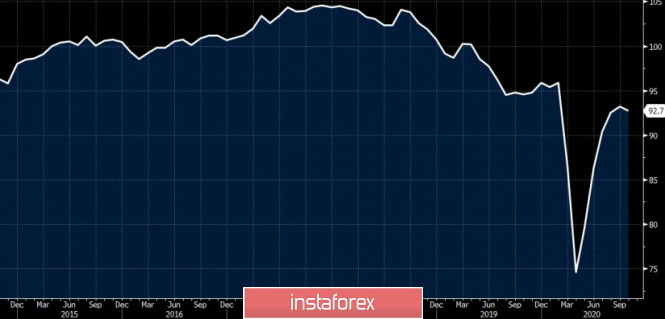 Prior 93.4; revised to 93.2 - Expectations 95.0 vs 96.5 expected
- Prior 97.7
- Current assessment 90.3 vs 89.8 expected
- Prior 89.2
Slight delay in the release by the source. The headline marks the first drop in German business morale in six months, with the expectations component also falling amid the resurgence in virus cases dampening economic prospects in the region. Further Development 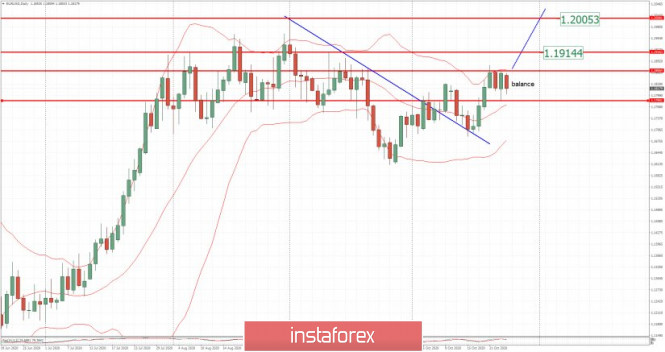
Analyzing the current trading chart of EUR/USD, I found that tthere is consolidation and the balance regime, which is sign of netural market. 1-Day relative strength performance Finviz 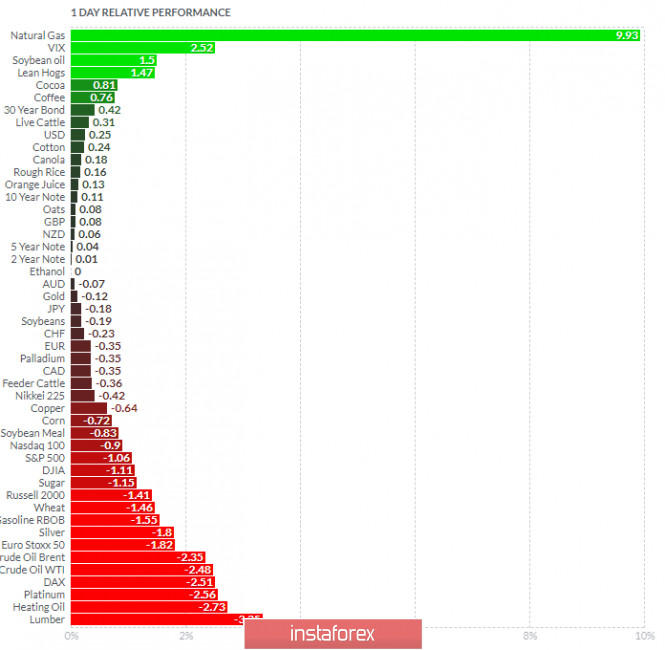
Based on the graph above I found that on the top of the list we got Natural Gas and VIX today and on the bottom Heating Oil and Lumber. EUR slightly negative on the relative performance list but with the decrease on the momentum. Key Lvels: Resistance: 1,1865, 1,1915 and 1,2000 Support level: 1,1785 Analysis of Gold for October 26,.2020 - Rejection of the support trendline and potential for the rally towards $1.913/31 2020-10-26 Japan's largest private insurer says to reduce investment into foreign bonds without currency hedge Nippon Life announces to cut FX exposure and shift back to domestic debt The insurer just announced plans to increase its holding of yen fixed income products - JGBs and corporate bonds - while reducing investments into foreign bonds without currency hedge in the six months from October to March next year. Adding that they already sold some of such bonds in the past six months, mainly in the euro after the currency rose following the announcement of the EU recovery fund. But the firm says it plans to keep its currency-hedged foreign bond holdings more steady. Elsewhere, the firm says it plans to increase foreign stock holdings - for diversification - and will likely trim its domestic stock holdings as such. 
Further Development 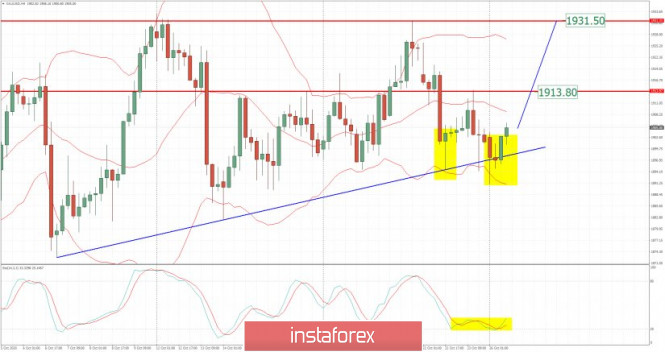
Analyzing the current trading chart of Gold, I found that there is another rejection of the main support rising trendline, which is indication that buyers are in control and that trend is bullish. 1-Day relative strength performance Finviz 
Based on the graph above I found that on the top of the list we got Natural Gas and VIX today and on the bottom Heating Oil and Lumber. Gold slightly positive today on the relative strength list... Key Levels: Resistances: $1,913 and $1,931 Support level: $1,894 GBP/USD: plan for the American session on October 26 (analysis of morning deals) 2020-10-26 To open long positions on GBPUSD, you need: In the first half of the day, it was possible to observe the bulls' attempt to return to the resistance area of 1.3053, however, it was not possible to wait for the formation of a signal to enter long positions there. Let's figure out why. We can see that on the 5-minute chart, immediately after the price fell to the level of 1.3053 to test its strength, the bulls failed to keep the pair above this range. All that remains now is a price return and a trade above 1.3053. Only in this case, you can count on the continuation of the upward trend of the pair to the area of a new local maximum of 1.3120, where I recommend fixing the profits. A longer-term target will be the area of 1.3174, however, it will only be available if there is good news on Brexit. If the bears are stronger in the second half of the day and return the pressure on the pound, then I recommend opening new long positions only for a rebound from the new local minimum of 1.2977, based on a correction of 20-30 points within the day. 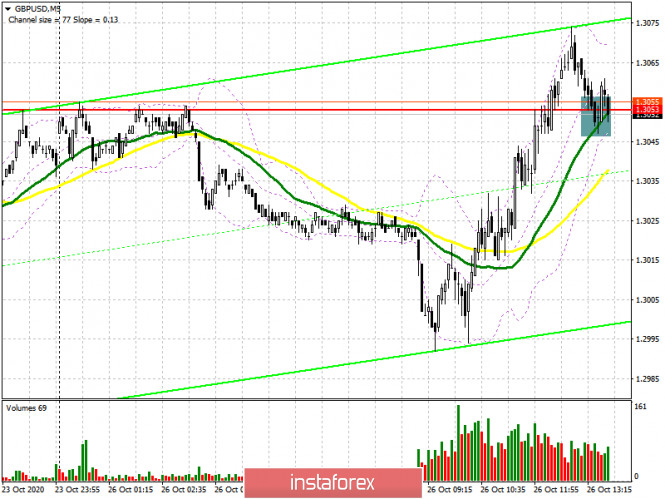
To open short positions on GBPUSD, you need: The bears are still defending the resistance of 1.3053. All they need to do in the second half of the day is to form a false breakout and return the pair to the level of 1.3053, which will be a signal to open short positions. In the meantime, on the 5-minute chart, we can see an active struggle for this range. If a sell signal is formed for the pound, we can expect the pair to return to the support area of 1.2977, where I recommend fixing the profits. The area of 1.2919 will be a more distant target. If the bulls turn out to be stronger and the growth of GBP/USD continues in the second half of the day, then you can open short positions for a rebound from the new local maximum in the area of 1.3120 in the expectation of a downward correction of 20-30 points within the day. 
Let me remind you that in the COT reports (Commitment of Traders) for October 20, there was a reduction in short and a sharp increase in long positions. Long non-commercial positions increased from the level of 36,195 up to level 39 836. At the same time, short non-commercial positions fell from the level of 45,997 to the level of 41,836. As a result, the negative value of the non-commercial net position increased slightly to -2,000, against -9,802 a week earlier, which indicates that sellers of the British pound remain in control and have a minimal advantage in the current situation. Signals of indicators: Moving averages Trading is conducted around 30 and 50 daily averages, which limit the upward correction of the pound. Note: The period and prices of moving averages are considered by the author on the hourly chart H1 and differ from the general definition of the classic daily moving averages on the daily chart D1. Only a breakdown of the lower border of the indicator around 1.3005 will increase the pressure on the pound. Description of indicators - Moving average (moving average determines the current trend by smoothing out volatility and noise). Period 50. The graph is marked in yellow.
- Moving average (moving average determines the current trend by smoothing out volatility and noise). Period 30. The graph is marked in green.
- MACD indicator (Moving Average Convergence / Divergence - moving average convergence / divergence) Fast EMA period 12. Slow EMA period 26. SMA period 9
- Bollinger Bands (Bollinger Bands). Period 20
- Non-profit speculative traders, such as individual traders, hedge funds, and large institutions that use the futures market for speculative purposes and meet certain requirements.
- Long non-commercial positions represent the total long open position of non-commercial traders.
- Short non-commercial positions represent the total short open position of non-commercial traders.
- Total non-commercial net position is the difference between the short and long positions of non-commercial traders.
October 26, 2020 : EUR/USD Intraday technical analysis and trade recommendations. 2020-10-26 
In July, the EURUSD pair has failed to maintain bearish momentum strong enough to move below 1.1150 (consolidation range lower zone). Instead, bullish breakout above 1.1380-1.1400 has lead to a quick bullish spike directly towards 1.1750 which failed to offer sufficient bearish pressure as well. Bullish persistence above 1.1700 - 1.1760 favored further bullish advancement towards 1.1975 - 1.2000 ( the upper limit of the technical channel ) which constituted a Solid SUPPLY-Zone offering bearish pressure. Moreover, Intraday traders should have noticed the recent bearish closure below 1.1700. This indicates bearish domination on the short-term. On the other hand, the EURUSD pair has failed to maintain sufficient bearish momentum below 1.1750. Instead, another bullish breakout was being demonstrated towards 1.1870 which corresponds to 76% Fibonacci Level. As mentioned in previous articles, the price zone of 1.1870-1.1900 stands as a solid SUPPLY Zone corresponding to the backside of the broken channel if bullish pullback occurs again soon. Intraday Trend-Traders can wait for a bearish H4 candlestick closure below 1.1770 as a valid short-term SELL Signal with a potential bearish target located around 1.1700 and 1.1630 if sufficient bearish momentum is maintained
Author's today's articles: Mourad El Keddani  Was born in Oujda, Morocco. Currently lives in Belgium. In 2003 obtained B.S. in Experimental Sciences. In 2007 obtained a graduate diploma at Institut Marocain Specialise en Informatique Applique (IMSIA), specialty – Software Engineering Analyst. In 2007–2009 worked as teacher of computer services and trainer in a professional school specializing in computer technologies and accounting. In 2005 started Forex trading. Authored articles and analytical reviews on Forex market on Forex websites and forums. Since 2008 performs Forex market research, and develops and implements his own trading strategies of Forex analysis (especially in Forex Research & Analysis, Currency Forecast, and Recommendations and Analysis) that lies in: Numerical analysis: Probabilities, equations and techniques of applying Fibonacci levels. Classical analysis: Breakout strategy and trend indicators. Uses obtained skills to manage traders' accounts since 2009. In April 2009 was certified Financial Technician by the International Federation of Technical Analysts. Winner of several social work awards: Education Literacy and Non-Formal Education (in Literacy and Adult Education in The National Initiative for Human Development). Was born in Oujda, Morocco. Currently lives in Belgium. In 2003 obtained B.S. in Experimental Sciences. In 2007 obtained a graduate diploma at Institut Marocain Specialise en Informatique Applique (IMSIA), specialty – Software Engineering Analyst. In 2007–2009 worked as teacher of computer services and trainer in a professional school specializing in computer technologies and accounting. In 2005 started Forex trading. Authored articles and analytical reviews on Forex market on Forex websites and forums. Since 2008 performs Forex market research, and develops and implements his own trading strategies of Forex analysis (especially in Forex Research & Analysis, Currency Forecast, and Recommendations and Analysis) that lies in: Numerical analysis: Probabilities, equations and techniques of applying Fibonacci levels. Classical analysis: Breakout strategy and trend indicators. Uses obtained skills to manage traders' accounts since 2009. In April 2009 was certified Financial Technician by the International Federation of Technical Analysts. Winner of several social work awards: Education Literacy and Non-Formal Education (in Literacy and Adult Education in The National Initiative for Human Development).
Languages: Arabic, English, French and Dutch.
Interests: Algorithm, Graphics, Social work, Psychology and Philosophy. Andrey Shevchenko  Andrey Shevchenko Andrey Shevchenko Alexander Dneprovskiy  Graduated from Kiev State University of Economics. On Forex market since 2007. Started his work at Forex as a trader. Since 2008 is working as a currency analyst. Graduated from Kiev State University of Economics. On Forex market since 2007. Started his work at Forex as a trader. Since 2008 is working as a currency analyst. Maxim Magdalinin  In 2005 graduated from the Academy of the Ministry of Internal Affairs of the Republic of Belarus, law faculty. Worked as a lawyer for three years in one of the biggest country's company. Besides the trading, he develops trading systems, writes articles and analytical reviews. Works at stock and commodity markets explorations. On Forex since 2006. In 2005 graduated from the Academy of the Ministry of Internal Affairs of the Republic of Belarus, law faculty. Worked as a lawyer for three years in one of the biggest country's company. Besides the trading, he develops trading systems, writes articles and analytical reviews. Works at stock and commodity markets explorations. On Forex since 2006. Mohamed Samy  Born November 18, 1966, in Egypt. In 1990 graduated from the Faculty Of Engineering, Alexandria University. In 2000 started to follow financial markets. Took a higher diploma in investing and finance in 2008 and also CMT in 2009. Started at the Financial World as an analyst, then worked as a technical analysis consultant at Misr Financial Investments Co. Since 2005 has been working on the Stock Exchange. Has been familiar with Forex since December 2005. Being a member of the Egyptian Society of Technical Analysis, attends seminars and conferences dedicated to financial markets. Is a member of the American Market Technicians Association. Interests: football, reading, volleyball, swimming, movies Born November 18, 1966, in Egypt. In 1990 graduated from the Faculty Of Engineering, Alexandria University. In 2000 started to follow financial markets. Took a higher diploma in investing and finance in 2008 and also CMT in 2009. Started at the Financial World as an analyst, then worked as a technical analysis consultant at Misr Financial Investments Co. Since 2005 has been working on the Stock Exchange. Has been familiar with Forex since December 2005. Being a member of the Egyptian Society of Technical Analysis, attends seminars and conferences dedicated to financial markets. Is a member of the American Market Technicians Association. Interests: football, reading, volleyball, swimming, movies Petar Jacimovic  Petar was born on July 08, 1989 in Serbia. Graduated from Economy University and after has worked as a currency analyst for large private investors. Petar has been involved in the world of finance since 2007. In this trading he specializes in Volume Price Action (volume background, multi Fibonacci zones, trend channels, supply and demand). He also writes the market analytical reviews for Forex forums and websites. Moreover Petar is forex teacher and has wide experience in tutoring and conducting webinars. Interests : finance, travelling, sports, music "The key to success is hard work" Petar was born on July 08, 1989 in Serbia. Graduated from Economy University and after has worked as a currency analyst for large private investors. Petar has been involved in the world of finance since 2007. In this trading he specializes in Volume Price Action (volume background, multi Fibonacci zones, trend channels, supply and demand). He also writes the market analytical reviews for Forex forums and websites. Moreover Petar is forex teacher and has wide experience in tutoring and conducting webinars. Interests : finance, travelling, sports, music "The key to success is hard work"
Subscription's options management Theme's:
Fundamental analysis, Fractal analysis, Wave analysis, Technical analysis, Stock Markets
Author's :
A Zotova, Aleksey Almazov, Alexander Dneprovskiy, Alexandr Davidov, Alexandros Yfantis, Andrey Shevchenko, Arief Makmur, Dean Leo, Evgeny Klimov, Fedor Pavlov, Grigory Sokolov, I Belozerov, Igor Kovalyov, Irina Manzenko, Ivan Aleksandrov, l Kolesnikova, Maxim Magdalinin, Mihail Makarov, Mohamed Samy, Mourad El Keddani, Oleg Khmelevskiy, Oscar Ton, Pavel Vlasov, Petar Jacimovic, R Agafonov, S Doronina, Sebastian Seliga, Sergey Belyaev, Sergey Mityukov, Stanislav Polyanskiy, T Strelkova, Torben Melsted, V Isakov, Viktor Vasilevsky, Vladislav Tukhmenev, Vyacheslav Ognev, Yuriy Zaycev, Zhizhko Nadezhda
Edit data of subscription settings
Unsubscribe from the mailing list Sincerely,
Analysts Service | If you have any questions, you can make a phone call using one of the
InstaForex Toll free numbers right now:
|  | InstaForex Group is an international brand providing online trading services to the clients all over the world. InstaForex Group members include regulated companies in Europe, Russia and British Virgin Islands. This letter may contain personal information for access to your InstaForex trading account, so for the purpose of safety it is recommended to delete this data from the history. If you have received this letter by mistake, please contact InstaForex Customer Relations Department. |


No comments:
Post a Comment