Friday, August 2, 2024

Can Samsara Inc. (IOT) Buck the Trend and Present a New Trade Opportunity?

Trade of the Day Wake-Up Watchlist

"Samsara's TPS Setup Could Offer a Unique Trading Opportunity Despite Market Turbulence."

Nate Bear, Lead Technical Tactician, Monument Traders Alliance

Nate Bear

Stock futures are under heavy selling pressure this morning leading up to the jobs report.

And, with so much volatility and uncertainty in the market currently, it's better to play it small or stay on the sidelines.

More importantly, you have to not let your emotions interfere with your decision making.

Of course, that's easier said than done.

But not really, if you follow your system.

So instead of telling you what I think is a solid play today, I'm going to share with you a watchlist pick that my system really likes.

The stock I want to bring to your attention is Samsara Inc. (IOT).

Now, prior to yesterday, I'd be lying to you if I told you what they did.

In fact, I've never traded the stock before.

However, I sure do love the chart, and setup.


So what does Samsara Inc do?

JOLTS OVERNIGHT TRADE DEMONSTRATION

115% Average Gain
 

Every Time the Government Releases Jobs Data... Make This Trade the Night Before!

(Target up to 253%... 327%... Even 383% gains... OVERNIGHT!)

Next JOLTS Trade Tuesday, August 6 at 2 pm!

Samsara Inc. is a technology company that specializes in providing Internet of Things (IoT) solutions for businesses, particularly in the areas of fleet management, industrial operations, and safety.

What I do like about them from a trading perspective is that it trades decent volume and has weekly options.

But more importantly, the setup looks great, even after yesterday's bloodbath in the market.

It's the perfect definition of a TPS Setup.

The Trend Pattern Squeeze is more than just a trading setup, it's an entire system. It is designed to be simple yet effective, focusing on three key components: Trend, Pattern, Squeeze.

How to Identify the TPS:

  1. Trend: The stock should be clearly trending either up or down. It should be evident within 3 seconds of looking at the chart.

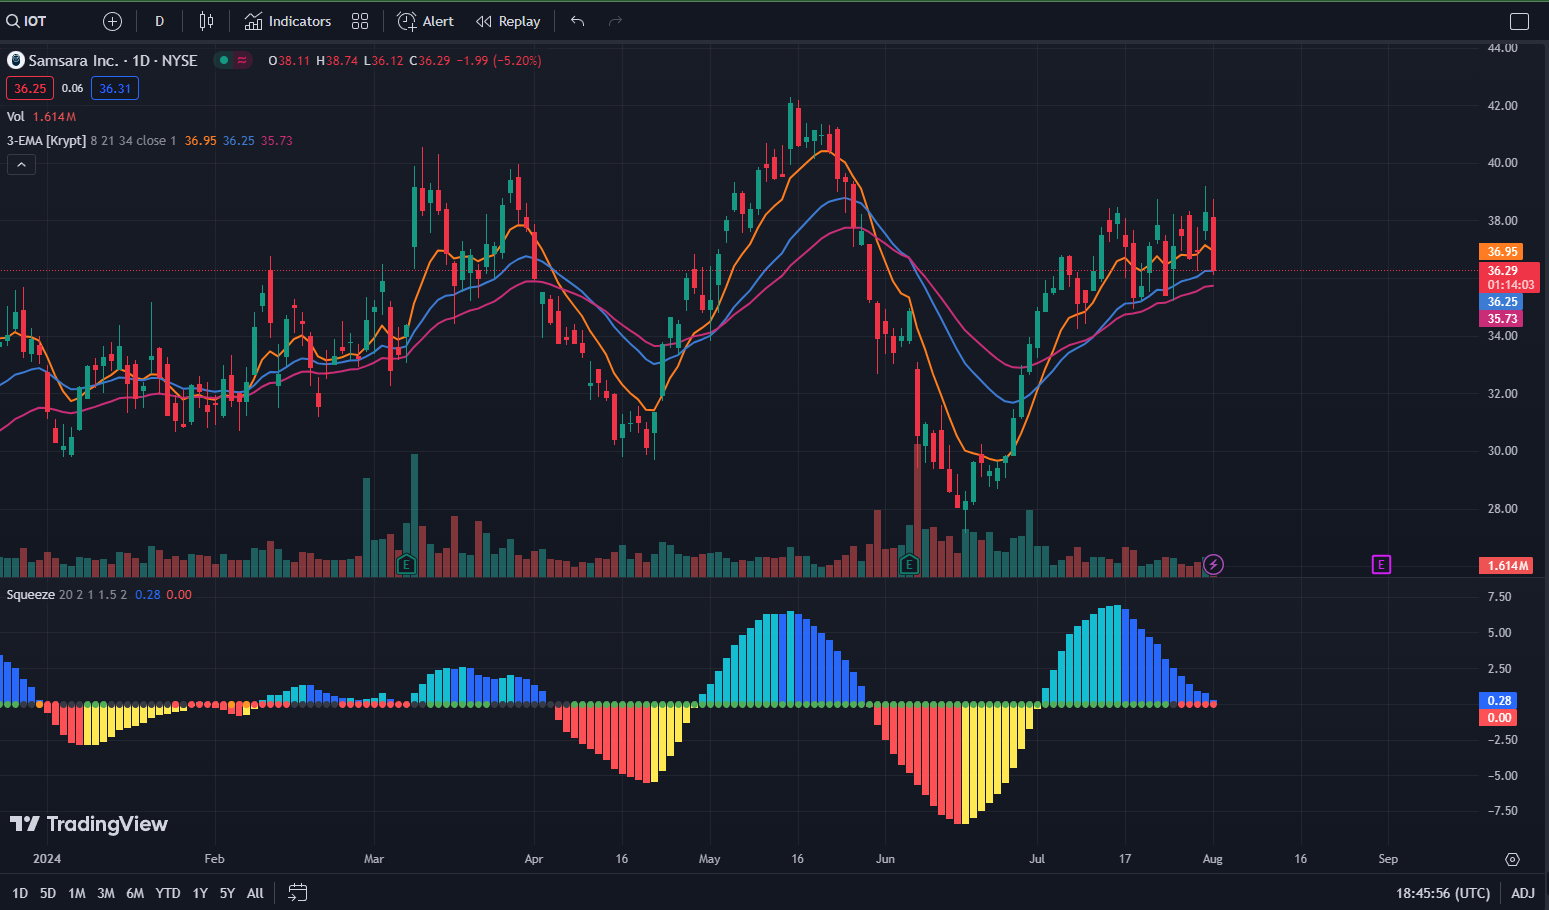
In the case of IOT, it's trading above its 21,34, and 50-day exponential moving averages. Clearly the trend is up.

  1. Pattern: Look for a period of consolidation near highs or lows.

Prior to yesterday's trading action, IOT was within 10% of its 52-week highs. But like most stocks, it fell hard yesterday.

  1. Squeeze: I Use the Squeeze indicator. When the dots turn red, it indicates a period of consolidation and potential for the next move.

The squeeze indicator is showing a red dot, which indicates IOT could run higher.

However, with the market this volatile lately, it's likely it will move with everything else.

And why I haven't taken a position in it yet.

But if we can see a bounce in the overall market, I think this one has a strong chance of making a move back to its highs of $42.

Action Plan: I'll be watching IOT for a potential move higher. But it seems like all stocks are correlated at the moment. If things change I will look to enter a long call option position in my Daily Profits Live Portfolio.

If you'd like to learn more about what and how I trade in Daily Profits Live, check this out.

NEW RESEARCH: AI Trading Tool "S.A.M."
Could Have Found Profitable Trades
With as Much as an 82% Win Rate (Over 5 Years)!

Nate with dog at Computer
 

5-year backtest shows that a revolutionary new AI-powered scanner developed by legendary trader Nate Bear could have found as many as 7,286 profitable plays (an average of 5 per day).

See why traders who have early access can't stop raving about how powerful this new tool is.

See the LIVE demo here...

>> Click to See the Demo <<

No comments:

Post a Comment

⏰[Trading Live NOW] Unlock Top Spread Strategies: FDX Earnings & FOMC Insights - Join Our Webinar!

Trader we are trading, join us! You receive this email, because you signed up to get email from YellowTunnel newsletter on 12/11/20.  ...