| GBP/USD and USD/JPY: UK and EU resumes Brexit negotiations. The Japanese yen hit new highs amid increasing demand for safe haven assets due to COVID-19. 2020-11-18 The UK and the EU resumed Brexit negotiations yesterday. However, even if both parties want to reach an agreement, no one wants to compromise on one key issue related to fisheries.  To date, the stance of UK Prime Minister, Boris Johnson, is the same, that is, the UK is set on preserving its sovereignty over a number of fishing zones, while the EU is trying to obtain permission to conduct industrial fishing in these areas ... If both parties still fail to compromise, GDP growth in the UK could be cut in half. A report from some economic agencies point to problems in labor productivity, which is already at a very low level due to the coronavirus pandemic. To add to that, about 80% of all labor force growth is provided by migrants from the EU, thus, the closure of this channel can seriously affect the pace of economic recovery. There is also a risk that the UK will lose political sovereignty if Brexit happens without a trade deal. Larger trading partners could impose their own rules, which is bad news for the UK economy. In that regard, the GBP / USD pair will move depending on the progress of the negotiations, in which any good news will spur demand for the pound. A breakout from 1.3310 will lead to an upward move towards 1.3380 and 1.3470, but if the quote drops below 1.3235, the GBP / USD pair may move to 1.3165, or to the base of the 31st figure.  In the short term, the pound's volatility may be affected by the data on UK inflation (for October), which is expected to come out today. In the event of serious discrepancy from the forecasts, the pressure on the pound will quickly return. USD / JPY The Japanese yen rose to new highs yesterday amid increasing demand for safe haven assets caused by the COVID-19. To add to that, weak data on US retail sales pulled the dollar down. Thus, the Japanese yen grew actively in the market yesterday. According to a report published yesterday, US retail sales increased by 0.3% in October, but this figure was lower than the forecast of economists, which was 0.5%. The sharp jump was again recorded in Internet sales, which grew by 3.1% compared to the previous month. Exports from Japan also returned to the level it had before the pandemic, thus, the position of the yen strengthened further in the market. However, given the risk of rising coronavirus infections in other countries, it is now unclear if the recovery will continue in November this year.  The balance of foreign trade in October amounted to £ 314.4 billion. In another note, the Bank of Japan said its main target is to achieve an inflation rate of 2%. The Central Bank will continue to buy bonds, however, it may refrain from buying more if the risk premiums stop growing. The purchase is aimed at maintaining stability in the markets during the pandemic. Back to the USD/JPY pair, there are no barriers for a further decline, and the nearest major support is seen around the level of 103.20. A breakout of which will quickly send the pair to lows 102.00 and 101.20. In the event of an upward correction, which is unlikely to be serious, especially considering how quickly the second wave of the coronavirus pandemic covers the United States, the nearest resistance will be the level of 104.60, slightly above which is the level of 105.15. Trading recommendations of EUR/USD and GBP/USD pair on 11/18/20 2020-11-18 
The euro successfully held its previously set upward rate yesterday. As a result, the quote managed to rise above the level of 1.1875. However, there has been low activity in the market in recent days and even the statistics published during the US session failed to help the market situation with volatility. What was published on the economic calendar? There were no statistics on the European side, but for the United States, volume of retail sales were published, where the last value was revised in favor of growth – from 5.4% to 5.9%. And although the current data was confirmed at 5.7%, this is not bad in the current situation. This is followed by the US data on volume of industrial production, where the previous figure was revised for the better – from -7.3% to -6.7%, and the current volume of industrial production reflected an even more significant slowdown with a decline to -5.3%. As a result of positive statistical data, the US dollar managed to recover its positions against the euro, returning the quote below the level of 1.1875. What happened on the trading chart? The quote initially showed an active growth, just in the period of the first half of the European session, which led to a price consolidation above the level of 1.1875. The maximum deviation was 1.1893, where we could have a profit of 18 points, if we enter from the level of 1.1875. During the time of publication of US statistics, the price of the dollar began to strengthen, which led to a reversal with a maximum deviation of 1.1857. During the next day, the quote returned to the level of 1.1875. 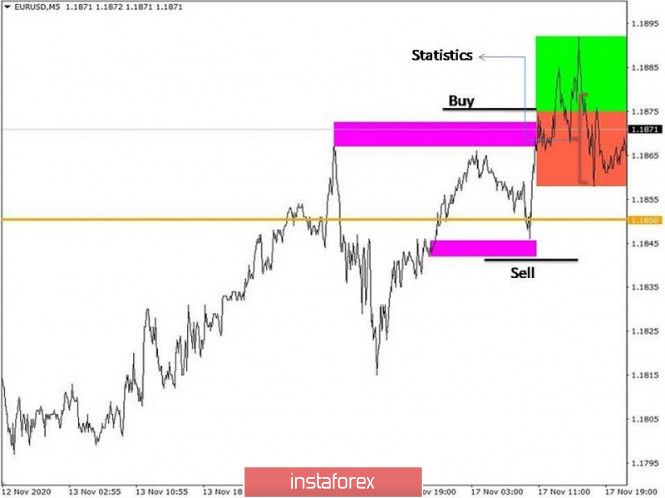
Just like its European counterpart, the pound was also inclined to rise yesterday, which resulted in a breakdown of the resistance area 1.3225/1.3235. There has been a low activity for the GBP/USD pair for three consecutive trading days (daily volatility is below 100 points). In terms of the economic calendar, the UK did not publish statistics. Thus, we should only pay attention to the published statistics from the United States. - Volume of retail sale
- Volume of industrial production
It was mentioned above that the US data came out quite good, so the dollar managed to slightly strengthen against the pound. 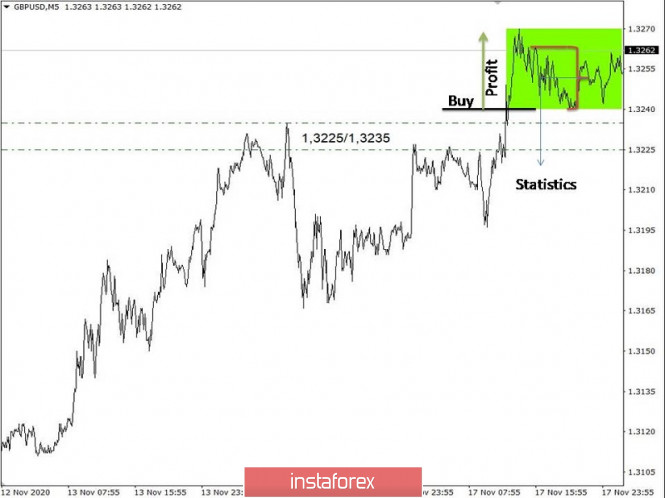
Considering the economic calendar, the final data on Europe's inflation will be published today, which should confirm the fact that the decline rate remains at the level of -0.3%. Moreover, it should be noted that the preliminary estimate has already reflected the inflation decline and this factor can be taken into account in the quotes. There will be no statistics expected for the United States. EU 10:00 Universal time - Inflation data In terms of technical analysis, you can see that the quote is still on an upward wave of buyers, where yesterday's high will likely be updated at 1.1893, if the price is kept above the level of 1.1875. This will be followed by a movement towards the level of 1.1920. An alternative scenario of the market development will be considered if the price consolidates below the level of 1.1850, which may lead to a decline towards the range of 1.1810-1.1800. 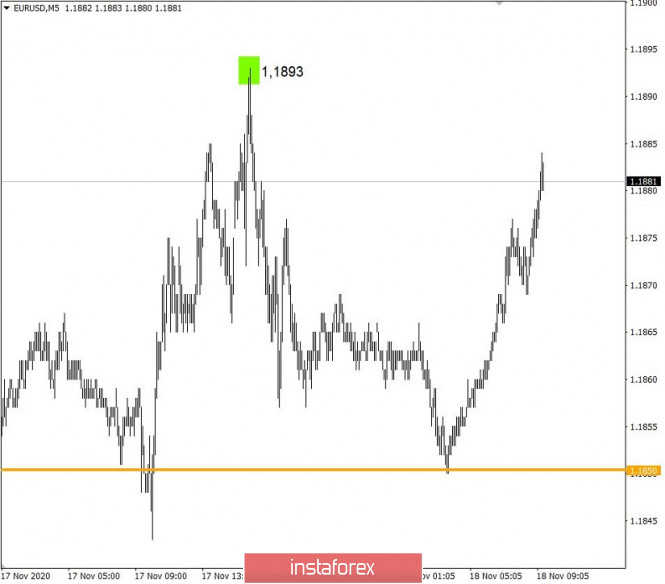
In addition to the news background, inflation data in Britain have already been published, where it increased from 0.5% to 0.7%, with a forecasted growth of 0.6%. The divergence in expectations favored the pound in terms of local strengthening. From the point of view of technical analysis, it is noteworthy that the quote is still above the resistance area of 1.3225/1.3235, which means that buyers still have a chance to further rise towards the level of 1.3300. An alternative scenario of the market development will be considered if the price returns below the level of 1.3225. 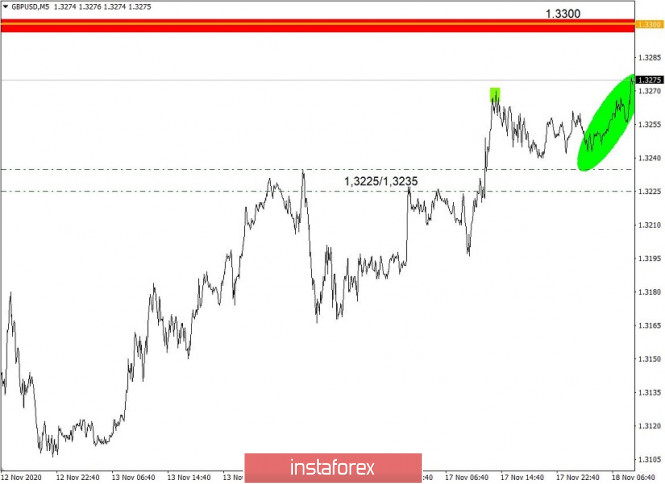
Trading plan for the EUR/USD pair on November 18. COVID-19 is retreating. The US market is at its highs. Buying the euro at a breakout is very risky. 2020-11-18 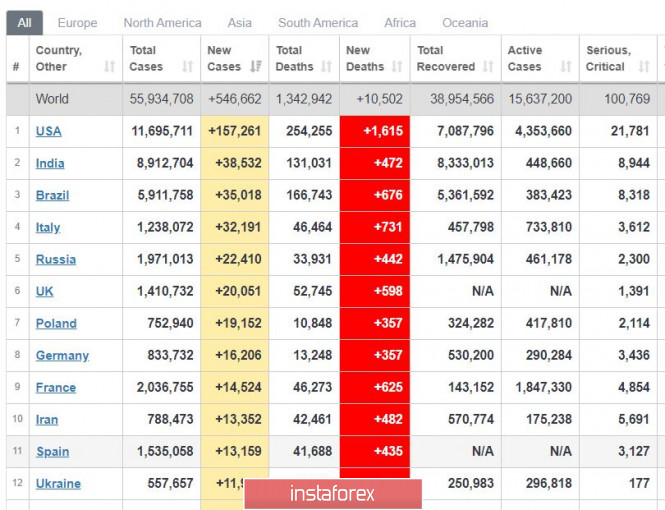
It seems that COVID-19 is retreating, since on the third day, the total number of new infections in the world was not higher than 550 thousand (the maximum is 660 thousand). Deaths per day have increased, but it is obvious that the peak of mortality is lagging behind the peak of infections. The leader is still the United States, which records 157 thousand new coronavirus cases a day. Europe, meanwhile, already saw a decrease, but the second and third places in terms of highest daily incidence are still India and Brazil. Nonetheless, there are high hopes for a vaccine. In the United States, vaccinations are expected to begin in mid-December. 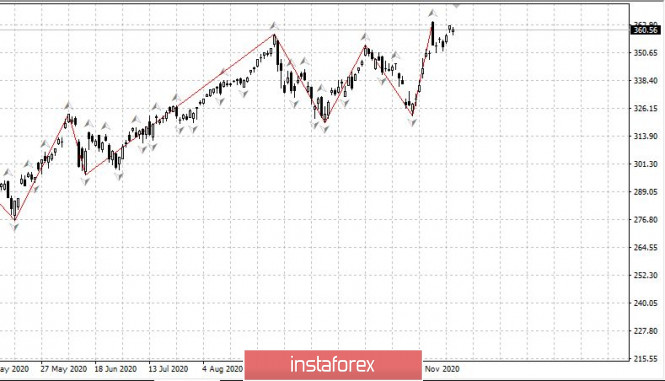
S&P 500 - the US market is at its highs, but further growth can still occur. Selling at these levels is very good, especially since there are no reasons for long-term growth from these levels. 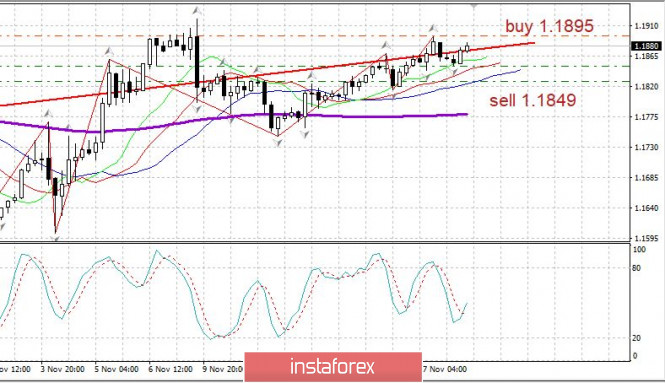
EUR/USD - Buying the euro at a breakout is very risky. Set long positions at 1.1825. Open short positions at a reversal from 1.1848. Technical analysis of EUR/USD on November 18, 2020 2020-11-18 Hello, dear traders! Yesterday, the US dollar was weakening amid the news about successful COVID-19 vaccine trials. On Monday, the American pharmaceutical company Moderna announced its experimental vaccine against Covid-19 was almost 95% effective. At the same time, the pandemic is tightening its grip on the United States and Europe. In the euro area, the worst situation is in France, Italy, and Spain. In these countries, infections among people over 60 have climbed to the highest level. Notably, since the start of the pandemic, the number of coronavirus cases in Europe has exceeded 15 million. As for the presidential election in the United States, Donald Trump, despite filing an appeal on vote fraud, actually acknowledged the victory of his opponent Joe Biden. This factor, namely Biden's victory, also contributed to the weakening of the American currency. However, economists believe that this effect will be short-term. As for the US economy, Fed's head Jerome Powell believes that it is recovering at a faster pace than previously estimated. However, recently, the recovery has slowed down. Powell reassured that the Fed was aware of what it was doing and that at the right time, all stimulus measures would be stopped. According to yesterday's mixed US statistics, the economic recovery in the country slowed down. Thus, retail sales turned out to be worse than expected. Meanwhile, industrial production increased, beating economists' forecast. Today, the following reports are set for release: the euro area's CPI, US new building permits and housing starts, as well as the speeches of the Fed's Evans, Williams and Bullard. Daily 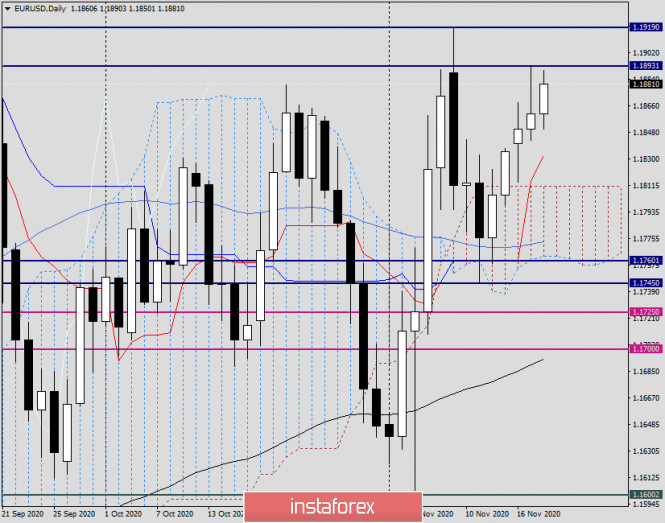
As for the technical analysis of EUR/USD, bulls have been unable to break through the strong technical zone of 1.1860-1.1880 which acts as resistance and does not allow the price to go higher. On November 17, the quote increased to 1.1893 but failed to consolidate and pulled back. Yesterday's closing level was 1.1860. Today, given yesterday's highs and a long upper shadow of the last candlestick, the task for bulls is now even more difficult. It is no longer enough for them to close the day above 1.1880, they need to reach new highs, and break through the resistance zone of 1.1900-1.1920. At the time of writing the article, EUR/USD was moving in the upward trend and was trading near 1.1884, gradually approaching yesterday's highs. H1 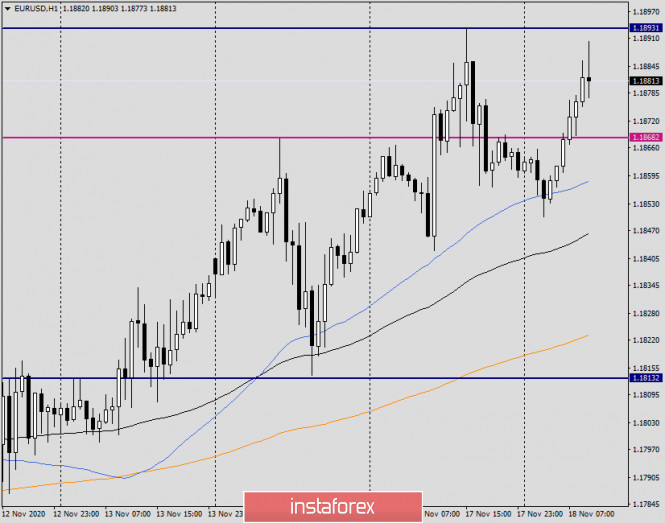
Despite the high likelihood that the euro/dollar pair will continue strengthening today, one should refrain from buying below the resistance levels of 1.1893 and 1.1919, wait for a pullback to 1.1875, 1.1870, and 1.1865/60, and consider opening long positions close to these prices. If bearish Japanese candlesticks appear under the resistance level of 1.1893 and/or in the 1.1900-1.1920 area, it will indicate that the quote cannot move further in the upward direction. Consequently, it will reverse. Good luck! Technical analysis of GBP/USD on November 18, 2020 2020-11-18 Hello, dear traders! Despite the lack of progress in the trade talks between the UK and the European Union, the pound sterling strengthened against the US dollar yesterday. In particular, British Prime Minister Boris Johnson warned that there was too little time left to make a deal with the EU. Johnson said his country wanted to conclude an agreement with the European Union, but not to the detriment of its sovereignty, border laws, and fishing rules. Thus, the British Prime Minister is already prepared for a no-deal Brexit. Given the British rhetoric on the issue, this scenario is likely to unfold. I believe that such market participants are ready for such an outcome. Nevertheless, sharp and strong fluctuations of the pound cannot be ruled out. Therefore, trading could be risky enough. At the start of the trading day, the UK presented its consumer prices report. The index turned out to be better than expected. On a monthly basis, consumer prices showed zero growth (outlook - minus 0.1%), and 0.7% year-on-year (outlook - 0.6%). This data provided some support for the pound, which was strengthening against the US dollar at that moment. Daily 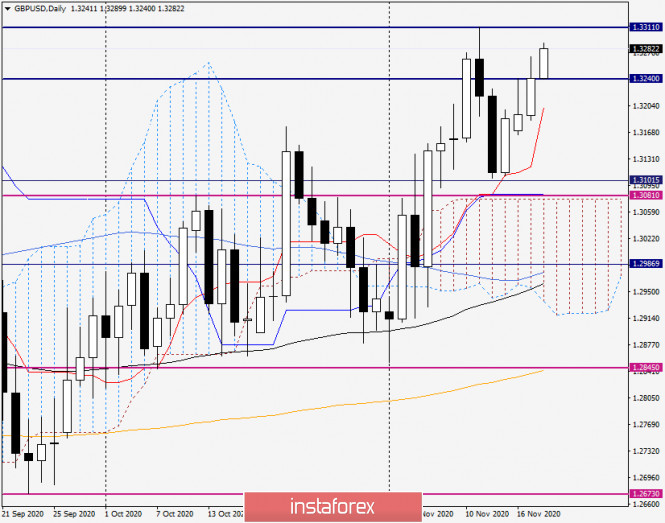
Yesterday's attempt to break through the 1.3240 mark was unsuccessful. The pair reached the level of 1.3271, but rebounded and closed at 1.3241. Currently, GBP/USD is already trading above yesterday's highs, near 1.3280, and may well continue to rise. If so, the nearest bullish target will be a strong resistance zone of 1.3300-1.3311. I assume that if the price closes above 1.3311 (high as of November 11), this will indicate that the pair will extend its upward movement. If the market sentiment changes, a bearish pattern is formed during the day, and the closing level will be below 1.3200, the trend will be downward. H1 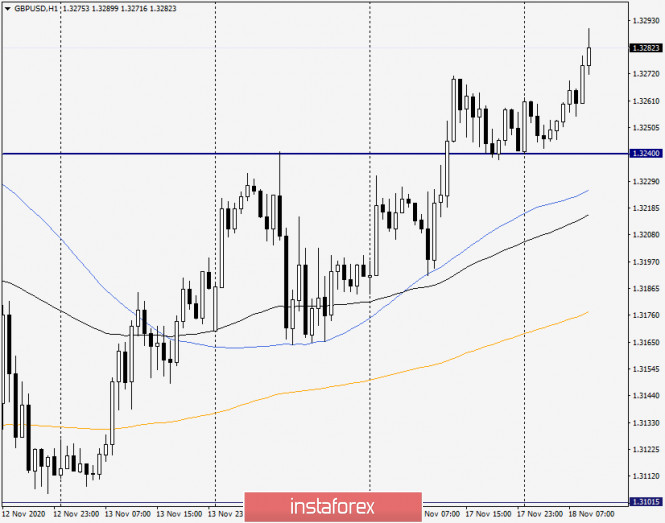
As for the H1 chart, the pair is set to extend its upward trend. Yet, it is unclear where the price will go eventually. Given a weaker US dollar and successful results on a vaccine against COVID-19, the bullish trend will likely go on. Therefore, one should consider opening long positions near the resistance levels after short-time pullbacks to the price area of 1.3260-1.3245. If bearish Japanese candlesticks are formed in the region of 1.3300-1.3311 on the H4 and H1 charts, long positions can be considered near 1.3250. In this case, targets will be seen in the 1.3300-1.3320 area. At the moment, the future direction of GBP/USD is unclear. Therefore, both options can be considered. Nevertheless, long positions after minor corrective pullbacks seem to be the most relevant. Good luck! Trading idea for the NZD/USD pair 2020-11-18  Since the beginning of the year, the NZD / USD pair has moved 14,500 pips, but ahead is a very interesting level, beyond which fixing of long positions may begin. This is the round level of 0.7. 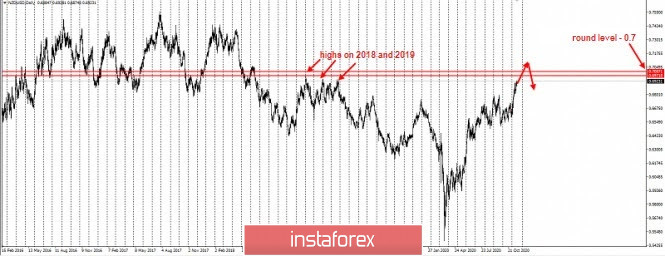 Besides being round, 0.7 is also the top of 2019, as well as an important high in 2018. For buyers, reaching this price will be an excellent reason to take profits, while for mid-term speculators, this is an opportunity to make money on counter-trend trades. The market could roll back at any time, but this should happen after reaching the level of 0.7. In that regard, the correct strategy for the NZD/USD pair is to open short positions only BEYOND the levels shown in the picture above. If traders open shorts even a bit earlier, they will fall into the trap of setting stop orders for 0.7. The right approach is to wait for a false breakout, and only after it should traders work for a fall. This idea is under the Price Action and Stop Hunting strategies. Of course, there is still the need to monitor and control the risks to avoid losing profit. As we all know, trading in this market is precarious and uncertain, but very profitable as long as we use the right strategies. Good luck! Technical analysis of EUR/USD for November 18, 2020 2020-11-18 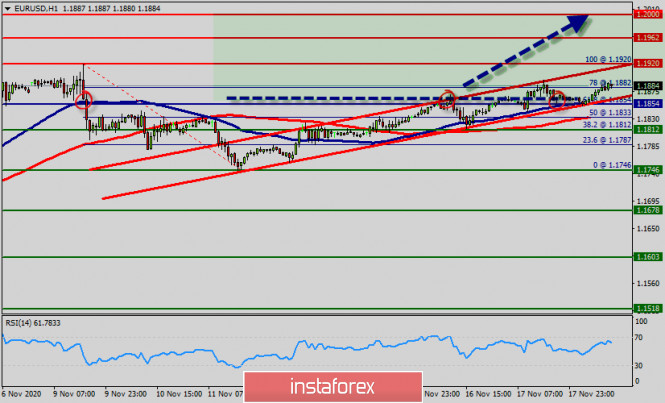 Overview : Price for EUR/USD pair is back to the major resistance right now around the spot of 1.1854 - 1.1880. It is moving in this ascending channel pattern ( bullish). Further close above the high end may cause a rally towards 1.1880. Nonetheless, the weekly resistance level (1.1920) and zone should be considered. The EUR/USD pair broke the first resistance which turned to strong support at the level of 1.1854 yesterday. The level of 1.1854 is expected to act as major support today. From this point, we expect the EUR/USD pair to continue moving in a bullish trend from the support levels of 1.1854 and 1.1880. Currently, the price is moving in a bullish channel. This is confirmed by the RSI indicator signaling that we are still in the bullish trending market. Consequently, the first support is set at the level of 1.4257 (horizontal green line). So, the market is likely to show signs of a bullish trend around the spot of 1.1854/1.1880. In other words, buy orders are recommended above the spot of 1.1854 or 1.1880 with the first target at the level of 1.1920; and continue towards 1.1962 (the weekly resistance 2). This would suggest a bearish market because the moving average (100) is still in a positive area and does not show any trend-reversal signs at the moment. Thus, the market is indicating a bullish opportunity above the above-mentioned support levels, for that the bullish outlook remains the same as long as the 100 EMA is headed to the upside. Amid the previous events, the pair is still in a downtrend, because the EUR/USD pair is trading in a bearish trend from the new support line of 1.1854 towards the first resistance level at 1.1962 in order to test it. On the other hand, if the EUR/USD pair fails to break through the resistance level of 1.1962 this week, the market will decline further to 1.1854 (return to pivot). The pair is expected to drop lower towards at least 1.1854 with a view to test the weekly pivot point. Also, it should be noted that the weekly pivot point will act as major support today. Technical analysis of GBP/USD for November 18, 2020 2020-11-18 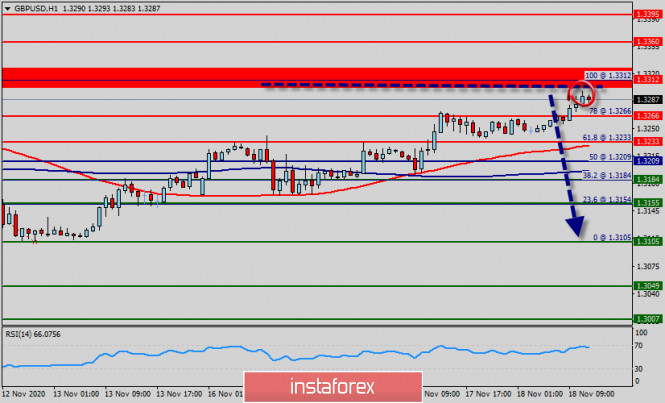 Overview : The GBP/USD pair faced resistance at the level of 1.3360, while minor resistance is seen at 1.3312. Support is found at the levels of 1.3266 and 1.3233. Also, it should be noted that a daily pivot point has already set at the level of 1.3209. Equally important, the GBP/USD pair is still moving around the key level at 1.3266. Yesterday, the GBP/USD pair continued to move upwards from the level of 1.3209. The pair rose from the level of 1.3209 (this level of 1.3209 coincides with the double bottom) to the top around 1.330. In consequence, the GBP/USD pair broke resistance, which turned strong support at the level of 1.3209. The level of 1.3209is expected to act as major support today. From this point, we expect the GBP/USD pair to continue moving in the bullish trend from the support level of 1.3209 towards the target level of 1.3312. If the pair fails in passing through the level of 1.3312, the market will indicate the bearish opportunity below the level of 1.3312 in order to back to the pivot point at 1.3209. Furthermore, if the GBP/USD pair is able to break out the bottom at 1.3209, the market will decline further to 1.3184 (daily support 1). Hence, the price will fall into a bearish trend so as to go further towards the strong support at 1.3155 to test it again. The level of 1.3105 will form a double bottom. On the other hand, if the price closes above the strong resistance of 1.3360, the best location for a stop loss order is seen above 1.3395. Gold may decline further if US stocks faced correction 2020-11-18 In the run-up to the US presidential election, gold rose on expectations of aggressive fiscal stimulus, which would create a reflationary environment and help lower real Treasury bond yields. With the absence of the blue wave which may significantly decrease the scale of additional assistance to the economy, the precious metal fell into an avalanche of sales. Currently, it is under pressure due to the expected vaccination of the population by investors and the recovery of global GDP. In this situation, US debt market rates go up, and XAUUSD quotes go down. For gold, the external background is important. A weak economy and accelerating inflation is one thing, but a strong economy and the unwillingness of consumer prices to accelerate is another. In the second case, the precious metal usually comes under pressure. Moreover, there is no place for it in investment portfolios. According to EPFR Global, thanks to positive news about vaccines, net capital inflows to equity-related funds in the previous week amounted to $44.5 billion, and net outflows from band-oriented funds totaled $4 billion. The yield on US Treasury bonds jumped to 0.9%, although it has hovered near the 0.6% mark in recent months. Dynamics of capital flows in ETF: 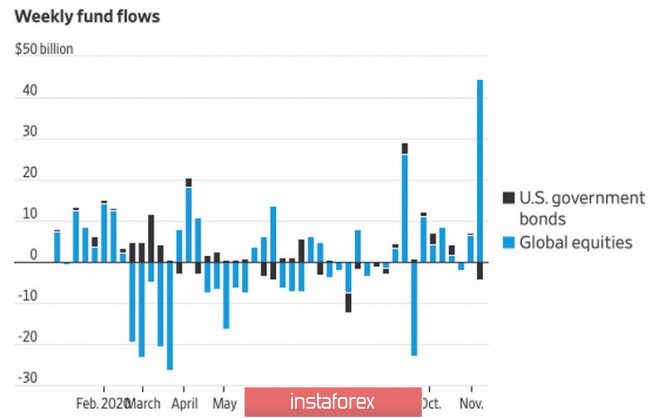
An additional blow to gold may be caused by the correction of US stock indexes. The S&P 500 has hit record highs thanks to news of successful COVID-19 vaccine trials, but there is no solid foundation under the US stock market. American industrial production is 5.6% lower than before the pandemic, and retail sales in October grew at the slowest pace in six months. It is difficult to expect success if the number of infections and hospitalizations in the US reaches record highs, and aid programs end, which leads to a decrease in consumer spending and GDP. According to Jerome Powell, even with the good news about vaccines, the US economy has a long road to recover to previous levels. According to research by BofA Merrill Lynch, the share of cash in the portfolios of the world's largest investors has fallen to a critical 4%, which usually signals a potential correction in the S&P 500. The Bank recommends that its clients fix their profits on the news about vaccines. Dynamics of the S&P 500 and the share of cash in portfolios: 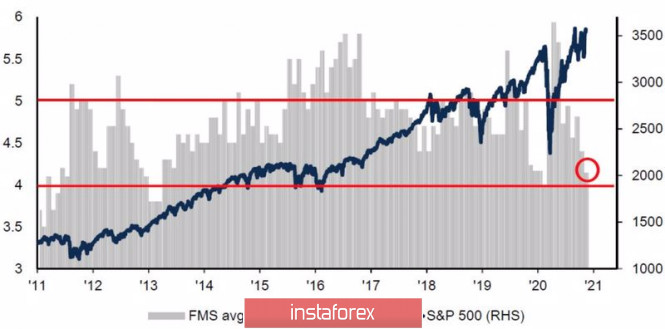
If the US equity market starts to sell off, which, in my opinion, is quite justified due to excessive and premature euphoria about the victory over COVID-19, the demand for safe-haven assets, including the dollar, will increase sharply. Bad news for the precious metal, which is quoted in the USD. Technically, the Broadening Wedge pattern continues to play out on the daily chart. The failure of gold to stay above $1,900 and $1,882 and then return to the levels of $1,882 and $1,872 per ounce, respectively, should be used for sales as part of an aggressive strategy. Conservative suggests that the signal for the formation of shorts will be a breakout of support at $1855-1857. Gold, daily chart: 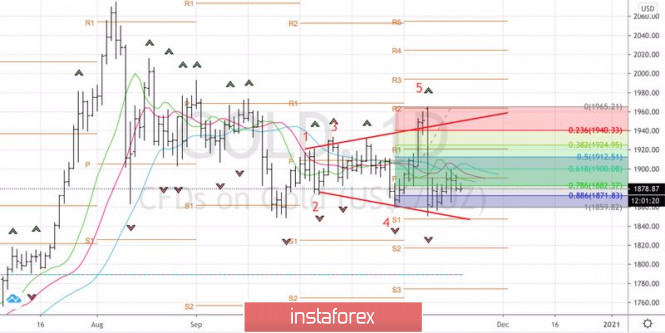
November 18, 2020 : EUR/USD daily technical review and trade recommendations. 2020-11-18 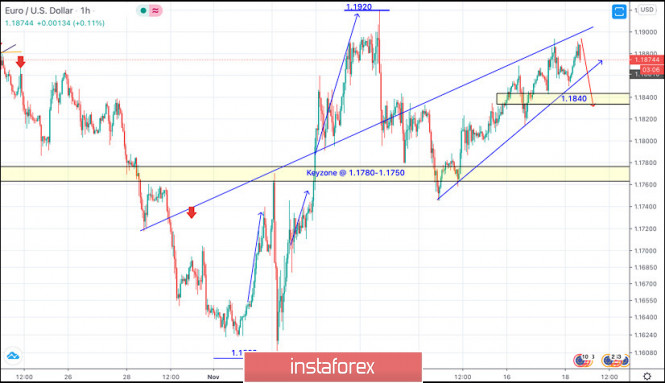
Recently, Two opportunities for SELL Entries were offered upon the recent upside movement towards 1.1880-1.1900. All target levels were achieved. Early signs of bullish reversal were demonstrated around the recent price levels of 1.1600. Shortly after, the EUR/USD pair has demonstrated a significant BUYING Pattern after the recent upside breakout above the depicted price zone (1.1750-1.1780) was achieved. As mentioned in the previous article, the pair has targeted the price levels around 1.1920 which exerted considerable bearish pressure bringing the pair back towards 1.1800 which constituted a prominent KEY-Zone for the EUR/USD pair. Thus, the pair remains trapped between the price levels of 1.1750-1.1900 until breakout occurs in either directions. Moreover, the price zone around 1.1840 stands as a prominent KeyZone to be watched for SUPPORT. That's why, bearish closure below which will probably trigger aquick bearish decline initially towards 1.1750. Trade Recommendations :- Currently, the price zone around 1.1840 and 1.1780 stand as significant SUPPORT-Zones to be watched for bullish rejection upon any upcoming downside movement. Exit level should be placed below 1.1750. EUR/USD analysis for November 18 2020 - Potential for the downside rotation towards 1.1850 2020-11-18 Eurozone October final core CPI +0.2% vs +0.2% y/y prelim Latest data released by Eurostat - 18 November 2020 CPI -0.3% vs -0.3% y/y prelim No change to the initial estimates as Eurozone inflation continues to remain more subdued. This just reaffirms the need for the ECB to take more decisive measures next month. Further Development 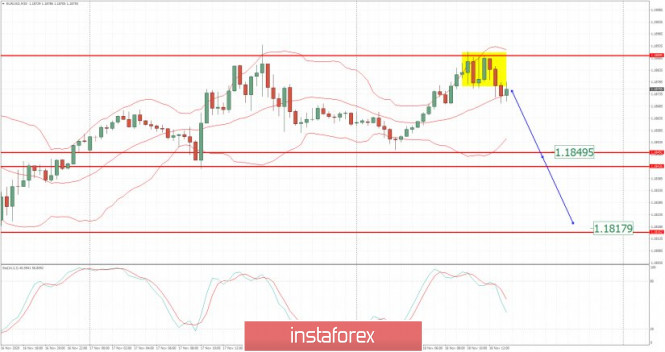
Analyzing the current trading chart of EUR/USD, I found that there is rejection of the important pivot level at 1,1890, which is good sign for further downside movement. My advice is to watch for selling opportunities with the targets at 1,1850 and 1,1820 Additionally, there is the bearish divergence on the Stochastic oscillator, which is another confirmation for the further downside.... 1-Day relative strength performance Finviz 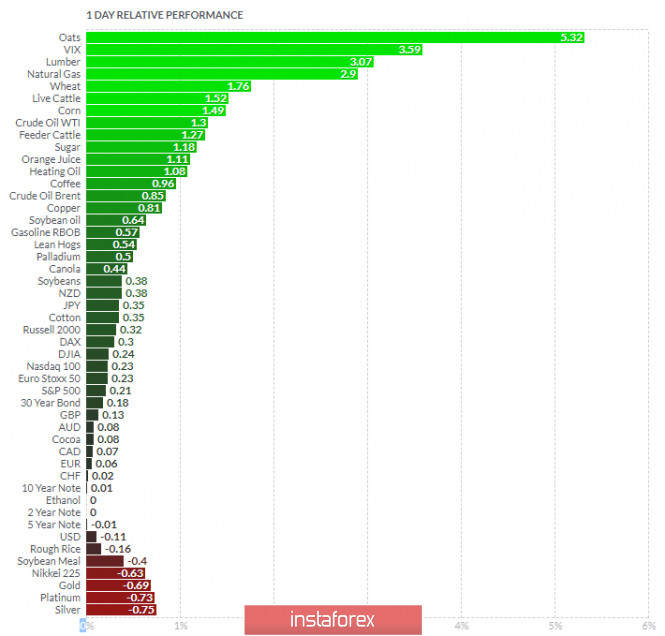
Based on the graph above I found that on the top of the list we got Oats and VIX today and on the bottom Silver and Platinum. In my opinion both Gold and Silver might be extended today and ready for to downside rotation. Key Levels: Resistance: 1,1890 Support levels: 1,1850 and 1,1820 Analysis of Gold for November 18,.2020 - Strong downside continuation as I expected and potential for test of $1.850/20 2020-11-18 Vaccine shown to be 95% effective in final efficacy analysis of Phase 3 trial - Plans to file for emergency-use authorisation within days
- No serious safety concerns observed in the tiral
- Side effects were mostly mild to moderate, cleared up quickly
- Only significant side effect greater than 2% frequency was fatigue at 3.7%
Risk trades are getting another shot in the arm on the news here, albeit a more modest one this time around. European stocks are holding slight gains now of around 0.4% while US futures are pushing slightly higher as well on the headlines. The 95% efficacy rate bugs me a little, as this sort of reflects that this has turned into a huge vaccine race after Moderna announced a 94.5% efficacy rate earlier this week. But if they have the data to back that up, then sure all the better for humanity. 
Based on the graph above I found that on the top of the list we got Oats and VIX today and on the bottom Silver and Platinum. Gold is negative on the list today, which is another sign of the weakness.. Key Levels: Resistance: $1,9000 Support levels: $1,850 and $1,820.
Author's today's articles: Pavel Vlasov  No data No data Vladislav Tukhmenev  Vladislav graduated from Moscow State University of Technologiy and Management. He entered the forex market in early 2008. Vladislav is a professional trader, analyst, and manager. He applies a whole gamut of analysis – technical, graphical, mathematical, fundamental, and candlestick analysis. Moreover, he forecasts the market movements using his own methods based on the chaos theory. Vladimir took part in development of trading systems devoted to fractal analysis. In his free time, Vladimir blogs about exchange markets. Hobbies: active leisure, sporting shooting, cars, design, and marketing. "I do not dream only of becoming the best in my field. I also dream about those who I will take with me along the way up." Vladislav graduated from Moscow State University of Technologiy and Management. He entered the forex market in early 2008. Vladislav is a professional trader, analyst, and manager. He applies a whole gamut of analysis – technical, graphical, mathematical, fundamental, and candlestick analysis. Moreover, he forecasts the market movements using his own methods based on the chaos theory. Vladimir took part in development of trading systems devoted to fractal analysis. In his free time, Vladimir blogs about exchange markets. Hobbies: active leisure, sporting shooting, cars, design, and marketing. "I do not dream only of becoming the best in my field. I also dream about those who I will take with me along the way up." Mihail Makarov  - - Ivan Aleksandrov  Ivan Aleksandrov Ivan Aleksandrov Andrey Shevchenko  Andrey Shevchenko Andrey Shevchenko Mourad El Keddani  Was born in Oujda, Morocco. Currently lives in Belgium. In 2003 obtained B.S. in Experimental Sciences. In 2007 obtained a graduate diploma at Institut Marocain Specialise en Informatique Applique (IMSIA), specialty – Software Engineering Analyst. In 2007–2009 worked as teacher of computer services and trainer in a professional school specializing in computer technologies and accounting. In 2005 started Forex trading. Authored articles and analytical reviews on Forex market on Forex websites and forums. Since 2008 performs Forex market research, and develops and implements his own trading strategies of Forex analysis (especially in Forex Research & Analysis, Currency Forecast, and Recommendations and Analysis) that lies in: Numerical analysis: Probabilities, equations and techniques of applying Fibonacci levels. Classical analysis: Breakout strategy and trend indicators. Uses obtained skills to manage traders' accounts since 2009. In April 2009 was certified Financial Technician by the International Federation of Technical Analysts. Winner of several social work awards: Education Literacy and Non-Formal Education (in Literacy and Adult Education in The National Initiative for Human Development). Was born in Oujda, Morocco. Currently lives in Belgium. In 2003 obtained B.S. in Experimental Sciences. In 2007 obtained a graduate diploma at Institut Marocain Specialise en Informatique Applique (IMSIA), specialty – Software Engineering Analyst. In 2007–2009 worked as teacher of computer services and trainer in a professional school specializing in computer technologies and accounting. In 2005 started Forex trading. Authored articles and analytical reviews on Forex market on Forex websites and forums. Since 2008 performs Forex market research, and develops and implements his own trading strategies of Forex analysis (especially in Forex Research & Analysis, Currency Forecast, and Recommendations and Analysis) that lies in: Numerical analysis: Probabilities, equations and techniques of applying Fibonacci levels. Classical analysis: Breakout strategy and trend indicators. Uses obtained skills to manage traders' accounts since 2009. In April 2009 was certified Financial Technician by the International Federation of Technical Analysts. Winner of several social work awards: Education Literacy and Non-Formal Education (in Literacy and Adult Education in The National Initiative for Human Development).
Languages: Arabic, English, French and Dutch.
Interests: Algorithm, Graphics, Social work, Psychology and Philosophy. Igor Kovalyov  Igor Kovalyov was born on September 24, 1985. Igor graduated from Krasnoyarsk State University with a degree in Philology and Journalism. He has a wide experience as a newspaper and information agency correspondent. He got interested in financial markets in 2001. He also graduated from Moscow State University of Economics, Statistics, and Informatics (MESI) with a degree in Global Economics and then served as an analyst in an investment company. He has been working at InstaForex since 2014. Igor Kovalyov was born on September 24, 1985. Igor graduated from Krasnoyarsk State University with a degree in Philology and Journalism. He has a wide experience as a newspaper and information agency correspondent. He got interested in financial markets in 2001. He also graduated from Moscow State University of Economics, Statistics, and Informatics (MESI) with a degree in Global Economics and then served as an analyst in an investment company. He has been working at InstaForex since 2014. Mohamed Samy  Born November 18, 1966, in Egypt. In 1990 graduated from the Faculty Of Engineering, Alexandria University. In 2000 started to follow financial markets. Took a higher diploma in investing and finance in 2008 and also CMT in 2009. Started at the Financial World as an analyst, then worked as a technical analysis consultant at Misr Financial Investments Co. Since 2005 has been working on the Stock Exchange. Has been familiar with Forex since December 2005. Being a member of the Egyptian Society of Technical Analysis, attends seminars and conferences dedicated to financial markets. Is a member of the American Market Technicians Association. Interests: football, reading, volleyball, swimming, movies Born November 18, 1966, in Egypt. In 1990 graduated from the Faculty Of Engineering, Alexandria University. In 2000 started to follow financial markets. Took a higher diploma in investing and finance in 2008 and also CMT in 2009. Started at the Financial World as an analyst, then worked as a technical analysis consultant at Misr Financial Investments Co. Since 2005 has been working on the Stock Exchange. Has been familiar with Forex since December 2005. Being a member of the Egyptian Society of Technical Analysis, attends seminars and conferences dedicated to financial markets. Is a member of the American Market Technicians Association. Interests: football, reading, volleyball, swimming, movies Petar Jacimovic  Petar was born on July 08, 1989 in Serbia. Graduated from Economy University and after has worked as a currency analyst for large private investors. Petar has been involved in the world of finance since 2007. In this trading he specializes in Volume Price Action (volume background, multi Fibonacci zones, trend channels, supply and demand). He also writes the market analytical reviews for Forex forums and websites. Moreover Petar is forex teacher and has wide experience in tutoring and conducting webinars. Interests : finance, travelling, sports, music "The key to success is hard work" Petar was born on July 08, 1989 in Serbia. Graduated from Economy University and after has worked as a currency analyst for large private investors. Petar has been involved in the world of finance since 2007. In this trading he specializes in Volume Price Action (volume background, multi Fibonacci zones, trend channels, supply and demand). He also writes the market analytical reviews for Forex forums and websites. Moreover Petar is forex teacher and has wide experience in tutoring and conducting webinars. Interests : finance, travelling, sports, music "The key to success is hard work"
Subscription's options management Theme's:
Fundamental analysis, Fractal analysis, Wave analysis, Technical analysis, Stock Markets
Author's :
A Zotova, Aleksey Almazov, Alexander Dneprovskiy, Alexandr Davidov, Alexandros Yfantis, Andrey Shevchenko, Arief Makmur, Dean Leo, Evgeny Klimov, Fedor Pavlov, Grigory Sokolov, I Belozerov, Igor Kovalyov, Irina Manzenko, Ivan Aleksandrov, l Kolesnikova, Maxim Magdalinin, Mihail Makarov, Mohamed Samy, Mourad El Keddani, Oleg Khmelevskiy, Oscar Ton, Pavel Vlasov, Petar Jacimovic, R Agafonov, S Doronina, Sebastian Seliga, Sergey Belyaev, Sergey Mityukov, Stanislav Polyanskiy, T Strelkova, Torben Melsted, V Isakov, Viktor Vasilevsky, Vladislav Tukhmenev, Vyacheslav Ognev, Yuriy Zaycev, Zhizhko Nadezhda
Edit data of subscription settings
Unsubscribe from the mailing list Sincerely,
Analysts Service | If you have any questions, you can make a phone call using one of the
InstaForex Toll free numbers right now:
|  | InstaForex Group is an international brand providing online trading services to the clients all over the world. InstaForex Group members include regulated companies in Europe, Russia and British Virgin Islands. This letter may contain personal information for access to your InstaForex trading account, so for the purpose of safety it is recommended to delete this data from the history. If you have received this letter by mistake, please contact InstaForex Customer Relations Department. |


No comments:
Post a Comment