| Indicator analysis. Daily review on the GBP/USD currency pair for November 12, 2020 2020-11-12 Trend analysis (Fig. 1). Today, the market from the level of 1.3223 (closing of yesterday's daily candlestick) can continue to work down with the goal of 1.3163 – a pullback level of 23.6% (red dotted line). After testing this line, continue working down with the target of 1.3070 - a pullback level of 38.2% (red dotted line). Upon reaching this level, upward work is possible. 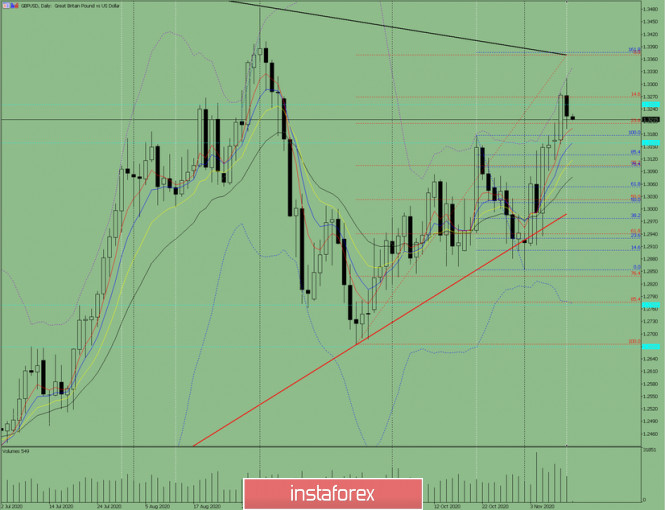
Figure 1 (Daily Chart). Comprehensive analysis: - Indicator analysis - down;
- Fibonacci levels - down;
- Volumes - down;
- Candlestick analysis - down;
- Trend analysis - up;
- Bollinger bands - up;
- Weekly chart - down.
General conclusion: Today, the price from the level of 1.3223 (closing of yesterday's daily candlestick) can continue to work downward with the goal of 1.3163 – a pullback level of 23.6% (red dotted line). After testing this line, continue working down with the target of 1.3070 - a pullback level of 38.2% (red dotted line). Alternative scenario: when moving down and reaching the pullback level of 23.6% - 1.3163 (red dotted line), the market will try to move up with the goal of 1.3251 – the historical resistance level (blue dotted line). Trading plan for EUR/USD and GBP/USD on 11/12/2020 2020-11-12 Yesterday, the euro and the pound initially showed good growth, but they had to give up all their gains in the end. At first glance, it may seem that it's all about yesterday's speech by Christine Lagarde. After all, it was assumed that against the background of reports about the appearance of a coronavirus vaccine, the European Central Bank might hint at the possibility of reducing the stimulus measures introduced just because of the global pandemic that hit Europe very hard. However, the speech of the head of the European Central Bank has nothing to do with this. After all, not only the single European currency was declining, but also the pound. And nor did Christine Lagarde say address the issue at all. Therefore, we can assume that the things that happened yesterday is because of something else. Apparently, it's all about the rumors that began to spread in the American media. There are more and more reports that Mr. Trump may abandon further struggle for the presidency and even withdraw lawsuits filed due to massive violations and falsifications during the voting itself and the subsequent vote count. This assumption is due to the fact that even if Donald Trump manages to achieve a recount of ballots in a number of states, he will not be able to do it in key states. As a result, he will still not get enough electoral votes. In other words, fighting his position will be meaningless. Although, according to rumors, the current president still does not recognize the past elections as fair. However, if these rumors are even slightly close to the truth, it is a factor that reduces uncertainty, and therefore has a positive impact. Most likely, this is what allowed the dollar to recoup its losses. 
It is time for investors to turn their attention to macroeconomics due to the fact that the conflict regarding the US election is already ending. Fortunately, today's statistics are all right and there will be quite a few of them. The first to report will be the UK, where the pace of economic decline is expected to slow down from -21.5% to -9.7%. This is a fairly significant improvement in GDP dynamics, but only for the preliminary data. At the same time, certain improvement is expected in the industry, whose rate of decline may slow down from -6.4% to -6.2%. Against this background, the forecasts are entirely positive and quite impressive, although we are still talking about a recession. Nevertheless, even a hint of improvement is now being received with great optimism. Industrial production (UK): 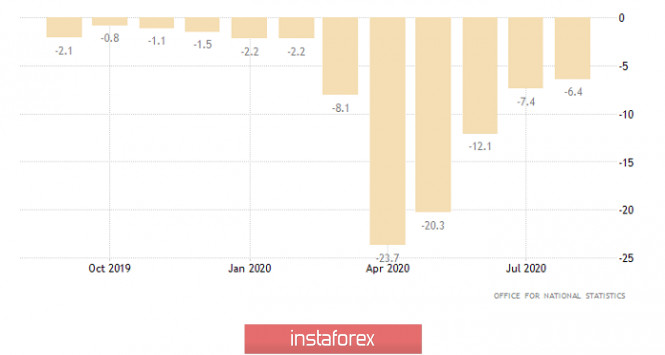
Industry in the euro area should also show improvement, where the rate of its decline may slow down from -7.2% to -5.4%. All this should lead to the fact that the euro will slightly grow with the pound. Industrial production (Europe): 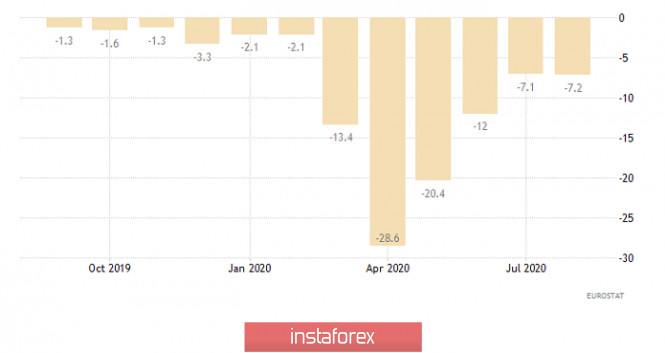
However, the euro's growth will be temporary. We may witness not just a return, but also a subsequent strengthening of the dollar after the opening of the US session. Of course, it's all about inflation growth, which is expected to rise from 1.4% to 1.5%. This is a favorable factor. However, we are talking about the fact that inflation has been growing for five consecutive months, given that the forecasts are confirmed. In other words, US inflation is growing steadily, which means that the Fed does not need to think about any additional stimulus measures. Rather, on the contrary, it's time to think about reducing them. That is, about tightening the parameters of monetary policy. In addition, the dollar will be supported by data on applications for unemployment benefits, which may continue to decline. In particular, the number of initial applications should be reduced from 751 thousand to 743 thousand. But this is not much, so repeated applications are greatly interesting, which is expected to decline from 7,285 thousand to 6,820 thousand. As a result, US inflation is expected to continue to rise and unemployment is expected to decline. Repetitive Unemployment Insurance Claims (United States): 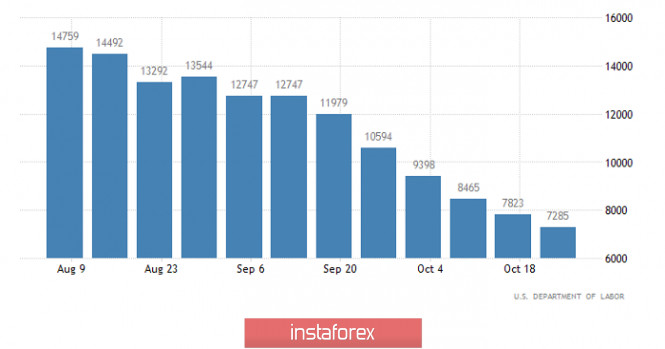
The EUR/USD pair has been consistently forming a downward movement since this trading week started, as a result of which the quote declined to the level of 1.1750, where a stop occurred with a subsequent pullback. We can assume that there will be another decline which will lead to the values 1.1700 - 1.1650 --- 1.1620, if the price consolidates below 1.1745. 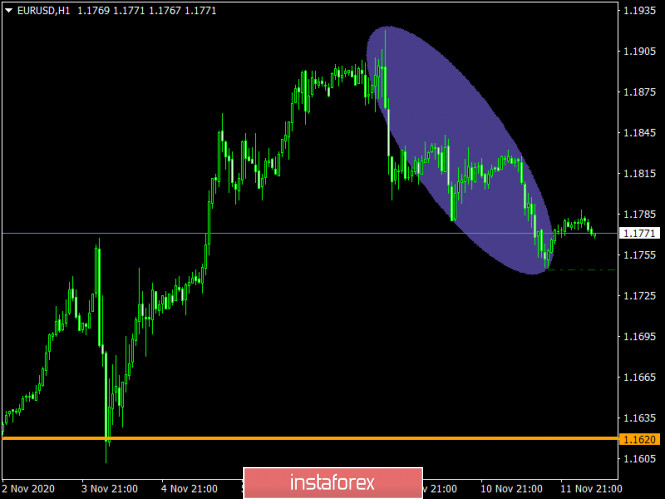
The GBP/USD pair found a resistance around the level of 1.3300, where there was a stop, followed by a corrective move. We can assume that a price consolidation below the level of 1.3190 will lead to a decline towards 1.3140-1.3100. It should be noted that as long as the quote does not consolidate below 1.3190 on an H4 TF, a variable gap in the amplitude 1.3190/1.3240 is possible. 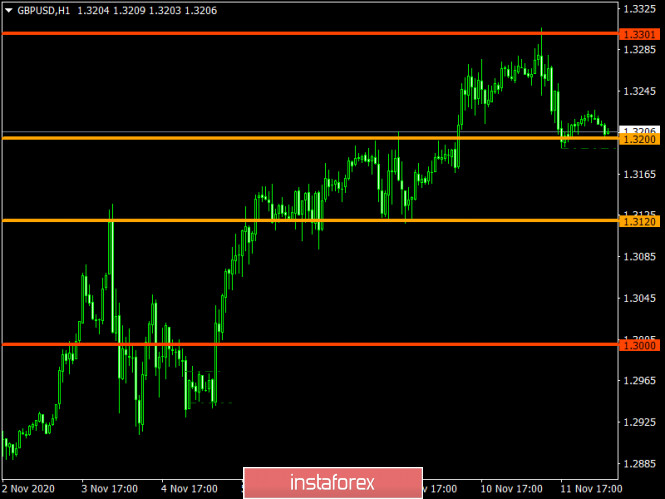
EUR/USD: plan for the European session on November 12. COT reports. Bears achieved their goals, pair's direction depends on today's data 2020-11-12 To open long positions on EUR/USD, you need: Selling the euro below the 1.1797 level, which I mentioned in yesterday's morning forecast, brought a good result, since the bears managed to get to the next target level of 1.1743 in the US session. If you look at the 5-minute chart and remember yesterday's forecast, you will see that a good signal to sell the euro appeared after forming a breakout and getting the pair to settle below the 1.1797 level, followed by its test from the bottom up, which then pulled down the pair to a low of 1.1743. By the way, I advised you to open long positions immediately on a rebound from this level in the afternoon, which also made it possible to take additional 20-30 points of profit from the market. 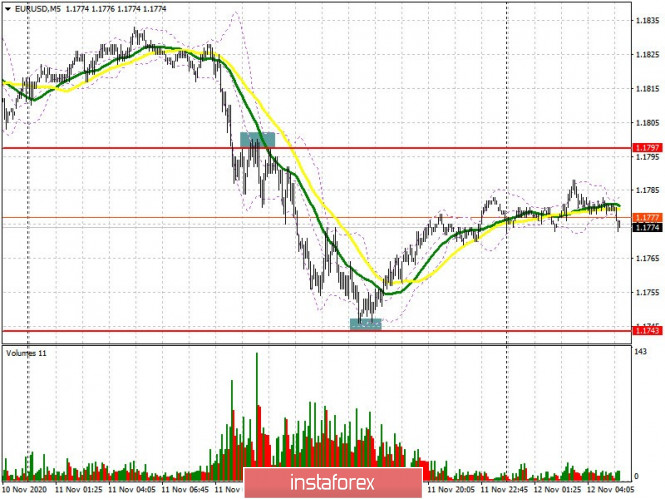 Buyers of the euro will most likely focus on protecting support at 1.1743 in the morning, which they defended in yesterday's US session. However, I recommend opening long positions from it only when a false breakout is formed there and also when yesterday's low has been updated, which will be confirmed by the divergence on the MACD indicator that is gradually emerging. In case bulls are not active amid weak data, and today we have quite interesting reports on German inflation and the volume of industrial production in the eurozone, I recommend completely postponing long positions until the low of 1.1701 has been tested, where you can buy the euro immediately on a rebound. An equally important task for the bulls is to return the 1.1797 level, the area which is where the moving averages are now playing on the side of sellers. Going beyond and testing this level from top to bottom produces a convenient entry point to long positions with the goal of restoring the euro's growth, which will lead to resistance at 1.1860. The next goal will be a high of 1.1915, where I recommend taking profits. To open short positions on EUR/USD, you need: The sellers' initial task is to protect resistance at 1.1797, which they managed to win back yesterday afternoon and from which they built a rather large downward trend. As long as trading is carried out below this range, we can expect the downward trend to continue. An unsuccessful attempt to rise above 1.1797 after we receive data on the eurozone economy also forms an additional signal to open short positions in EUR/USD. In this case, the nearest target will be a low of 1.1743. Going beyond this area will increase pressure on the pair and quickly pull it down to a low of 1.1701, where I recommend taking profits. If the bulls turn out to be stronger and they manage to bring back the 1.1797 area in the first half of the day, then it is best not to rush to sell, but to postpone new short positions until the resistance of 1.1860 has been renewed. I also recommend selling EUR/USD immediately on a rebound from a high of 1.1915, counting on a correction of 15-20 points within the day. 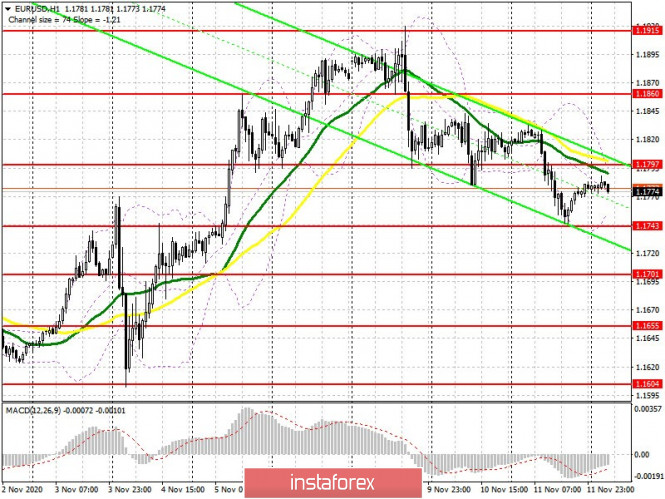 The Commitment of Traders (COT) report for November 3 recorded a reduction in long positions and an increase in short positions. Despite this, buyers of risky assets believe in the continuation of the bull market, although they prefer to proceed with caution. Thus, long non-commercial positions fell from 217,443 to 208,237, while short non-commercial positions rose from 61,888 to 67,888. The total non-commercial net position fell to 140,349, from 155,555 a week earlier. However, the bullish sentiment on the euro remains rather high in the medium term, especially after the victory of Joe Biden, who intends to endow the US economy with the next largest monetary aid package worth more than $2 trillion. Indicator signals: Moving averages Trading is carried out below 30 and 50 moving averages, which indicates the likelihood of further downward correction of the euro. Note: The period and prices of moving averages are considered by the author on the H1 hourly chart and differs from the general definition of the classic daily moving averages on the daily D1 chart. Bollinger Bands A breakout of the upper border of the indicator around 1.1797 will lead to a new wave of euro growth. A break of the lower border at 1.1755 will increase pressure on the euro. Description of indicators - Moving average (moving average, determines the current trend by smoothing out volatility and noise). Period 50. It is marked in yellow on the chart.
- Moving average (moving average, determines the current trend by smoothing out volatility and noise). Period 30. It is marked in green on the chart.
- MACD indicator (Moving Average Convergence/Divergence — convergence/divergence of moving averages) Quick EMA period 12. Slow EMA period to 26. SMA period 9
- Bollinger Bands (Bollinger Bands). Period 20
- Non-commercial speculative traders, such as individual traders, hedge funds, and large institutions that use the futures market for speculative purposes and meet certain requirements.
- Long non-commercial positions represent the total long open position of non-commercial traders.
- Short non-commercial positions represent the total short open position of non-commercial traders.
- Total non-commercial net position is the difference between short and long positions of non-commercial traders.
GBP/USD: plan for the European session on November 12. COT reports. Pound started a correction, but GDP data may bring back new buyers to the market 2020-11-12 To open long positions on GBP/USD, you need: The British pound emerged from an excellent side yesterday, allowing both buyers and sellers to earn money. There was a great long entry point in the morning, which I discussed in detail in yesterday's review. The bears' unsuccessful sluggish attempt to regain the market below 1.3261 led to another false breakout, which only confirmed the preservation of the bull market at the beginning of the European session. The large rally towards the 1.3315 high was not surprising, afterwards the bulls began to take profit. The currency was under pressure in the afternoon. I advised you to open short positions only when the pair has settled below support at 1.3242, which is what happened. On the chart, you can see the bears going below 1.2342 and then testing that same level from the bottom up, forming an excellent entry point for short positions that generated over 60 points of profit. 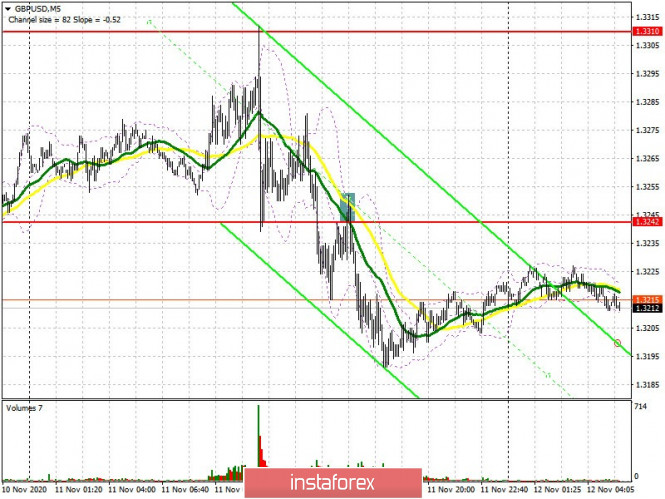 Buyers should return resistance at 1.3248, since the pair's long term direction depends on this level. However, this can only be done in case we receive good data on the UK economy for the third quarter. A breakout and settling above 1.3248 as well as testing this level from top to bottom produces an excellent entry point into long positions, which will open a direct road to the weekly high of 1.3310. Bank of England Governor Andrew Bailey could provide support to the pound, which will lead to a breakdown of 1.3310 and growth to a high of 1.3378, where I recommend taking profit. In case GBP/USD falls in the first half of the day after receiving weak data, it is best not to rush into long deals, but instead you should wait for a false breakout to form in the support area of 1.3172. Lack of bullish activity in this range could pull down the pound. Therefore, I recommend opening long positions immediately on a rebound from support at 1.3094, counting on a correction of 30-40 points within the day. To open short positions on GBP/USD, you need: Pound sellers will aim to protect resistance at 1.3248, which may be tested today after the release of a number of fundamental data on the UK economy. If they manage to form a false breakout at this level, this will be another signal to open short positions further along the trend. A breakout and settling below support at 1.3172 is also an important task for maintaining the downward momentum. This will increase the pressure on the pair and pull down GBP/USD to a low of 1.3094, where I recommend taking profits. Do not rush to open short positions in case bears are not active at the 1.3248 level. It is best to wait until the weekly high of 1.3310 has been updated and a false breakout is formed there, or to sell GBP/USD immediately on a rebound from resistance at 1.3378, counting on a correction of 30-40 points within the day. 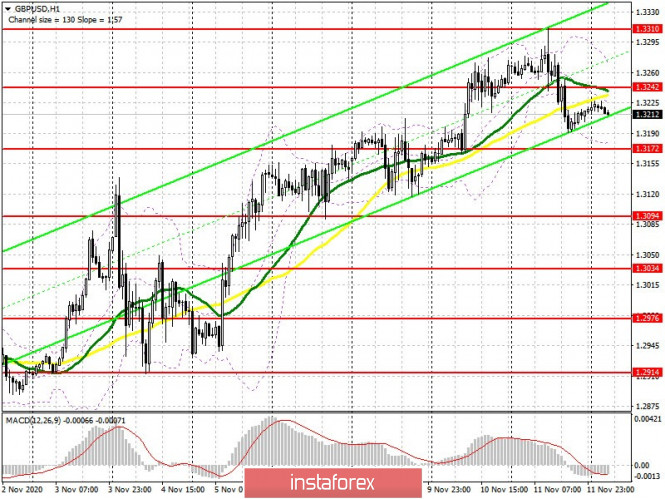 The Commitment of Traders (COT) report for November 3 showed a reduction in long positions and a slight increase in short ones. Long non-commercial positions fell from 31,799 to 27,701. At the same time, short non-profit positions only rose to 38,928, from 38,459. As a result, the negative non-commercial net position was 11,227, against 6,660 a week earlier, which indicates that sellers of the British pound remain in control and have a minimal advantage in the current situation. Indicator signals: Moving averages Trading is carried out just below the 30 and 50 moving averages, which indicates the likelihood of the continued downward correction. Note: The period and prices of moving averages are considered by the author on the H1 hourly chart and differs from the general definition of the classic daily moving averages on the daily D1 chart. Bollinger Bands The breakout of the upper border in the 1.3254 area will lead to a new wave of growth for the pound. A break of the lower border of the indicator around 1.3172 will increase the pressure on the pound. Description of indicators - Moving average (moving average, determines the current trend by smoothing out volatility and noise). Period 50. It is marked in yellow on the chart.
- Moving average (moving average, determines the current trend by smoothing out volatility and noise). Period 30. It is marked in green on the chart.
- MACD indicator (Moving Average Convergence/Divergence — convergence/divergence of moving averages) Quick EMA period 12. Slow EMA period to 26. SMA period 9
- Bollinger Bands (Bollinger Bands). Period 20
- Non-commercial speculative traders, such as individual traders, hedge funds, and large institutions that use the futures market for speculative purposes and meet certain requirements.
- Long non-commercial positions represent the total long open position of non-commercial traders.
- Short non-commercial positions represent the total short open position of non-commercial traders.
- Total non-commercial net position is the difference between short and long positions of non-commercial traders.
Elliott wave analysis of EUR/JPY for November 12, 2020 2020-11-12 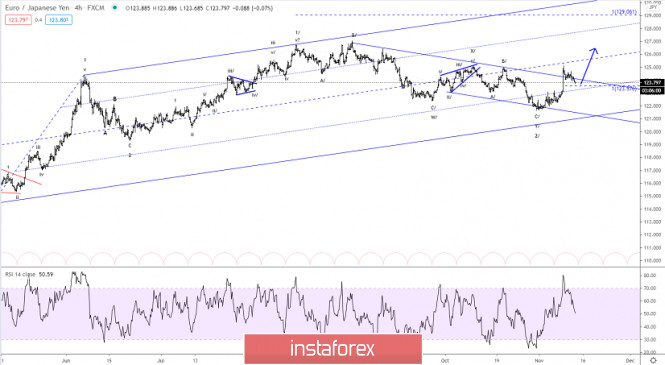
EUR/JPY is expected to hit the corrective target at 123.56 before moving higher again towards the next upside target at 127.02 and likely closer to 129.38. In the short-term, a break above minor resistance at 124.29 will confirm that the ongoing correction from 125.13 has completed and the next impulsive rally is unfolding towards 127.02. It will take an unexpected break below support at 123.25 to question the rally from 121.59 and indicate something much more complex is unfolding. R3: 125.72 R2: 125.00 R1: 124.65 Pivot: 124.13 S1: 123.95 S2: 123.44 S3: 123.23 Trading recommendation: We are long EUR from 122.25 with our stop placed at 123.25 EUR/USD: US dollar will continue to strengthen 2020-11-12 Risky assets remain under pressure due to the COVID-19, since all the rumors that are now taking place around the coronavirus vaccine are more likely on the side of medium-term investors, but does not affect the short-term market, which interests it during the start of the week and then forgot about it. 
Yesterday, we focused our attention on the speech of the ECB's head, Christie Lagarde, which could have supported the euro, but investors ignored Lagarde's statement for some unknown reasons – either they do not strongly believe in the policies of the European Central Bank, or the current coronavirus pandemic forces them to adhere to a more conservative strategy. In any case, Lagarde's statements were ignored, and this raises a lot of questions, since it is not entirely clear how the market will now react to the results of the December meeting of the European regulator. She also reiterated that the main tools to support the European economy are the PEPP and TLTRO programs. Speaking at the annual ECB forum, which is directly dedicated to monetary policy, Lagarde noted that the existing PEPP and TLTRO programs have already proved their effectiveness in the current conditions and there is no point in talking about introducing new changes yet. At the same time, she also pointed to the possibility of correcting these programs in the direction of expansion and increase, if necessary. However, no one has doubted this direction for a long time, especially given the current situation with the COVID-19 in the Eurozone countries. It is another matter whether the ECB will resort to negative interest rates, which Lagarde spoke about so often in the early autumn of this year. After instructing European banks to provide their views and reports on how a negative key interest rate would affect their profitability, Christine Lagarde's statements on this topic was practically forgotten. Does this mean that the ECB is clearly dissatisfied with the reports and the information that has been received, which makes them doubt the right choice of strategy for the next year? It was pointed out in recent reviews that after the news of the third successful trial of the COVID-19 vaccine, the ECB may take advantage of this by adjusting its statements. The result happened quickly. Yesterday, Christine Lagarde said that the news of a possible vaccine seemed encouraging, but added that the economy was still facing an increase in virus infections and tightening of restrictive measures. There was also news yesterday that even before the release of the COVID-19 vaccine produced by Pfizer and BioNTech, the European Commission concluded deals to supply 300 million doses to the countries of the eurozone, while Great Britain will buy another 40 million. 
It was noted above that the market did not react much to this news, which, on the other hand, plays into the hands of the ECB, which fears a higher euro exchange rate more than negative interest rates. Another point that could put pressure on the US dollar was yesterday's news that the Democrats, although they won a majority in the House of Representatives, turned out to be much less than expected. The Democrats failed to win the Senate. As a result of the election, the Republicans successfully defended their seats, gaining 49 seats against 48 for the Democrats. The second round of elections to both houses of Congress will be held in January this year. Technically, the further direction of the EUR/USD pair depends on the support level at 1.1745, which buyers managed to protect during the first wave of testing. It is possible that the weak fundamental statistics, which is expected today on the eurozone economy, will increase the pressure on the euro. Now, if the level of 1,1745 breaks down, it will lead to a new wave of sell-off of risky assets with an exit to the base of the 17th figure and an update to the low of 1.1655. It will be possible for the euro to continue to rise after consolidating above the resistance located at 1.1800, which will lead to upward correction in the area of 1.1860. A further goal will be the weekly resistance located at 1.1915. Technical Analysis of GBP/USD for November 12, 2020 2020-11-12 Technical Market Outlook: After the GBP/USD pair has extended the rally towards the level of 1.3273, which is a 127% Fibonacci extension of the last wave up, the rally was capped, because a Pin Bar and then a Shooting Star candlestick were made at its top. Moreover, the market has hit the technical resistance located at the level of 1.3282, so some kind of pull-back should be expected. Currently, the price is testing the nearest technical support at the level of 1.3182. The next technical support is seen at the level of 1.3169 and 1.3121. Please notice, the market is coming off the overbought conditions, which supports the short-term bearish outlook. Weekly Pivot Points: WR3 - 1.3631 WR2 - 1.3400 WR1 - 1.3312 Weekly Pivot - 1.3083 WS1 - 1.2991 WS2 - 1.2762 WS3 - 1.2666 Trading Recommendations: The GBP/USD pair is in the down trend on the monthly time frame, but the recent bounce from the low at 1.1411 made in the middle of March 2020 looks very strong and might be a reversal swing. In order to confirm the trend change, the bulls have to break through the technical resistance seen at the level of 1.3518. All the local corrections should be used to enter a buy orders as long as the level of 1.2674 is not broken. 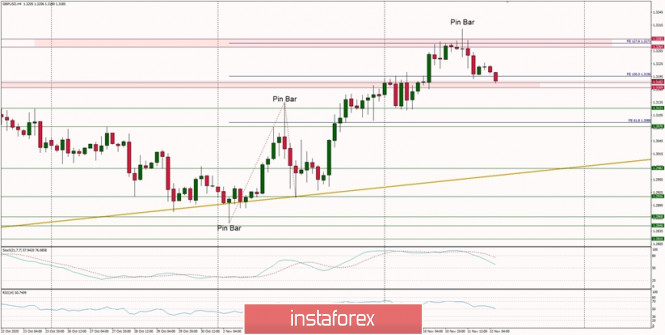
Elliott wave analysis of GBP/JPY for November 12, 2020 2020-11-12 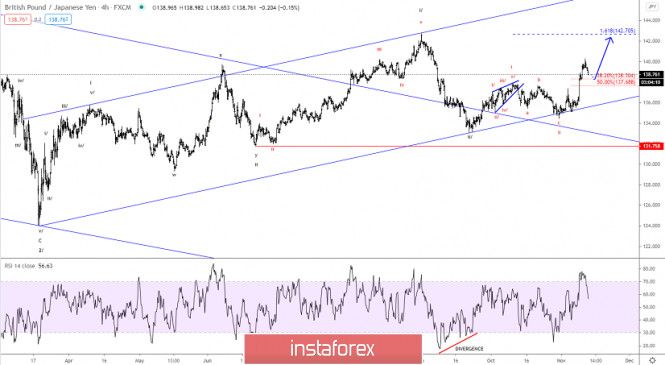
GBP/JPY is currently a minor correction that most likely will lead to support in the 138.16 - 138.30 area for the next impulsive rally higher to the former peak at 142.72 and ultimately a break above here is expected too. If, however, support at 138.16 is broken, we see back-up support at 137.69 that should halt the correction from 140.32 and turn prices higher again through minor resistance at 139.43 for the rally higher towards 142.72. R3: 139.72 R2: 139.47 R1: 139.02 Pivot: 138.97 S1: 138.55 S2: 138.30 S3: 138.16 Trading recommendation: We are long GBP from 135.45 with our stop placed at 137.45 Technical Analysis of EUR/USD for November 12, 2020 2020-11-12 Technical Market Outlook: The EUR/USD pair has been seen continuing the wave down that has recently hit the 50% Fibonacci retracement of the last wave up located at the level of 1.1761. Moreover, the market keeps trading below the orange trend line, so the bearish pressure is stronger. The next target for bears is seen at the level of 61% Fibonacci retracement seen at 1.1732. The nearest technical resistance is located at 1.1789 and will act as a intraday level. The weak and negative momentum supports the short-term bearish outlook. Weekly Pivot Points: WR3 - 1.2308 WR2 - 1.2092 WR1 - 1.2015 Weekly Pivot - 1.1812 WS1 - 1.1717 WS2 - 1.1522 WS3 - 1.1441 Trading Recommendations: Since the middle of March 2020 the main trend is on EUR/USD pair has been up, which can be confirmed by almost 10 weekly up candles on the weekly time frame chart and 4 monthly up candles on the monthly time frame chart. The recent correction towards the level of 1.1612 seems to be completed and now market is ready for another wave up. This means any local corrections should be used to buy the dips until the key technical support is broken. The key long-term technical support is seen at the level of 1.1445. The key long-term technical resistance is seen at the level of 1.2555. 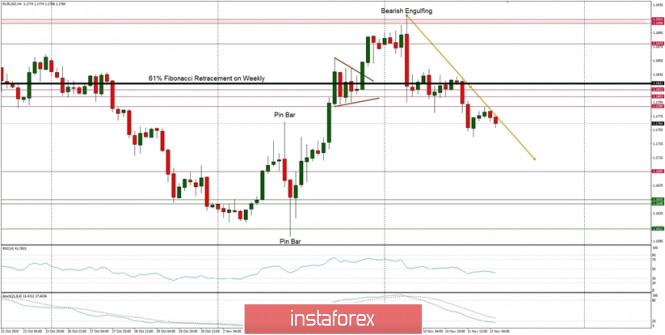
Forex forecast 11/12/2020 on EUR/GBP, GOLD and SP500 from Sebastian Seliga 2020-11-12 Let's take a look at the EUR/GBP, SP500 and Gold technical picture at the daily time frame chart.
Author's today's articles: Sergey Belyaev  Born December 1, 1955. In 1993 graduated from Air Force Engineering Academy. In September 1999 started to study Forex markets. Since 2002 has been reading lectures on the technical analysis . Is fond of research work. Created a personal trading system based on the indicator analysis. Authored the book on technical analysis "Calculation of the next candlestick". At present the next book is being prepared for publishing "Indicator Analysis of Forex Market. Trading System Encyclopedia". Has created eleven courses on indicator analysis. Uses classical indicators. Works as a public lecturer. Held numerous seminars and workshops presented at international exhibitions of financial markets industry. Is known as one of the best specialists in the Russian Federation researching indicator analysis. Born December 1, 1955. In 1993 graduated from Air Force Engineering Academy. In September 1999 started to study Forex markets. Since 2002 has been reading lectures on the technical analysis . Is fond of research work. Created a personal trading system based on the indicator analysis. Authored the book on technical analysis "Calculation of the next candlestick". At present the next book is being prepared for publishing "Indicator Analysis of Forex Market. Trading System Encyclopedia". Has created eleven courses on indicator analysis. Uses classical indicators. Works as a public lecturer. Held numerous seminars and workshops presented at international exhibitions of financial markets industry. Is known as one of the best specialists in the Russian Federation researching indicator analysis. Alexandr Davidov  No data No data Maxim Magdalinin  In 2005 graduated from the Academy of the Ministry of Internal Affairs of the Republic of Belarus, law faculty. Worked as a lawyer for three years in one of the biggest country's company. Besides the trading, he develops trading systems, writes articles and analytical reviews. Works at stock and commodity markets explorations. On Forex since 2006. In 2005 graduated from the Academy of the Ministry of Internal Affairs of the Republic of Belarus, law faculty. Worked as a lawyer for three years in one of the biggest country's company. Besides the trading, he develops trading systems, writes articles and analytical reviews. Works at stock and commodity markets explorations. On Forex since 2006. Torben Melsted  Born in November 1962. Graduated from CBS, got Diploma in Finance. Began trading on Forex in 1986 and since that time held various positions such as advising clients, hedging client flows on FX and commodity markets. Also worked for major corporations as Financial Risk Manager. Uses Elliott wave analysis in combination with classic technical analysis, and has been using a Calmar Ratio of 5.0 for over 3 years. Has his own blog, where he uses Elliott wave and technical analysis on all financial markets. Born in November 1962. Graduated from CBS, got Diploma in Finance. Began trading on Forex in 1986 and since that time held various positions such as advising clients, hedging client flows on FX and commodity markets. Also worked for major corporations as Financial Risk Manager. Uses Elliott wave analysis in combination with classic technical analysis, and has been using a Calmar Ratio of 5.0 for over 3 years. Has his own blog, where he uses Elliott wave and technical analysis on all financial markets. Pavel Vlasov  No data No data Sebastian Seliga  Sebastian Seliga was born on 13th Oсtober 1978 in Poland. He graduated in 2005 with MA in Social Psychology. He has worked for leading financial companies in Poland where he actively traded on NYSE, AMEX and NASDAQ exchanges. Sebastian started Forex trading in 2009 and mastered Elliott Wave Principle approach to the markets by developing and implementing his own trading strategies of Forex analysis. Since 2012, he has been writing analitical reviews based on EWP for blogs and for Forex websites and forums. He has developed several on-line projects devoted to Forex trading and investments. He is interested in slow cooking, stand-up comedy, guitar playing, reading and swimming. "Every battle is won before it is ever fought", Sun Tzu Sebastian Seliga was born on 13th Oсtober 1978 in Poland. He graduated in 2005 with MA in Social Psychology. He has worked for leading financial companies in Poland where he actively traded on NYSE, AMEX and NASDAQ exchanges. Sebastian started Forex trading in 2009 and mastered Elliott Wave Principle approach to the markets by developing and implementing his own trading strategies of Forex analysis. Since 2012, he has been writing analitical reviews based on EWP for blogs and for Forex websites and forums. He has developed several on-line projects devoted to Forex trading and investments. He is interested in slow cooking, stand-up comedy, guitar playing, reading and swimming. "Every battle is won before it is ever fought", Sun Tzu
Subscription's options management Theme's:
Fundamental analysis, Fractal analysis, Wave analysis, Technical analysis, Stock Markets
Author's :
A Zotova, Aleksey Almazov, Alexander Dneprovskiy, Alexandr Davidov, Alexandros Yfantis, Andrey Shevchenko, Arief Makmur, Dean Leo, Evgeny Klimov, Fedor Pavlov, Grigory Sokolov, I Belozerov, Igor Kovalyov, Irina Manzenko, Ivan Aleksandrov, l Kolesnikova, Maxim Magdalinin, Mihail Makarov, Mohamed Samy, Mourad El Keddani, Oleg Khmelevskiy, Oscar Ton, Pavel Vlasov, Petar Jacimovic, R Agafonov, S Doronina, Sebastian Seliga, Sergey Belyaev, Sergey Mityukov, Stanislav Polyanskiy, T Strelkova, Torben Melsted, V Isakov, Viktor Vasilevsky, Vladislav Tukhmenev, Vyacheslav Ognev, Yuriy Zaycev, Zhizhko Nadezhda
Edit data of subscription settings
Unsubscribe from the mailing list Sincerely,
Analysts Service | If you have any questions, you can make a phone call using one of the
InstaForex Toll free numbers right now:
|  | InstaForex Group is an international brand providing online trading services to the clients all over the world. InstaForex Group members include regulated companies in Europe, Russia and British Virgin Islands. This letter may contain personal information for access to your InstaForex trading account, so for the purpose of safety it is recommended to delete this data from the history. If you have received this letter by mistake, please contact InstaForex Customer Relations Department. |


No comments:
Post a Comment