| AUD/USD. "Beware of inflation," tomorrow's release may trigger price turbulence 2020-10-27 The Australian dollar paired with the US currency has been trading in a fairly narrow price range since last Thursday. The Aussie is not leaving the 50-point corridor, which is limited to 0.7100-0.7150. Bears avoid entering the 70th figure (and even more so to test the key support level of 0.7000), while buyers fail to develop a northern offensive, due to numerous fundamental factors of a negative nature. At the same time, the pair is dominated by bearish sentiment—at least because of the "dovish" intentions of the Reserve Bank of Australia, which is likely to lower the interest rate at the November meeting. But the very fact of monetary policy easing, AUD/USD traders have already won back, falling by 250 points – from 0.7245 to the base of the 70th figure. After the correction, the pair floated within the above-mentioned price range, waiting for the next information driver. This driver may be tomorrow's release on the growth of Australian inflation. Recall that, earlier this month, the head of the RBA stated that the interest rate could be reduced by 15 basis points. However, according to the RBA meeting minutes that was published last week, members of the regulator allow the option of reducing the interest rate by 25 points, that is, to zero, while increasing the volume of bonds being bought. 
To put it simply, the very fact of a rate cut has already been factored into prices, but the open question is exactly how much the RBA will cut it. In this context, tomorrow's inflation data may cause increased volatility, especially if they are in the "red zone." In the run-up to the release, it is also worth recalling another important point made at the October meeting. The members of the regulator have now decided to pay more attention to actual, rather than projected, inflation when making decisions. At the last meeting, the Australian Central Bank operated with very outdated data for the second quarter, which updated the multi-month anti-records. Thus, the consumer price index in quarterly terms for the first time since the spring of 2016 collapsed into a negative area, not to the forecast -2%, but to -1.9%. In annual terms, the indicator was also below zero: the indicator came out at -0.3%. Since inflation in Australia remains a "weak link," the above thesis, voiced at the October meeting, is of particular importance for AUD/USD traders. And if tomorrow's release also turns out to be worse than expected, the bears of the pair will get a reason for a southern breakout. Despite this, most experts are optimistic. According to preliminary forecasts, the overall consumer price index in the third quarter should come out of the negative area—both on an annual and quarterly basis. It is expected that the indicator will grow to 0.7% in annual terms, and to 1.5% in quarterly terms. According to the RBA (using the truncated average method), the core inflation index should also show positive dynamics, reflecting the recovery processes. If the above figures come out in the "red zone," the market is likely to resume talks that the Australian regulator may resort to a more extensive easing of monetary policy parameters. The current correction of the AUD/USD pair is becasue of two factors. First, no new cases of coronavirus have been detected in the Australian 5-million-strong metropolis of Melbourne. Because of this fact, curfews are being lifted and quarantine restrictions are almost completely relaxed. Starting today, all shops, restaurants, cafes, and bars in the country's second most populous city will be able to work again. Furthermore, the Australian dollar was supported today by Reserve Bank of Australia representative Guy Debelle, who spoke in the country's Parliament during the Asian session on Tuesday. He was surprisingly optimistic about the prospects for the Australian economy to recover in the third quarter. Debelle said that reducing the unemployment rate below the 6 percent mark is a "reasonable goal" that is quite achievable in the foreseeable future. In spite of the fact that his phrases were general, he was able to provide little support for the Australian dollar. The representative did not talk about the RBA's plans to ease monetary policy. According to him, this issue will be discussed at the November meeting, ergo making any announcements in this context is incorrect. 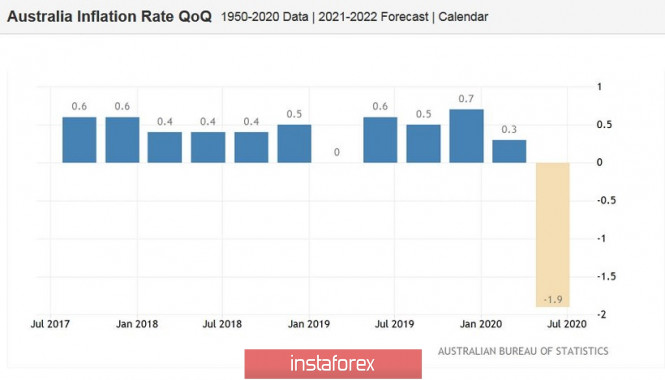
Thus, the Australian dollar is showing a correction quite justifiably. However, in such cases. it is not advisable to enter purchases of AUD/USD. In my opinion, trading decisions should be made based on the results of tomorrow's release, as inflationary indicators will provoke quite strong volatility. Moreover, it is difficult to predict the price movement vector at the moment, considering the rather optimistic forecasts. Inflated market expectations are a "time bomb." If the real numbers do not meet expectations, the pair will be within the 70th figure again. Technically, there is also no certainty in regard to this matter. On the daily chart, the AUD/USD pair is located on the middle line of the Bollinger Bands indicator, between the Tenkan-sen and Kijun-sen lines, and under the Kumo cloud. The nearest support level is 0.7050, which is the lower BB line on the same timeframe. The key support level is still 0.7000. Elliott wave analysis of EUR/JPY for October 27, 2020 2020-10-27 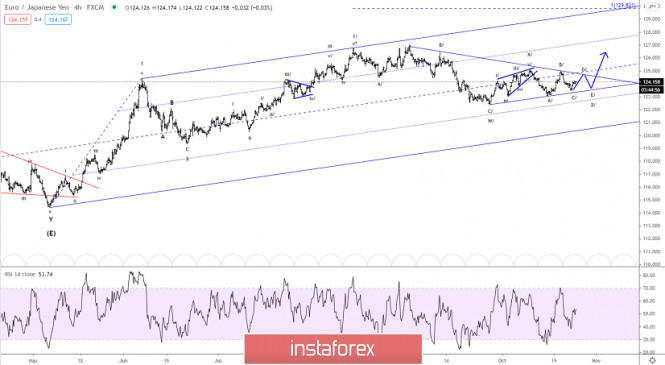
We continue to track the triangle consolidation in wave Y/ of 2/. Within the triangle we have seen wave A/, B/ and C and is currently tracing out wave D/ towards the 124.65 - 124.75 area from where the final E/ is expected to take over for a dip close to 123.75. This should complete the complex wave 2/ correction from 127.08 and set the stage for a new impulsive rally in wave 3/ towards at least 129.82. Ideally support at 123.66 will be able to protect the donwisde for a break above minor resistance at 124.15 indicating the next rally higher to the 124.64 - 124.75 area to complete wave D/. R3: 124.65 R2: 124.38 R1: 124.14 Pivot: 124.00 S1: 123.85 S2: 123.66 S3: 123.60 Trading recommendation: We are long EUR from 123.55 with our stop placed at 123.35. We will take 50% at 124.55. Elliott wave analysis of GBP/JPY for October 27, 2020 2020-10-27 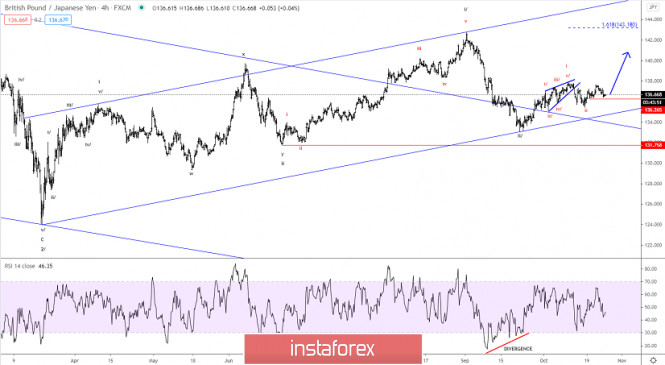
We continue to look for short-term key-support at 136.26 to be able to protect the downside for a new impulsive rally higher towards 137.67 and ultimately higher to and above the former peak at 142.72. That said, we have to be aware, that an unexpected break below 136.26 will delay the expected upside pressure and call for a new dip closer to 135.33 and possibly even closer to 135.03 before the next wave higher can begin. R3: 137.32 R2: 137.04 R1: 136.74 Pivot: 136.80 S1: 136.26 S2: 136.04 S3: 135.58 Trading recommendation: We are long GBP from 135.55 with our stop + revers placed at 136.20 Analytics and trading signals for beginners. How to trade EUR/USD on October 27? Plan for opening and closing trades on Tuesday 2020-10-27 Hourly chart of the EUR/USD pair 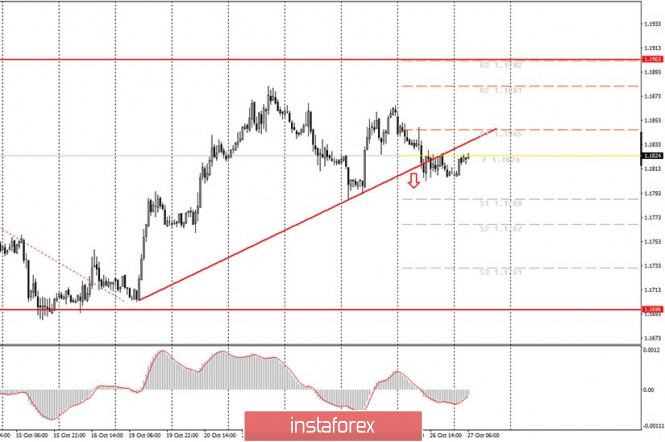 The EUR/USD pair tried to start an upward correction several times after the rising trend line was broken last Monday night. Recall that yesterday evening we warned traders that it is risky to open short positions right away and it is better to wait for the upward correction and discharge of the MACD indicator. The downward movement did not continue last night, and the correction did not start. Thus, the situation is becoming more and more ambiguous day by day. On the one hand, the price crossed the upward trend line twice, so the pair should start forming a downward trend inside the horizontal channel of $1.17-1.19. On the other hand, the pair can neither correct nor continue falling. The MACD indicator managed to slightly discharge to the zero mark, so when new sell signals are formed, they can still be worked out. But take note that the pair is unlikely to fall below the 1.1696 level. And, of course, the fundamental background... The fundamental background for the EUR/USD pair remains the same and does not change. What does this mean? This means that the background that brought the pair to the current levels from $1.07-1.08 is still present. That is why the US dollar cannot even correct normally and will settle below 1.1700. Traders are simply afraid to make strong purchases of the US currency, since there is no reason for this. However, it is difficult for the euro to grow further, as it has risen in price by more than 10 cents over the past six months. Thus, a stalemate has developed, from which the quotes have not been able to get out for three months. Well, market participants should only continue to trade within the horizontal channel and in parallel wait for the flat to end (in the long term). Perhaps this problem will be resolved as early as next Tuesday, when Election Day is held in America. Perhaps a little later, when the votes are counted. Perhaps even later, when the election results become known. One way or another, some kind of factor is necessary for force traders to withdraw the pair from the annoying 1.17-1.19 channel. The US is set to release one macroeconomic report today, which theoretically could have an impact on the pair's movement. Durable goods orders are considered a fairly important report. However, last month the real values of four of its indicators turned out to be extremely boring and neutral, fixing minimal changes. The same can be true today. Forecasts for four indicators (general indicator, indicator excluding defense and aviation orders, indicator excluding defense and indicator excluding transport) expect growth by 0.7%. Therefore, if these forecasts are greatly exceeded, the US dollar will have the opportunity to go back to rising (= fall of the euro/dollar pair). And vice versa. Possible scenarios for October 27: 1) Buy positions on the EUR/USD pair are no longer relevant at the moment, since the upward trend line did not resist the onslaught of bears. Therefore, in the near future the pair should continue to move down, and you can only consider long deals after a new upward trend or an eloquent cancellation of the downward trend has occurred. 2) Trading for a fall at this time has become relevant, since the price has not stayed above the trend line. Novice traders are advised to wait until the correction has been completed, afterwards you can open short positions while aiming for 1.1788 and 1.1767 on the MACD sell signal. If this signal is quickly canceled and the downward movement does not continue, you are advised to leave the market until the next recommendations. On the chart: Support and Resistance Levels are the Levels that serve as targets when buying or selling the pair. You can place Take Profit near these levels. Red lines are the channels or trend lines that display the current trend and show in which direction it is better to trade now. Up/down arrows show where you should sell or buy after reaching or breaking through particular levels. The MACD indicator (14,22,3) consists of a histogram and a signal line. When they cross, this is a signal to enter the market. It is recommended to use this indicator in combination with trend lines (channels and trend lines). Important announcements and economic reports that you can always find in the news calendar can seriously influence the trajectory of a currency pair. Therefore, at the time of their release, we recommended trading as carefully as possible or exit the market in order to avoid a sharp price reversal. Beginners on Forex should remember that not every single trade has to be profitable. The development of a clear strategy and money management are the key to success in trading over a long period of time. Brief trading recommendations for GBP/USD on 10/27/20 2020-10-27 
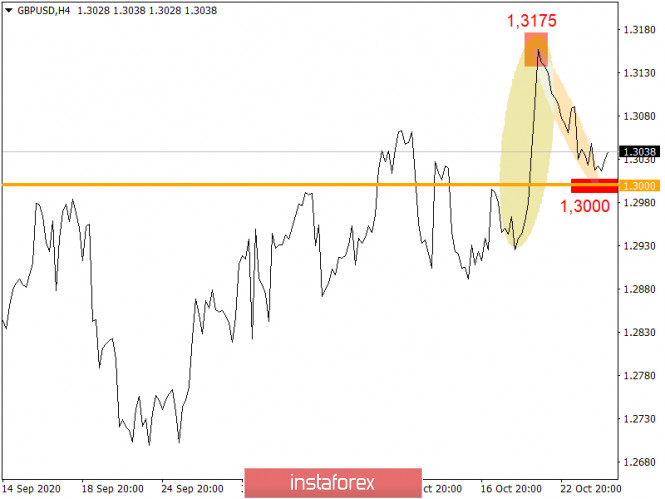
The GBP/USD pair managed to approach the psychological level of 1.3000 yesterday, where there was a regular stop and, as a result, the price rebounded in the opposite direction. The psychological level is a price level that ends at zero or several zeros. For example, if we are talking about the pound/dollar currency pair, then round levels are considered to be: 1.3100; 1.3000; 1.0000. Traders pay more attention to the level with more zeros at the end of the quote. This, in turn, leads to a natural basis in the form of a stop, pullback, or correction. In our case, the psychological level of 1.3000 acted as a support, stopping the pound to decline. Regarding the quote's current location, you can see that although sellers have lowered the volume of sell positions, they are still available on the market; otherwise, the quote was not near the level of 1.3000. We can assume that the risk of next rebounds from the level of 1.3000 will remain in the market, which will cause the volume of short positions to decline, as long as the quote does not consolidate below 1.2990 in the H4 time frame. A price consolidation below 1.2990 level activates sellers to take action, which will lead to an increase in the volume of positions and movement along a downward course. Trading forecasts can be made based on the above information: - Buy deals can be considered if the price is kept above the level of 1.3000, with the prospect of moving to 1.3065.
- Sell deals are considered below the level of 1.2990, with the prospect of moving to 1.2920-1.2870.
EUR/USD: plan for the European session on October 27. COT reports. Euro under pressure amid rising coronavirus infections 2020-10-27 To open long positions on EUR/USD, you need: In my forecast for the afternoon, I paid attention to the signal for opening short positions in the EUR/USD pair. If you read my review and look at the 5-minute chart, you will see how the bears defended the 1.1826 resistance, which resulted in a good sell entry point. They did the same in the middle of the US session, which caused it to fall by another 20 points. 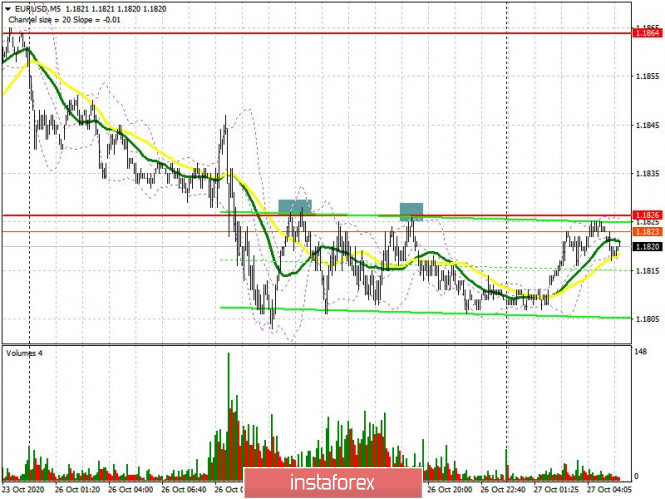 The buyers' primary task for the first half of the day is to regain control over the resistance at 1.1826. Settling at this level and testing it from top to bottom forms a good signal to open long positions, counting on the upward trend to continue, which happened last week. The bulls aim to return to the high of 1.1864, where I recommend taking profits, since this level is the upper border of the horizontal channel and it will not be so easy to pass it from the first test. But even if the euro continues to fall, it is too early to panic, since the pair could remain in a horizontal channel with the lower border at 1.1788. However, I recommend opening long positions from this area only if a false breakout is formed. It is possible to buy EUR/USD immediately on a rebound but only from a low of 1.1762, counting on a correction of 15-20 points within the day. The Commitment of Traders (COT) report for October 20 recorded an increase in long positions and short ones. However, there were more of the latter, which led to an even greater decrease in the positive delta. Despite this, the buyers of risky assets believe in the continuation of the bull market, but prefer to act with caution, as there is no good news for the eurozone yet. Thus, long non-commercial positions increased from 228,295 to 229,878, while short non-commercial positions increased from 59,658 to 63,935. The total non-commercial net position decreased to 165,943, against 168,637 a week earlier.... However, the bullish sentiment for the euro remains rather high in the medium term. The more the euro falls against the US dollar at the end of this year, the more attractive it is for new investors. To open short positions on EUR/USD, you need: The sellers are doing their job so far and are not letting the pair go above the 1.1826 level, which acts as a resistance. We can expect the euro to succeedingly fall as long as trading is carried out below this range. Forming a false breakout at 1.1826 after the release of weak fundamental data on lending in the eurozone will be another signal to open short positions, as, apparently, the bullish momentum will gradually end against the background of an increase in the number of Covid-19 infections in the world. The EUR/USD bears will aim to return to support at 1.1788, settling below it will only increase the pressure on the pair, which will lead to updating the next low at 1.1761, where I recommend taking profits. If the EUR/USD grows above 1.1826 and there is no activity among sellers at this level, it is best not to rush to open short positions, but wait until the upper border of the 1.1864 horizontal channel is updated and sell the euro there for a rebound, counting on a 15-20 point correction. 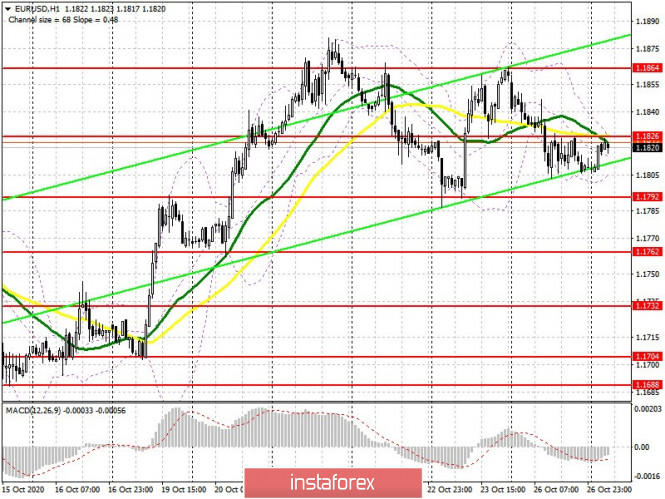 Indicator signals: Moving averages Trading is carried out in the area of 30 and 50 moving averages, which shows that the pair is still in a horizontal channel. Note: The period and prices of moving averages are considered by the author on the H1 hourly chart and differs from the general definition of the classic daily moving averages on the daily D1 chart. Bollinger Bands A breakout of the upper border of the indicator around 1.1826 will lead to a new wave of euro growth. A breakout of the lower border of the indicator in the 1.1800 area will increase the pressure on the pair. Description of indicators - Moving average (moving average, determines the current trend by smoothing out volatility and noise). Period 50. It is marked in yellow on the chart.
- Moving average (moving average, determines the current trend by smoothing out volatility and noise). Period 30. It is marked in green on the chart.
- MACD indicator (Moving Average Convergence/Divergence — convergence/divergence of moving averages) Quick EMA period 12. Slow EMA period to 26. SMA period 9
- Bollinger Bands (Bollinger Bands). Period 20
- Non-commercial speculative traders, such as individual traders, hedge funds, and large institutions that use the futures market for speculative purposes and meet certain requirements.
- Long non-commercial positions represent the total long open position of non-commercial traders.
- Short non-commercial positions represent the total short open position of non-commercial traders.
- Total non-commercial net position is the difference between short and long positions of non-commercial traders.
Trading plan for the EUR/USD pair on October 27. Continued attack of COVID-19 in Europe. 2020-10-27 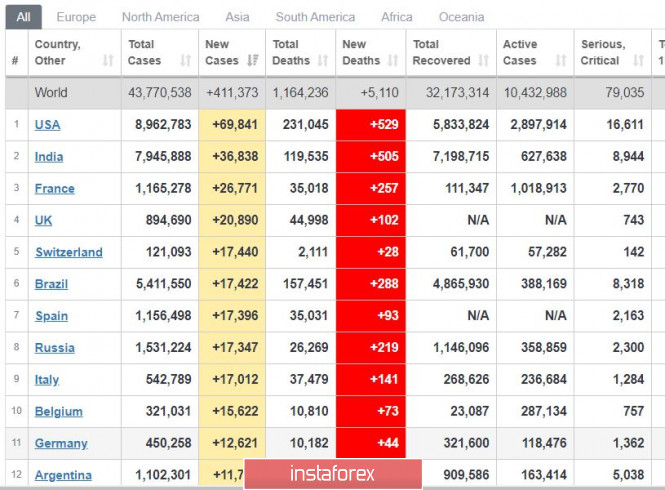
The situation remains bad in Europe, especially in France, whose daily incidence reached 27 thousand. As a result, the government is forced to impose curfew in order to control the spread of the virus. Meanwhile, in Switzerland, cases are rising at an alarming rate, already reaching 17 thousand new infections a day. To add to that, the authorities have reported that hospitals were now experiencing difficulties due to the lack of space. Nonetheless, despite this grave situation, the euro bulls are trying to keep the currency's growth: 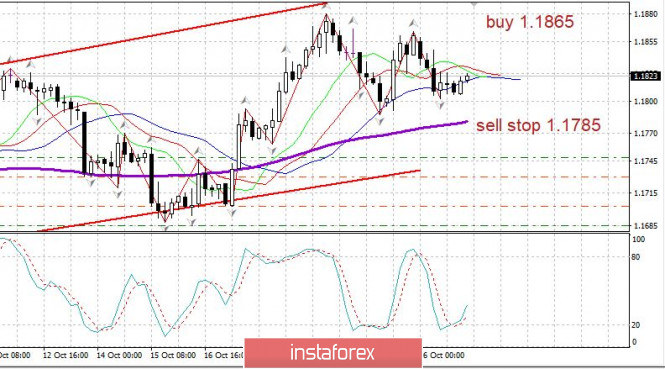
EUR/USD: Set up long positions after a breakout from 1.1865. Place stop loss at 1.1770 Open short positions from 1.1785 GBP/USD: plan for the European session on October 27. COT reports. High volatility to continue for the pound 2020-10-27 To open long positions on GBP/USD, you need: In yesterday's afternoon review, I drew attention to the struggle for the 1.3052 level and recommended to act from it. It was not possible to wait for a buy signal, because after the breakout of 1.3052, the bulls failed to protect this level, allowing the pair to return to the area below this range. But testing 1.3052 from the bottom up formed a good entry point into short positions, afterwards the pound retreated by more than 50 points. 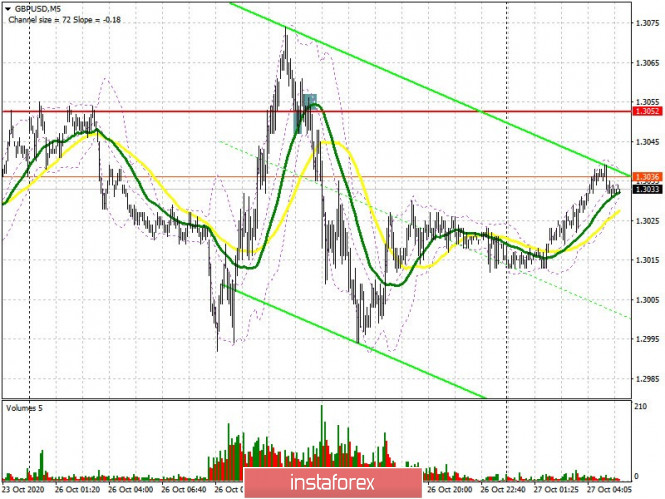 The situation is quite delicate at the moment, since it is not very clear whether the parties will be able to agree in the next few days or not. Any insider information will lead to a sharp movement of the pound in one direction or another. Buyers need to protect support at 1.3021, and forming a false breakout on it will be a signal to open long positions with the goal of returning to the area of yesterday's resistance at 1.3072. However, only a breakout and being able to settle at this level will lead to forming a good additional entry point into long positions, and could also lead the pound to highs of 1.3120 and 1.3174, where I recommend taking profits. In case GBP/USD falls below the 1.3021 level, it is best not to rush to buy, but to wait until the 1.2974 low has been updated, where you can open long positions only if a false breakout appears. I recommend buying GBP/USD immediately on a rebound in a large support at 1.2919, counting on a correction of 20-30 points within the day. The Commitment of Traders (COT) report for October 20 showed a reduction in short positions and a sharp increase in long positions. Long non-commercial positions rose from 36,195 to 39,836. At the same time, short non-commercial positions fell from 45,997 to 41,836. As a result, the negative value of the non-commercial net position slightly increased and reached -2,000, against - 9,802 a week earlier, which indicates that the sellers of the pound retain control and also shows their minimal advantage in the current situation. To open short positions on GBP/USD, you need: Sellers of the pound will focus on the breakout and settle below the intermediate support at 1.3021, as only this can increase the pressure on the pair and push it even lower to the 1.2974 level, where I recommend taking profits. A stronger bearish momentum will only emerge if disagreements persist in the UK-EU trade deal. Going beyond and settling below 1.2974 forms a good entry point for short positions in anticipation of updating the lows of 1.2919 and 1.2865, where I recommend taking profits. If the demand for the pound persists in the morning, then I do not recommend rushing with sell positions. It is best to open short positions from the resistance of 1.3072, subject to forming a false breakout there, or sell GBP/USD immediately after a rebound from the 1.3120 high, counting on a correction of 20-30 points within the day. 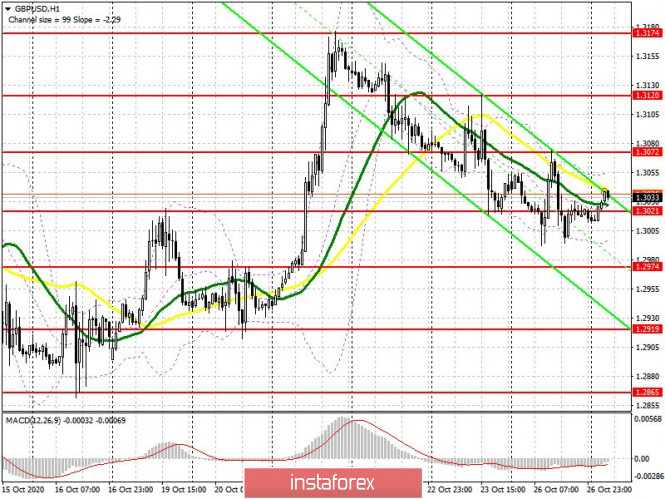 Indicator signals: Moving averages Trading is carried out in the area of 30 and 50 moving averages, which indicates some market uncertainty. Note: The period and prices of moving averages are considered by the author on the H1 hourly chart and differs from the general definition of the classic daily moving averages on the daily D1 chart. Bollinger Bands A breakout of the upper border of the indicator in the area of 1.3055 will lead to a new wave of growth of the pound. A breakout of the lower boundary at 1.3005 will increase pressure on the pair. Description of indicators - Moving average (moving average, determines the current trend by smoothing out volatility and noise). Period 50. It is marked in yellow on the chart.
- Moving average (moving average, determines the current trend by smoothing out volatility and noise). Period 30. It is marked in green on the chart.
- MACD indicator (Moving Average Convergence/Divergence — convergence/divergence of moving averages) Quick EMA period 12. Slow EMA period to 26. SMA period 9
- Bollinger Bands (Bollinger Bands). Period 20
- Non-commercial speculative traders, such as individual traders, hedge funds, and large institutions that use the futures market for speculative purposes and meet certain requirements.
- Long non-commercial positions represent the total long open position of non-commercial traders.
- Short non-commercial positions represent the total short open position of non-commercial traders.
- Total non-commercial net position is the difference between short and long positions of non-commercial traders.
Indicator analysis. Daily review on EUR/USD for October 27, 2020 2020-10-27 Trend Analysis (Figure 1) Today, the market may begin moving up from the level of 1.1808 (closing of yesterday's daily candle) with the goal of 1.1853, which is a pullback level of 61.8% (blue dotted line). Upon testing this level, the price will further work up, with the goal of 1.1876 - the resistance line (blue dotted line). 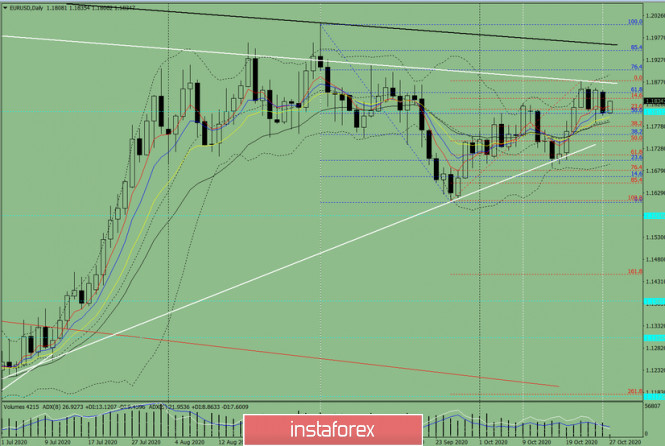
Figure 1 (Daily chart) Comprehensive analysis: - Indicator analysis - up
- Fibonacci levels - up
- Volumes - up
- Candlestick analysis - up
- Trend analysis - up
- Bollinger Bands - up
- Weekly chart - down
General conclusion: Today, the price from the level of 1.1808 (closing of yesterday's daily candle) may continue to move up with the goal of 1.1853, which is a pullback level of 61.8% (blue dotted line). Upon testing this level, the price will further work up, with the goal of 1.1876 - the resistance line (blue dotted line). Unlikely scenario: when working up to reach the pullback level of 61.8%, which is 1.1853 (blue dotted line), work down with the goal of 1.1777, which is a pullback level of 38.2% (red dotted line). Technical Analysis of EUR/USD for October 27, 2020 2020-10-27 Technical Market Outlook: The EUR/USD pair has been trying again to rally towards the level of 1.1880, but still trades below the short-term trend line resistance, just around the 1.1822. This level is a 61% Fibonacci retracement on the weekly tome frame chart as well and had been tested many times during the last month. There might be a Bullsih Flag pattern in progress on H4 time frame. The market is coming off the overbought conditions and the momentum is neutral to positive, so there are still a chance for bulls for another wave up. Only a sustained violation of the level of 1.1761 will trigger more aggressive sell off towards 1.1724 and below. Weekly Pivot Points: WR3 - 1.2123 WR2 - 1.1991 WR1 - 1.1943 Weekly Pivot - 1.1823 WS1 - 1.1766 WS2 - 1.1638 WS3 - 1.1589 Trading Recommendations: Since the middle of March 2020 the main trend is on EUR/USD pair has been up, which can be confirmed by almost 10 weekly up candles on the weekly time frame chart and 4 monthly up candles on the monthly time frame chart. The recent correction towards the level of 1.1612 seems to be completed and now market is ready for another wave up. This means any local corrections should be used to buy the dips until the key technical support is broken. The key long-term technical support is seen at the level of 1.1445. The key long-term technical resistance is seen at the level of 1.2555. 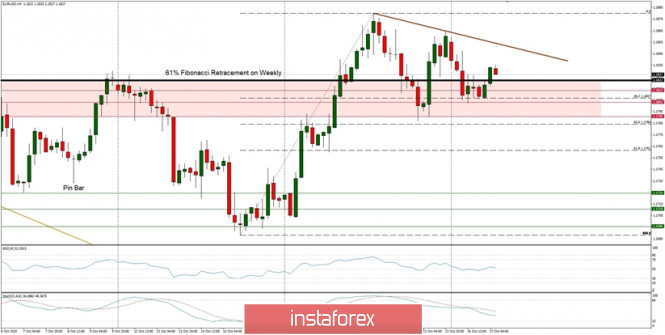
Technical Analysis of GBP/USD for October 27, 2020 2020-10-27 Technical Market Outlook: After the GBP/USD pair had made a swing high at the level of 1.3175, it has been moving lower in a local correction and then started to consolidate in a narrow zone. Recently the price has hit the level of 1.3021 which is a technical support, but it looks like the bears want to push it lower towards the level of 1.3011. This is the 61% Fibonacci retracement and if broken, then the market will slide lower towards the next technical support seen at 1.2982. Please notice, the price is back into the local ascending channel again, so the bears are now in control of the market. Weekly Pivot Points: WR3 - 1.3465 WR2 - 1.3320 WR1 - 1.3185 Weekly Pivot - 1.3039 WS1 - 1.2902 WS2 - 1.2757 WS3 - 1.2620 Trading Recommendations: The GPB/USD pair is in the down trend on the monthly time frame, but the recent bounce from the low at 1.1411 made in the middle of March 2020 loos very strong and might be a reversal swing. In order to confirm the trend change, the bulls have to break through the technical resistance seen at the level of 1.3518. All the local corrections should be used to enter a buy orders as long as the level of 1.2674 is not broken. 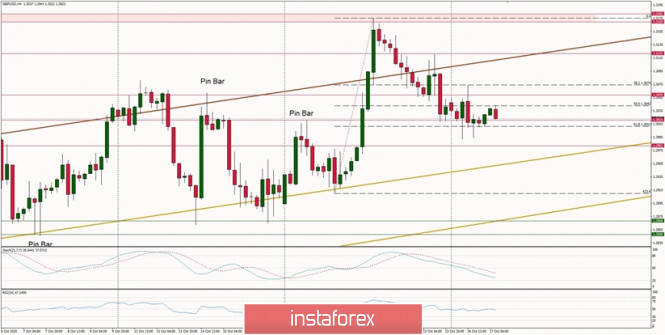
Simplified wave analysis and forecast for GBP/USD, USD/JPY, and USD/CHF on October 27 2020-10-27 GBP/USD Analysis: The direction of movement of the major pound sterling is set by the rising wave from September 10. The price has reached the lower limit of the potential reversal zone. On October 21, a counter wave started, which should correct the previous movement. Forecast: Today, the price is expected to move in the corridor between the nearest counter zones. After an attempt to put pressure on the resistance zone, the price is expected to reverse and move down. Potential reversal zones Resistance: - 1.3040/1.3070 Support: - 1.2940/1.2910 Recommendations: Trading on the pound market today is possible within the intraday. There are no conditions for purchases. It is better to look for sell signals in the resistance zone. It is wiser to reduce the lot. The potential for a downward move is shown by the calculated support. 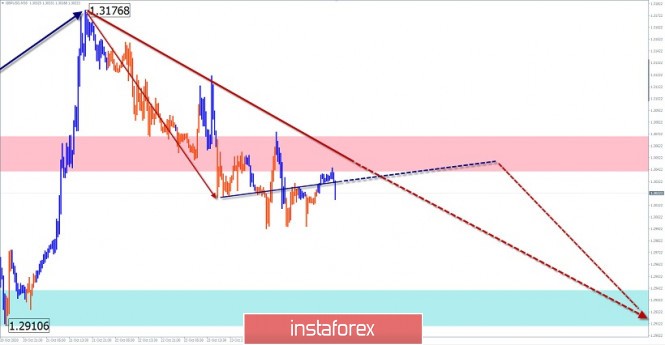
USD/JPY Analysis: In the conditions of a flat on a large TF of the Japanese yen, the short-term direction is set by the bullish wave from September 21. In its structure, the middle part (B) has ended. The price rise that began on October 21 has a reversal potential and forms the beginning of the final part (C). An interim pullback has been forming on the chart since the end of last week. Forecast: In the next 24 hours, the rate decline, a reversal, and the beginning of price growth are expected to end. When changing the direction, a short-term puncture of the lower support border is not excluded. The probability of an upward breakout of the calculated resistance is low today. Potential reversal zones Resistance: - 105.30/105.60 Support: - 104.70/104.40 Recommendations: There are no conditions for selling on the market. In the support area, it is recommended to track the conditions for purchasing the instrument. 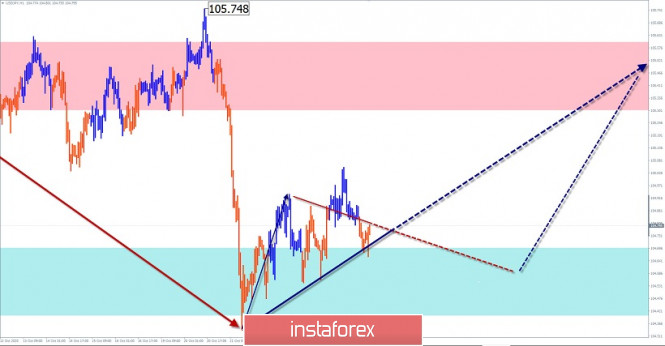
USD/CHF Analysis: The last section on the main trend direction of the Swiss franc has been reporting since September 25. This bearish movement has reached the upper limit of a strong large-scale support zone. Since last week, the price has been rolling up. Forecast: The upward movement is expected to end today. By the end of the day, the exchange rate is likely to change and re-decline to the support area. Potential reversal zones Resistance: - 0.9090/0.9120 Support: - 0.9030/0.9000 Recommendations: The market pairs are possible today in the framework of the sessions of the small lot. The priority is to sell the tool. The downside potential is limited by the support zone. 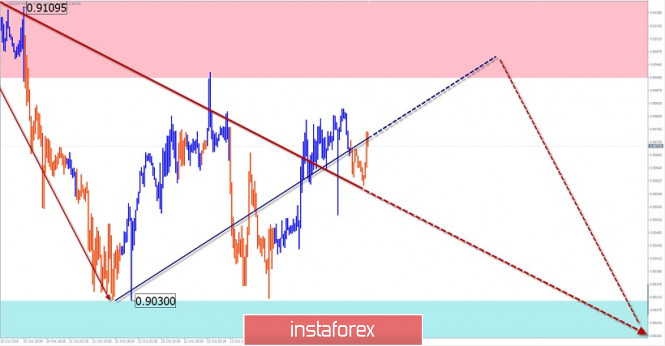
Explanation: In the simplified wave analysis (UVA), waves consist of 3 parts (A-B-C). The last incomplete wave is analyzed. The solid background of the arrows shows the formed structure, and the dotted background shows the expected movements. Note: The wave algorithm does not take into account the duration of the instrument's movements in time! Trading plan for EUR/USD and GBP/USD on 10/27/2020 2020-10-27 Europe is suffering from the spread of COVID-19 once again, which is reflected in the quotes. Thus, investors are very concerned that the country may re-introduce the same restrictive measures that happened last Spring. In France and Spain, the number of confirmed COVID-19 cases has surpassed the one million mark. The Spanish authorities have even proposed to the parliament to extend the recently introduced measures for another six months. At the same time, Italy announced that if the situation does not normalize in the next few days, the country's authorities will be forced to dramatically tighten their restrictive measures. Apparently, France has almost no choice but to follow the path of Spain and Italy. However, what is much worse is the significant growth of cases in Germany, which significantly surpasses everything that was observed in the spring. Therefore, investors really have a reason to fear the re-introduction of quarantine which can lead to the closure of shops, cafes and other institutions. These are enormous losses and it is clear that these businesses, especially small and medium-sized businesses, had no time to recover from the spring losses. Therefore, they may simply not survive the reintroduction of severe restrictions. Since the authorities of various countries are well aware of this, it is what keeps them from imposing strict restrictions, despite the clearly much more difficult condition than in the spring. From the point of view of technical analysis, the pound declined for the euro, since a trade agreement with the European Union is now on the agenda in the UK, so Boris Johnson's government does not make any loud statements regarding the COVID-19 situation. 
At the same time, the US statistics are completely ignored by the investors, which turned out to be not quite as expected. The news itself, which was published yesterday, rather belongs to the category that usually does not interest the markets. We are talking about the sale of new homes in the United States, which declined by the same 3.5%, instead of growing by 3.5%. New Home Sales (United States): 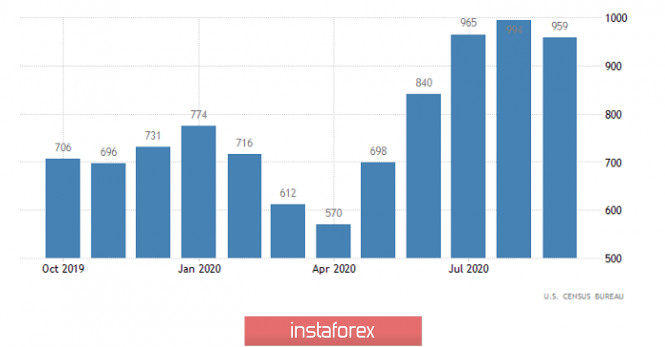
Today, everyone will closely monitor what European countries intend to do in terms of preventing COVID-19 from spreading further, which is definitely putting pressure on the euro. On the other hand, this topic is practically banned in the US until the presidential election takes place, although the country is confidently leading in the number of confirmed cases of coronavirus. If the authorities of European countries are restrained in their statements, then orders for durable goods in the United States will come to the rescue, which may show growth of 0.4%. This indicator is much more important than yesterday's sales of new homes. After all, the growth of orders indicates the growth of industry and retail sales. For them, orders are a leading indicator. Therefore, the US dollar can continue to strengthen today, albeit limited. Durable Goods Orders (United States): 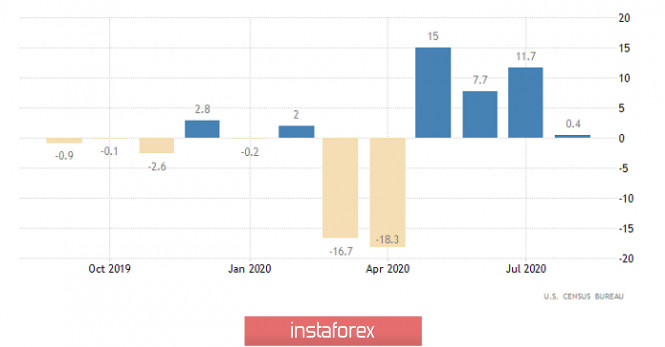
The EUR/USD pair moves in a variable range between the price levels of 1.1810 and 1.1865, consistently working out the set boundaries. We can assume that the given dynamics will still persist in the market, where the main volumes will appear outside the limits. The method of breaking one or another limit of the range is considered to be the best trading tactic. 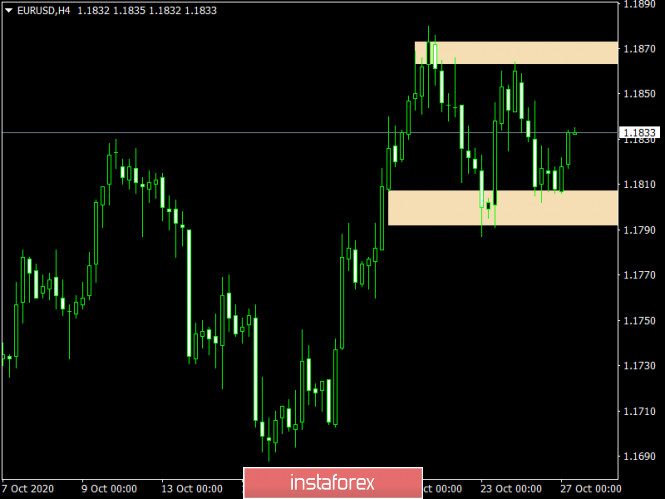
The GBP/USD pair reached the psychological level of 1.3000 again, where the price rebound on a natural basis. We can assume that the risk of a price rebound will remain in the market as long as the quote does not consolidate below 1.2990. The next pivot points for the upcoming decline may become coordinates 1.2930 and 1.2860. 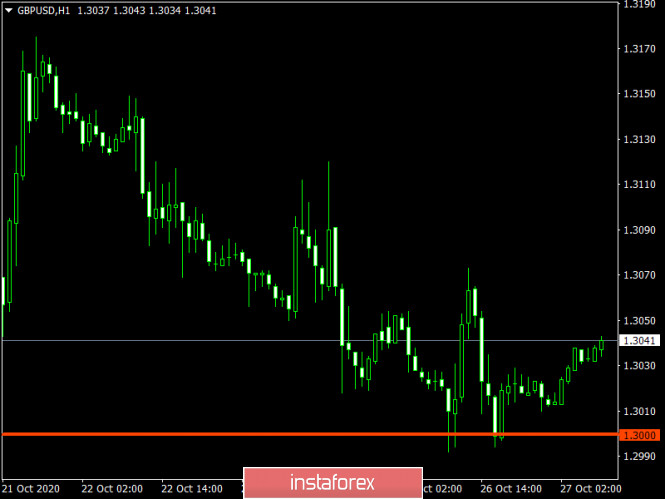
GBP/USD. October 27. COT report. Negotiations continue in London, however, traders are already tired of Brexit topics. They are waiting for concrete and final results 2020-10-27 GBP/USD – 1H. 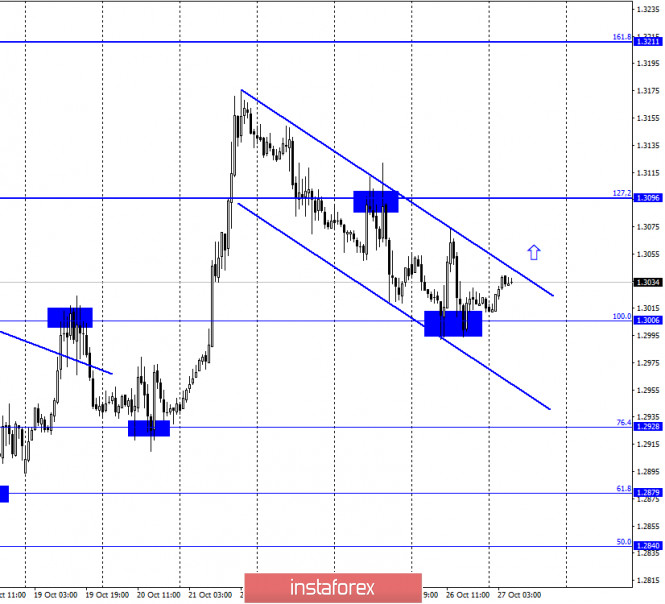
According to the hourly chart, the quotes of the GBP/USD pair fell to the corrective level of 100.0% (1.3006), giving a rebound from this level and began the growth process. However, at the moment, a downward trend corridor has also been built, which characterizes the current mood of traders as "bearish". Closing the pair's rate over this corridor will work in favor of the British dollar and greatly increase its chances of growth in the coming days. At the same time, the growth of the British dollar still looks extremely doubtful. At this time, there is a situation where the information background for the pound is almost unambiguous. There is still no trade deal with the EU, Brexit is inexorably approaching, the problems of the British economy are visible from a distance of 10 kilometers without glasses, and in the last month, the country was also mired in a new outbreak of coronavirus. However, traders are now trying not to get rid of the Briton and are trying to respond to the full range of news related to Brexit. In other words, traders are not completely pessimistic about the British currency. Whether this is correct or not, there is no point in discussing it. Traders behave like this now, so you need to adapt to the majority. And since the information background is not in the first place now, you need to pay more attention to graphic signals in trading. However, new information from the negotiations, which are currently ongoing in London, can be received at any time. And it can affect the mood of traders. GBP/USD – 4H. 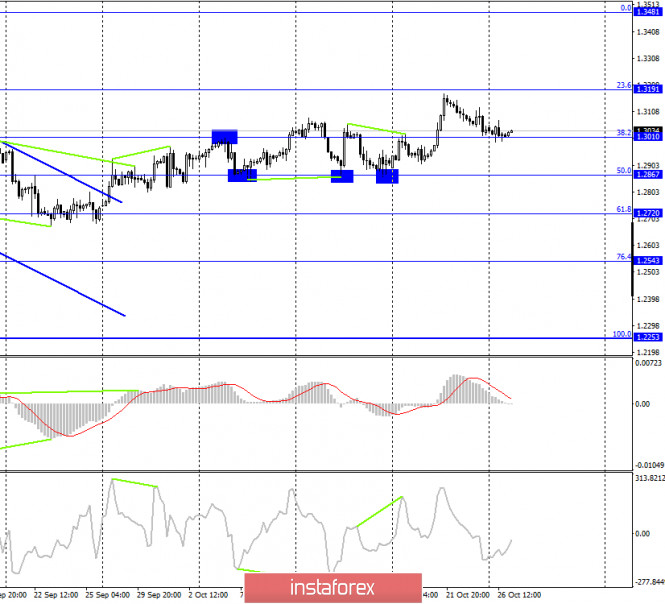
On the 4-hour chart, the GBP/USD pair performed a fall to the Fibo level of 38.2% (1.3010). The pair's rebound from this level will allow traders to count on a reversal in favor of the British dollar and new growth in the direction of the corrective level of 23.6% (1.3191). Fixing quotes below the level of 38.2% will increase the probability of continuing to fall in the direction of the next corrective level of 50.0% (1.2867). GBP/USD – Daily. 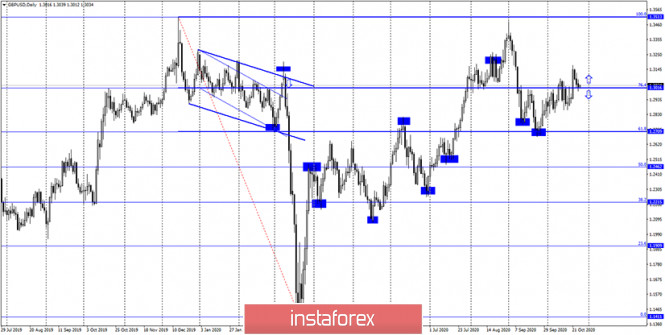
On the daily chart, the pair's quotes consolidated above the corrective level of 76.4% (1.3016), however, the reversal in favor of the US currency has already been completed and the fall has begun. More important now is the 4-hour chart and the corrective level of 38.2% on it. GBP/USD – Weekly. 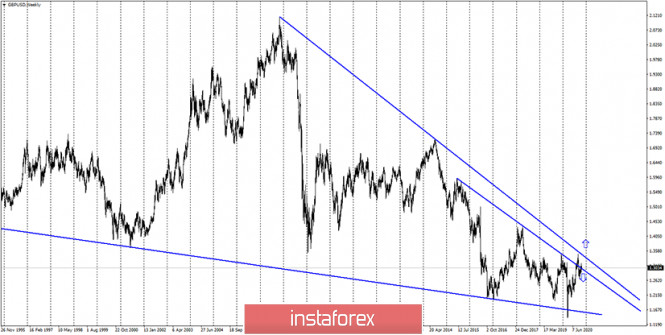
On the weekly chart, the pound/dollar pair closed under the lower downward trend line, thus, a false breakout of this line followed earlier. However, in recent weeks, it has made new attempts to gain a foothold over both trend lines. Overview of fundamentals: There were no economic reports in the UK and America on Monday. There was also no new information about the progress of negotiations between the UK and the European Union, which are currently ongoing in London and have even been extended for several days. News calendar for the United States and the United Kingdom: US - changes in the volume of orders for durable goods (12:30 GMT). On October 27, the news calendar of the UK and US contains only one report, but at any time, there may be important information from London about whether Michel Barnier and David Frost have agreed or not this time. COT (Commitments of Traders) report: 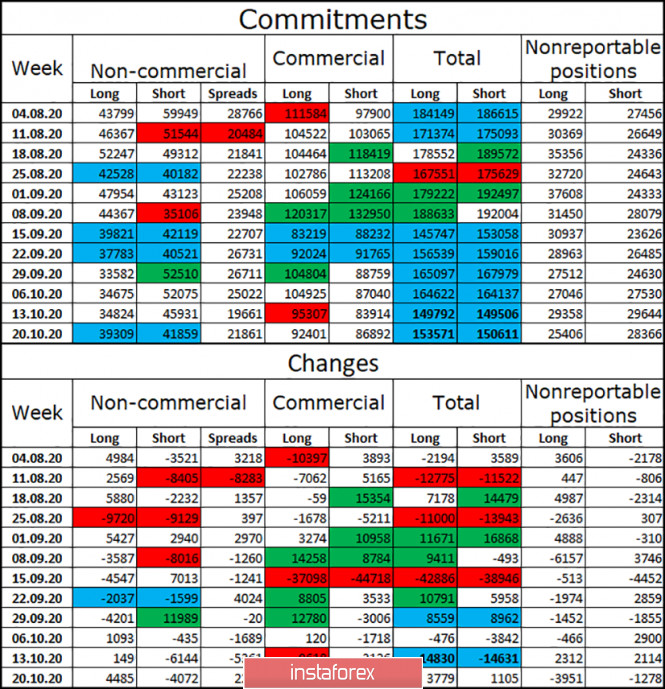
The latest COT report on the British pound that was released last Friday showed that the mood of the "Non-commercial" category of traders has become more "bullish". Speculators immediately increased by 4.5 thousand long-contracts and got rid of 4 thousand short-contracts. Thus, after three weeks of "bearish" advantage, speculators are again inclined to buy the British. However, I believe that such a change in mood does not mean anything specific. In a week or two, major players can start building up short contracts again. And the total number of long and short contracts focused on their hands is almost the same. Thus, I would conclude that the major players are now in disarray. Forecast for GBP/USD and recommendations for traders: Today, I recommend selling the GBP/USD pair with a target of 1.2867, if the consolidation is made under the corrective level of 38.2% (1.3010) on the 4-hour chart. I recommend buying the British dollar with a target of 1.3191 if there is a rebound from the level of 38.2% on the 4-hour chart or a close above the descending corridor on the hourly chart. Terms: "Non-commercial" - major market players: banks, hedge funds, investment funds, private, large investors. "Commercial" - commercial enterprises, firms, banks, corporations, companies that buy currency not for speculative profit, but for current activities or export-import operations. "Non-reportable positions" - small traders who do not have a significant impact on the price. Technical analysis of EUR/USD for October 27, 2020 2020-10-27 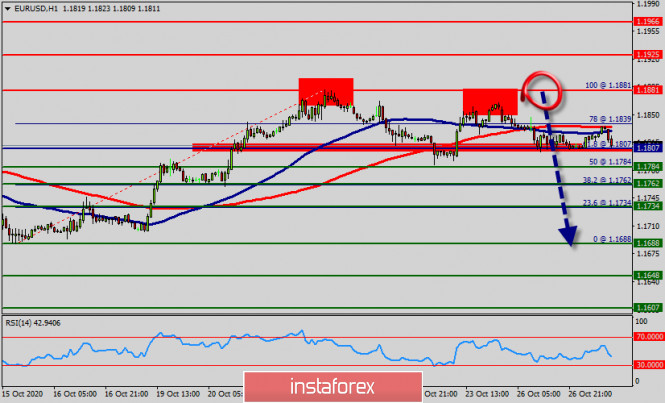 Overview : The EUR/USD pair faced resistance at the level of 1.1839 because support had become resistance. But, the strong resistance has already formed at the level of 1.1881 and the pair is likely to try to approach it in order to test it again. However, if the pair fails to pass through the level of 1.1881, the market will indicate a bearish opportunity below the new strong resistance level of 1.1881 (the level of 1.1881 coincides with a ratio of 100% Fibonacci). Also, the level of 1.1807 represents a weekly pivot point for that it is acting as major resistance/support this week. Amid the previous events, the pair is still in a downtrend, because the EUR/USD pair is trading in a bearish trend from the new resistance line of 1.1839 towards the first support level at 1.1784 in order to test it. Moreover, the RSI starts signaling a downward trend, as the trend is still showing strength above the moving average (100) and (50). Thus, the market is indicating a bearish opportunity below 1.1881 for that it will be good to sell at 1.1839 with the first target of 1.1784. It will also call for a downtrend in order to continue towards 1.1734. The daily strong support is seen at 1.1688. However, the stop loss should always be taken into account, for that it will be reasonable to set your stop loss at the level of 1.1925. Technical analysis of GBP/USD for October 27, 2020 2020-10-27 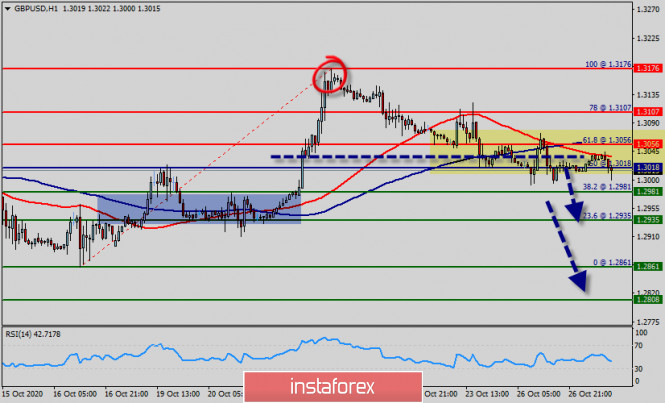 Overview : Yesterday, the GBP/USD pair dropped sharply from the level of 1.3107 towards 1.3018. Now, the price is set at 1.3018. On the H1chart, the resistance of GBP/USD pair is seen at the level of 1.3056 and 1.3107. It should be noted that volatility is very high for that the GBP/USD pair is still moving between 1.3056 and 1.2935 in coming hours. Moreover, the price spot of 1.3056/1.3107 remains a significant resistance zone. Therefore, there is a possibility that the GBP/USD pair will move downside and the structure of a fall does not look corrective. In order to indicate the bearish opportunity below 1.3056/1.3107, sell below 1.3056 or 1.3107 with the first target at 1.2935 in order to test yesterday's bottom. Additionally, if the GBP/USD pair is able to break out the bottom at 1.2935, the market will decline further to 1.2861 so as to test the weekly support 3. Also, it should be noticed that support 1 is seen at the level of 1.3018 which coincides the daily pivot point. However, the price spot of 1.3056 and 1.3107 remains a significant resistance zone. Thus, the trend is still bearish as long as the level of 1.3107 is not breached. EUR/USD: Europe's GDP will contract this 4th quarter. Yen is in demand again as investors are running away from risks amid another wave of COVID-19. 2020-10-27 The expected deeper contraction of the Euro area's GDP in the 4th quarter, together with weak indicators on German confidence and economic expectations, as well as sharp surge in COVID-19 infections both in Europe and the United States, are keeping demand low for risky assets , and, accordingly, high on safe haven assets, particularly in the US dollar and Japanese yen. The yen has already rallied against most of the G10 currencies as investors are reluctant to take on new risks and are trying to avoid them amid rising incidence of COVID-19. At the same time, the lack of progress in negotiations over a new US stimulus package is keeping the US dollar attractive.  Earlier, European leaders have mentioned the likelihood of implementing new quarantine restrictions if COVID-19 incidence continues to rise in the Euro area. Since the pandemic continues to persist in many European states, plus given the fact that new restrictions will create more negative consequences in economic activity, the odds of seeing a deeper contraction in the Euro area's GDP in the 4th quarter has become higher. Any new restriction will surely cause colossal damage to the service sector, especially since the second wave of COVID-19 is expected to be no less destructive than the first. Good thing though that the governments have already prepared strategies to overcome it without introducing tough quarantine measures that would bring down the global economy. So, even if the Euro area's GDP face a terrible fate of dropping down, it would not be as low as the level it reached before. In addition, according to recent data, the sharp contraction in the services sector is offset by the improving figures in the manufacturing sector. However, it's worth remembering that before, the service sector also collapsed first, and afterwards it was followed by the manufacturing sector. With regards to the services and manufacturing sectors, recent data show that the eurozone has seen an improvement in the manufacturing sector, however, it was offset by the sharp decline in the services sector. The IHS Market reports that manufacturing PMI rose from 53.7 points to 54.4 points in October, while the services PMI dropped from 48.0 points to 46.2 poins. A reading below 50 points indicates a contraction in activity. Economists had expected the manufacturing PMI to be 52.6 and the services sector to be 46.7. As for the coronavirus pandemic, the World Health Organization has relayed that daily incidence of COVID-19 around the world has already reached 465 thousand, well above its previous figures. Such prospects are very terrible for the European currency, although it did not lead yet to a sharp collapse in the market. Still, the bulls need to bring the quote above the resistance level of 1.1830, as only after that will it be possible for the pair to see an upward move towards the level of 1.1865. But if the demand for the euro continues to decline in the market, the quote will most likely drop to 1.1790, and a breakout from which will push the pair further down to 1.1760 and 1.1705. About economic statistics, the US Department of Commerce published a report yesterday on the US primary housing market, which surprised traders because of its lower-than-expected data. Sales were revealed to have decreased by 3.5% in September, amounting to only 959,000 per year. The Economists had expected it to rise by 1% and amount to 1.02 million homes a year. 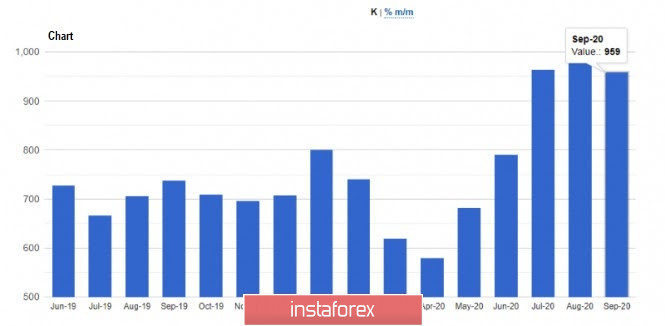 Meanwhile, economic activity in the area of the Dallas Fed continued to observe growth in its indicators, thus, its manufacturing index in October rose from 22.3 points to 25.5 points, while its business activity index increased to 19.8 points. The index from the Chicago Fed, on the other hand, underwent a slowdown, dropping down from 1.11 points to only 0.27 points in September, while economists had expected it to be 0.73 points. The decline indicates the gradual decaying of economic growth in the area, on which if (or rather when) the index moves to the negative side, it will be an indication that growth is well below the trend.
Author's today's articles: Irina Manzenko  Irina Manzenko Irina Manzenko Torben Melsted  Born in November 1962. Graduated from CBS, got Diploma in Finance. Began trading on Forex in 1986 and since that time held various positions such as advising clients, hedging client flows on FX and commodity markets. Also worked for major corporations as Financial Risk Manager. Uses Elliott wave analysis in combination with classic technical analysis, and has been using a Calmar Ratio of 5.0 for over 3 years. Has his own blog, where he uses Elliott wave and technical analysis on all financial markets. Born in November 1962. Graduated from CBS, got Diploma in Finance. Began trading on Forex in 1986 and since that time held various positions such as advising clients, hedging client flows on FX and commodity markets. Also worked for major corporations as Financial Risk Manager. Uses Elliott wave analysis in combination with classic technical analysis, and has been using a Calmar Ratio of 5.0 for over 3 years. Has his own blog, where he uses Elliott wave and technical analysis on all financial markets. Stanislav Polyanskiy  Graduated from Odessa State Economic University. On Forex since 2006. Writes analytical reviews about international financial markets for more than 3 years. Worked as a currency analyst in different finance companies for a long time including the biggest companies of Russia and Ukraine. Graduated from Odessa State Economic University. On Forex since 2006. Writes analytical reviews about international financial markets for more than 3 years. Worked as a currency analyst in different finance companies for a long time including the biggest companies of Russia and Ukraine. Vladislav Tukhmenev  Vladislav graduated from Moscow State University of Technologiy and Management. He entered the forex market in early 2008. Vladislav is a professional trader, analyst, and manager. He applies a whole gamut of analysis – technical, graphical, mathematical, fundamental, and candlestick analysis. Moreover, he forecasts the market movements using his own methods based on the chaos theory. Vladimir took part in development of trading systems devoted to fractal analysis. In his free time, Vladimir blogs about exchange markets. Hobbies: active leisure, sporting shooting, cars, design, and marketing. "I do not dream only of becoming the best in my field. I also dream about those who I will take with me along the way up." Vladislav graduated from Moscow State University of Technologiy and Management. He entered the forex market in early 2008. Vladislav is a professional trader, analyst, and manager. He applies a whole gamut of analysis – technical, graphical, mathematical, fundamental, and candlestick analysis. Moreover, he forecasts the market movements using his own methods based on the chaos theory. Vladimir took part in development of trading systems devoted to fractal analysis. In his free time, Vladimir blogs about exchange markets. Hobbies: active leisure, sporting shooting, cars, design, and marketing. "I do not dream only of becoming the best in my field. I also dream about those who I will take with me along the way up." Maxim Magdalinin  In 2005 graduated from the Academy of the Ministry of Internal Affairs of the Republic of Belarus, law faculty. Worked as a lawyer for three years in one of the biggest country's company. Besides the trading, he develops trading systems, writes articles and analytical reviews. Works at stock and commodity markets explorations. On Forex since 2006. In 2005 graduated from the Academy of the Ministry of Internal Affairs of the Republic of Belarus, law faculty. Worked as a lawyer for three years in one of the biggest country's company. Besides the trading, he develops trading systems, writes articles and analytical reviews. Works at stock and commodity markets explorations. On Forex since 2006. Mihail Makarov  - - Sergey Belyaev  Born December 1, 1955. In 1993 graduated from Air Force Engineering Academy. In September 1999 started to study Forex markets. Since 2002 has been reading lectures on the technical analysis . Is fond of research work. Created a personal trading system based on the indicator analysis. Authored the book on technical analysis "Calculation of the next candlestick". At present the next book is being prepared for publishing "Indicator Analysis of Forex Market. Trading System Encyclopedia". Has created eleven courses on indicator analysis. Uses classical indicators. Works as a public lecturer. Held numerous seminars and workshops presented at international exhibitions of financial markets industry. Is known as one of the best specialists in the Russian Federation researching indicator analysis. Born December 1, 1955. In 1993 graduated from Air Force Engineering Academy. In September 1999 started to study Forex markets. Since 2002 has been reading lectures on the technical analysis . Is fond of research work. Created a personal trading system based on the indicator analysis. Authored the book on technical analysis "Calculation of the next candlestick". At present the next book is being prepared for publishing "Indicator Analysis of Forex Market. Trading System Encyclopedia". Has created eleven courses on indicator analysis. Uses classical indicators. Works as a public lecturer. Held numerous seminars and workshops presented at international exhibitions of financial markets industry. Is known as one of the best specialists in the Russian Federation researching indicator analysis. Sebastian Seliga  Sebastian Seliga was born on 13th Oсtober 1978 in Poland. He graduated in 2005 with MA in Social Psychology. He has worked for leading financial companies in Poland where he actively traded on NYSE, AMEX and NASDAQ exchanges. Sebastian started Forex trading in 2009 and mastered Elliott Wave Principle approach to the markets by developing and implementing his own trading strategies of Forex analysis. Since 2012, he has been writing analitical reviews based on EWP for blogs and for Forex websites and forums. He has developed several on-line projects devoted to Forex trading and investments. He is interested in slow cooking, stand-up comedy, guitar playing, reading and swimming. "Every battle is won before it is ever fought", Sun Tzu Sebastian Seliga was born on 13th Oсtober 1978 in Poland. He graduated in 2005 with MA in Social Psychology. He has worked for leading financial companies in Poland where he actively traded on NYSE, AMEX and NASDAQ exchanges. Sebastian started Forex trading in 2009 and mastered Elliott Wave Principle approach to the markets by developing and implementing his own trading strategies of Forex analysis. Since 2012, he has been writing analitical reviews based on EWP for blogs and for Forex websites and forums. He has developed several on-line projects devoted to Forex trading and investments. He is interested in slow cooking, stand-up comedy, guitar playing, reading and swimming. "Every battle is won before it is ever fought", Sun Tzu Vyacheslav Ognev  Vyacheslav was born on August 24, 1971. In 1993, he graduated from Urals State University of Economics in the Russian city of Ekaterinburg holding a degree in Commerce and Economics of Trade. In 2007, he started concentrating on the Russian stock market, trading stocks on the RTS Stock Exchange and futures contracts on FORTS. Since 2008 he has been engaged in analyzing Forex market and trading currencies. He is an author of a simplified wave analysis method. He has also developed a trading strategy. At present, Vyacheslav is a co-author of training materials on two web portals dedicated to Forex trading education. Interests: fitness, F1 "Experience is the best of schoolmasters, only the school fees are heavy." - Thomas Carlyle Vyacheslav was born on August 24, 1971. In 1993, he graduated from Urals State University of Economics in the Russian city of Ekaterinburg holding a degree in Commerce and Economics of Trade. In 2007, he started concentrating on the Russian stock market, trading stocks on the RTS Stock Exchange and futures contracts on FORTS. Since 2008 he has been engaged in analyzing Forex market and trading currencies. He is an author of a simplified wave analysis method. He has also developed a trading strategy. At present, Vyacheslav is a co-author of training materials on two web portals dedicated to Forex trading education. Interests: fitness, F1 "Experience is the best of schoolmasters, only the school fees are heavy." - Thomas Carlyle Alexandr Davidov  No data No data Grigory Sokolov  Born 1 January, 1986. In 2008 graduated from Kiev Institute of Business and Technology with "Finance and Credit" as a major. Since 2008 has studied the behavior of various currency pairs and their correlation on Forex. In his works and trading practice he uses candlestick analysis and Fibonacci technique. Since 2009 has written analytical reviews and articles which are published on popular Internet resources. Interests: music, computers and cookery. "Out of five deadly sins of business and as a rule, the most widespread, excessive striving to get profit is the worst". P. Drucker Born 1 January, 1986. In 2008 graduated from Kiev Institute of Business and Technology with "Finance and Credit" as a major. Since 2008 has studied the behavior of various currency pairs and their correlation on Forex. In his works and trading practice he uses candlestick analysis and Fibonacci technique. Since 2009 has written analytical reviews and articles which are published on popular Internet resources. Interests: music, computers and cookery. "Out of five deadly sins of business and as a rule, the most widespread, excessive striving to get profit is the worst". P. Drucker Mourad El Keddani  Was born in Oujda, Morocco. Currently lives in Belgium. In 2003 obtained B.S. in Experimental Sciences. In 2007 obtained a graduate diploma at Institut Marocain Specialise en Informatique Applique (IMSIA), specialty – Software Engineering Analyst. In 2007–2009 worked as teacher of computer services and trainer in a professional school specializing in computer technologies and accounting. In 2005 started Forex trading. Authored articles and analytical reviews on Forex market on Forex websites and forums. Since 2008 performs Forex market research, and develops and implements his own trading strategies of Forex analysis (especially in Forex Research & Analysis, Currency Forecast, and Recommendations and Analysis) that lies in: Numerical analysis: Probabilities, equations and techniques of applying Fibonacci levels. Classical analysis: Breakout strategy and trend indicators. Uses obtained skills to manage traders' accounts since 2009. In April 2009 was certified Financial Technician by the International Federation of Technical Analysts. Winner of several social work awards: Education Literacy and Non-Formal Education (in Literacy and Adult Education in The National Initiative for Human Development). Was born in Oujda, Morocco. Currently lives in Belgium. In 2003 obtained B.S. in Experimental Sciences. In 2007 obtained a graduate diploma at Institut Marocain Specialise en Informatique Applique (IMSIA), specialty – Software Engineering Analyst. In 2007–2009 worked as teacher of computer services and trainer in a professional school specializing in computer technologies and accounting. In 2005 started Forex trading. Authored articles and analytical reviews on Forex market on Forex websites and forums. Since 2008 performs Forex market research, and develops and implements his own trading strategies of Forex analysis (especially in Forex Research & Analysis, Currency Forecast, and Recommendations and Analysis) that lies in: Numerical analysis: Probabilities, equations and techniques of applying Fibonacci levels. Classical analysis: Breakout strategy and trend indicators. Uses obtained skills to manage traders' accounts since 2009. In April 2009 was certified Financial Technician by the International Federation of Technical Analysts. Winner of several social work awards: Education Literacy and Non-Formal Education (in Literacy and Adult Education in The National Initiative for Human Development).
Languages: Arabic, English, French and Dutch.
Interests: Algorithm, Graphics, Social work, Psychology and Philosophy. Pavel Vlasov  No data No data
Subscription's options management Theme's:
Fundamental analysis, Fractal analysis, Wave analysis, Technical analysis, Stock Markets
Author's :
A Zotova, Aleksey Almazov, Alexander Dneprovskiy, Alexandr Davidov, Alexandros Yfantis, Andrey Shevchenko, Arief Makmur, Dean Leo, Evgeny Klimov, Fedor Pavlov, Grigory Sokolov, I Belozerov, Igor Kovalyov, Irina Manzenko, Ivan Aleksandrov, l Kolesnikova, Maxim Magdalinin, Mihail Makarov, Mohamed Samy, Mourad El Keddani, Oleg Khmelevskiy, Oscar Ton, Pavel Vlasov, Petar Jacimovic, R Agafonov, S Doronina, Sebastian Seliga, Sergey Belyaev, Sergey Mityukov, Stanislav Polyanskiy, T Strelkova, Torben Melsted, V Isakov, Viktor Vasilevsky, Vladislav Tukhmenev, Vyacheslav Ognev, Yuriy Zaycev, Zhizhko Nadezhda
Edit data of subscription settings
Unsubscribe from the mailing list Sincerely,
Analysts Service | If you have any questions, you can make a phone call using one of the
InstaForex Toll free numbers right now:
|  | InstaForex Group is an international brand providing online trading services to the clients all over the world. InstaForex Group members include regulated companies in Europe, Russia and British Virgin Islands. This letter may contain personal information for access to your InstaForex trading account, so for the purpose of safety it is recommended to delete this data from the history. If you have received this letter by mistake, please contact InstaForex Customer Relations Department. |


No comments:
Post a Comment