| Technical analysis of GBP/USD for October 12, 2020 2020-10-12 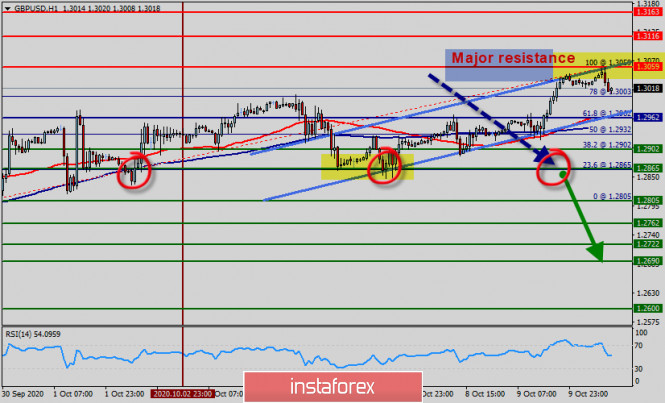 Overview : The GBP/USD pair faced resistance at the level of 1.3059, while minor resistance is seen at 1.3003. Support is found at the levels of 1.2962 and 1.2902. Also, it should be noted that a daily pivot point has already set at the level of 1.2962. Equally important, the EUR/USD pair is still moving around the key level at 1.2962, which represents a daily pivot in the H1 time frame at the moment. Last week, the GBP/USD pair continued to move upwards from the level of 1.2865. The pair rose from the level of 1.2865 (this level of 0.9800 coincides with the double bottom) to the top around 1.3059. In consequence, the GBP/USD pair broke resistance, which turned strong support at the level of 1.2962. The level of 0.9800 is expected to act as major support today. From this point, we expect the GBP/USD pair to continue moving in the bullish trend from the support level of 1.2962 towards the target level of 1.3059. If the pair succeeds in passing through the level of 1.3059, the market will indicate the bullish opportunity above the level of 1.3059 in order to reach the second target at 1.3116 and 1.3163. However, if the pair fails to pass through the level of 1.3059, the market will indicate a bearish opportunity below the level of 1.3059. So, the market will decline further to 1.2962 in order to return to the daily pivot point (1.2962). Moreover, a breakout of that target will move the pair further downwards to 1.2805 as so to return the double bottom. Trading idea for the GBP/USD pair 2020-10-12 On Friday, the pound has reached a quote of 1.3, which is the second target of the bullish strategy presented last September 30 . Its idea was to set up long positions in order to reach the target levels indicated on the chart below. Plan: 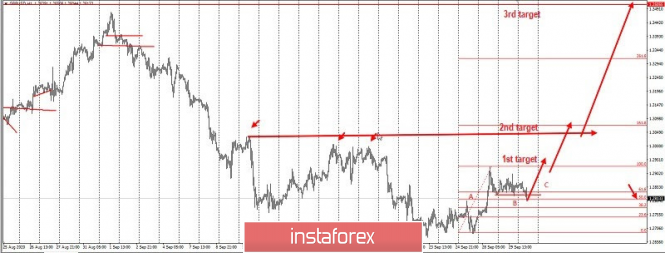 Development: 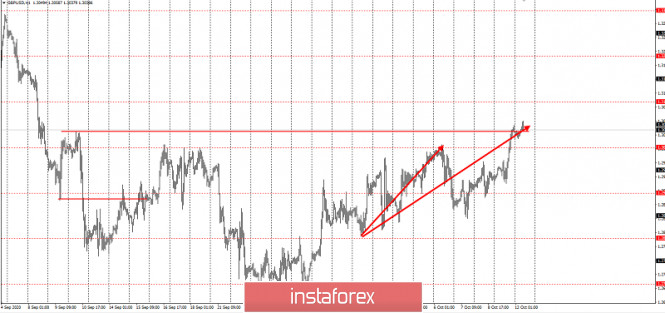 But since the third target (and main goal) has not been reached yet, long positions should be maintained, especially since Boris Johnson now has very little time left to come to an agreement with the EU. The lack of a post-Brexit deal could lead to a sharp decline in the British pound, so huge efforts are needed to retain the bullish mood in the GBP / USD pair. 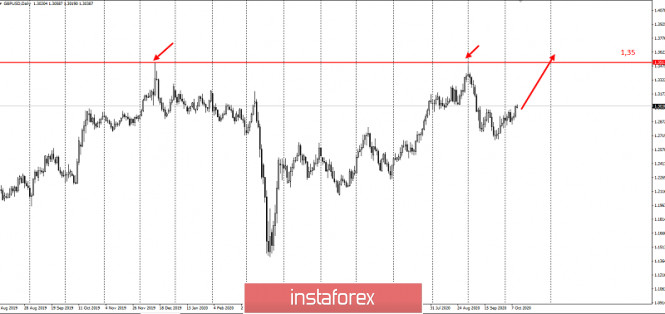 If the strategy succeeds, the movement up to 1.35 (main target) would amount at least 5,000 pips. However, we have to monitor the risk so as to avoid encountering losses. Keep in mind that the market is very unpredictable, so trading is very precarious, but then also profitable, provided that we use a correct strategy or approach Good luck! Trading idea for the USD/CHF pair 2020-10-12  Betting on a rise in the USD / CHF pair, the strategy that was presented last October 5 was to open long positions after a false breakout from 0.91600. Plan: 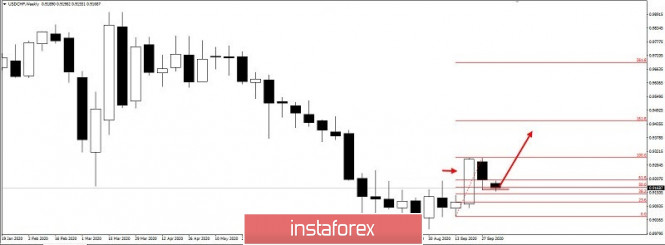 However, the third wave of purchases did not emerge, thus, the upward movement from the pivot did not happen: 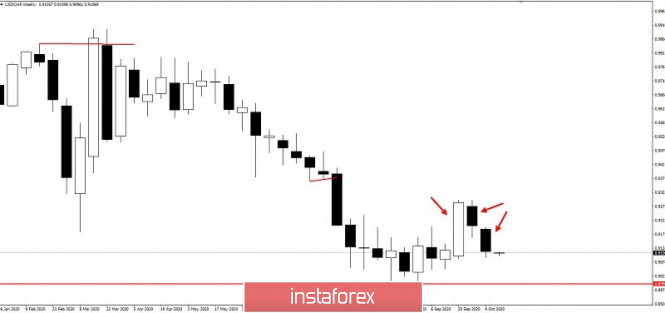 This cancels the upward scenario forecasted last week, thereby making long positions irrelevant. In addition, in this case, the strategy should best be changed from Price Action into Grid Trading. 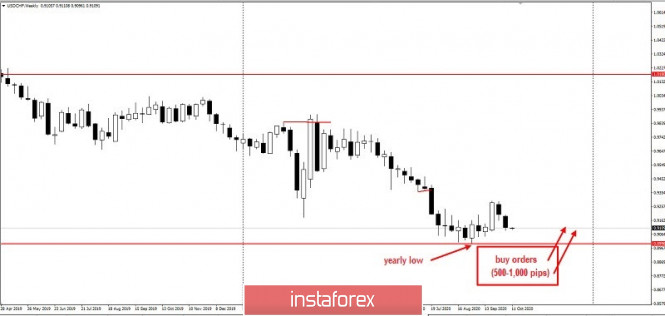 Grid trading is a classic technique of setting positions at regular intervals to target gains instead of stopping loss. It's good for gaining profit amid this fluctuating market. Good luck! Analysis of EUR/USD on October 12. Democrats continue to cause problems to the Republicans 2020-10-12 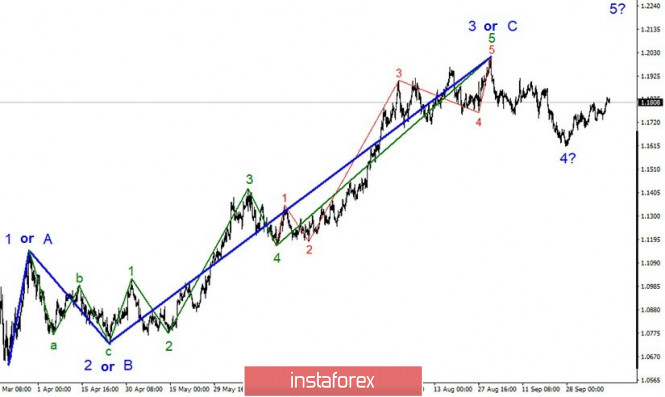 Globally, the wave pattern of the EUR/USD pair scale still looks quite convincing, while wave 4 is quite complete. Thus, the main option remains to increase quotes from the current levels within the framework of building wave 5 with goals located above the high of the expected wave 3 or C. This means that the instrument will increase to at least 20 figures, and most likely even higher. On the other hand, adopting a more complex form of wave 4 is currently not considered.  On a smaller time frame, the wave pattern still shows that the supposed wave 4 has taken on a three-wave form and is probably completed. If this is true, the quotes' growth will continue within wave 5. Last Friday, the instrument gained about 70 pips and continues to move confidently to the 20 figure based on the current wave pattern. During the last trading day and two weekends, several important news items were released at once. First, Donald Trump has recovered from the coronavirus, which was confirmed by his doctor. Secondly, regular negotiations between Democrats and Republicans took place over the weekend, during which Treasury Secretary Steven Mnuchin made a proposal for $1.8 trillion. However, Democrats, led by Joe Biden and Nancy Pelosi, refuse to accept a package of less than $2.2 trillion. If earlier, they could say that Trump is not aware of the full scale of the crisis and does not want to provide too expensive assistance to the economy, now the Democrats themselves look quite unattractive as the Republicans are still trying to find a compromise. However, not everything is so simple. Trump continues to insist that every American receive the $ 1,200 benefit personally signed on the check. Naturally, this is the populism that Biden and Pelosi want to avoid. Thus, the negotiations failed again. Interestingly, even the Republicans in the US Senate did not approve the new proposal of Trump and Mnuchin, considering it unnecessarily expensive. Thus, even if the Republicans meet the demands of the Democrats tomorrow, this bill will still be "hacked" in the Senate, which is controlled by the Republicans. Third, it became known that Joe Biden further widened the gap over Donald Trump three weeks before the Election Day. According to the latest opinion polls, Biden is already 12-16% ahead. Thus, the position of the current US President is becoming more and more gloomy, despite all his attempts to turn the course of the election campaign in his favor with the help of TV debates, stories with a rapid recovery from coronavirus and other cunning techniques. General conclusions and recommendations: Since the euro/dollar pair has presumably completed the construction of correctional wave 4, I recommend buying the instrument with targets located near the calculated level of 1.2012, equating to 0.0% Fibonacci. Analysis of GBP/USD on October 12. Markets disregard negativity from the UK 2020-10-12 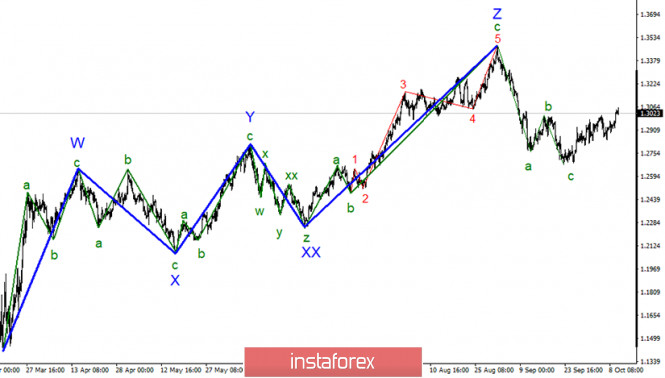 Globally, it is presumed that the formation of a new downward trend section remains. However, it is very likely that everything will end with waves a - b - c. If this is true, then the price increase will continue from the current levels with targets located near the peak of the z wave. A successful attempt to break the high of wave b also indirectly indicates the readiness of the markets to buy this tool. 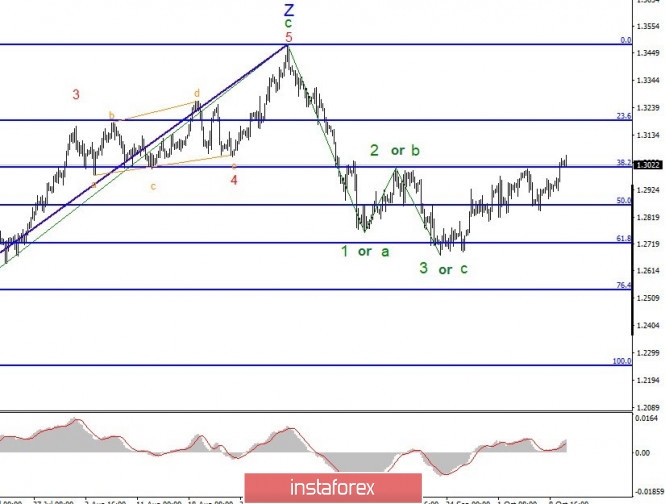 If we look closely, it is clear that the wave pattern has indeed taken on a three-wave form, which looks quite convincing. A failed attempt to break through the 61.8% Fibonacci level only further assures that the downward set of waves is complete. But the successful attempt to break through the 38.2% level in the end suggests that the markets are quite ready for a new growth of the quotes. This is slightly unusual, given the UK's news background, but the markets are now paying more attention to the news background from the US, which is also unsatisfactory. Last Friday, it was confirmed that the markets are actively ignoring the UK's news background again. Today, two important reports were released, which did not cause any reaction from the markets, although they should have. The volume of GDP in August grew by only 2.1%, although there was an increase of 6.6% in July, and the forecast was + 4.6%. The same thing goes for the industrial production report. The growth in August amounted to only 0.3 %%, although a growth of 5.2% was recorded a month earlier and the forecast was + 2.5%. Thus, the conclusions can be made almost unclear. The recovery of the British economy is slowing down, which is no longer an assumption, since it is confirmed by official statistics. On such news, the demand for the pound should have declined, but it did not. On the contrary, it added about 100 pips last Friday. Thus, I conclude that the markets are now putting the news background from the US first. If so, then the markets may continue to dislike the US dollar until the election, or at least until the end of October. However, I also draw your attention to the fact that the picture may change dramatically in a month. Firstly, the news background in the UK is even worse now than the US. Secondly, it is unclear what the market's reaction to the results of the presidential election will be. Thirdly, we don't know when these results will be publicized, since both parties seem to be preparing not for elections, but for courts. General conclusions and recommendations: The pound/dollar pair has supposedly completed the formation of the downward trend. A successful attempt to break through the 38.2% level allows us to recommend buying the pair with targets located around 1.3191 and 1.3480, which equates to 23.6% and 0.0% Fibonacci. However, the current news background is such that it can lead to a strong complication of the current wave pattern. Analysis of Gold for October 12,.2020 - Breakout of important pivot at $1.917 and potential for test of $1.955 2020-10-12 Heads up: UK job  s report to likely reflect higher unemployment after ONS methodology change ONS announced a revision to their methodology in capturing the jobs data The gist of the announcement is that the last few months i.e. pandemic period had been capturing a sample far less representative of the general UK population, which may have resulted in a lower jobless rate as such. Back in February around 67 per cent of households in their first interview in the LFS sample were owner occupiers and 32 per cent were renters. But in July this was around 77 per cent and 21 per cent respectively. Such a shift in tenure over this short time period is implausible, so this is evidence that the LFS is now picking up a different - and possibly less representative - sample... For tomorrow's release we will therefore reweight the estimates so that the shares of owner occupiers and renters are the same as before the pandemic hit in March. This should give us a much more representative set of labour market statistics. So, this will be a heads up to the jobs report for August tomorrow, where the unemployment rate is expected at 4.3% - in case the reading comes quite far off that. As I discussed in the previous review, the Gold managed to complete the downside correction ABC and I do expect further higher price. Further Development 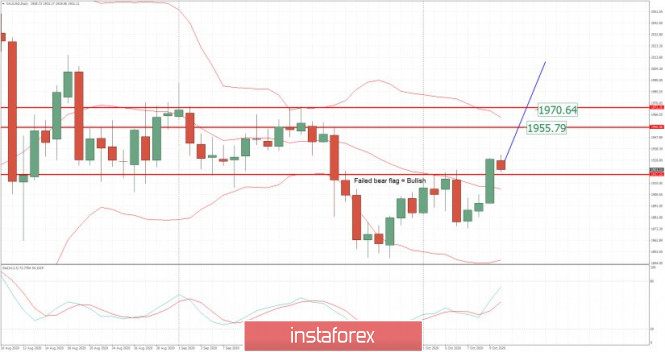
Analyzing the current trading chart of Gold on daily time-frame, I found that there is fialed bear flag pattern, which is good indication for further rise. 1-Day relative strength performance Finviz 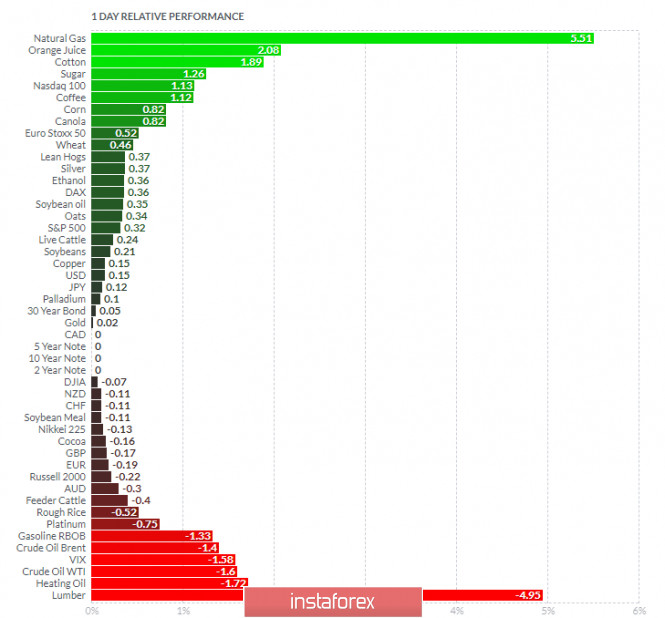
Based on the graph above I found that on the top of the list we got Natural Gas and Orange Juice today and on the bottom Lumber and Heating Oil Gold is neutral on the relative strength list today... Key Levels: Resistance: $1,970 Support level: $1,917 EUR/USD analysis for October 12 2020 - Watch for buying on the dips with upside target at 1.1865 2020-10-12 Lagarde will be participating in a virtual event hosted by the IMF She will be speaking as part of the IMF's 'Governor Talk' series, where she will be discussing about the post-pandemic landscape and challenges for policymakers in Europe. The event is scheduled for 1100 GMT later today. ICYMI, ECB chief economist Philip Lane spoke over the weekend and detailed plenty about uncertainty to the outlook and the need for fiscal support. I would expect more of the same from Lagarde as such. Further Development 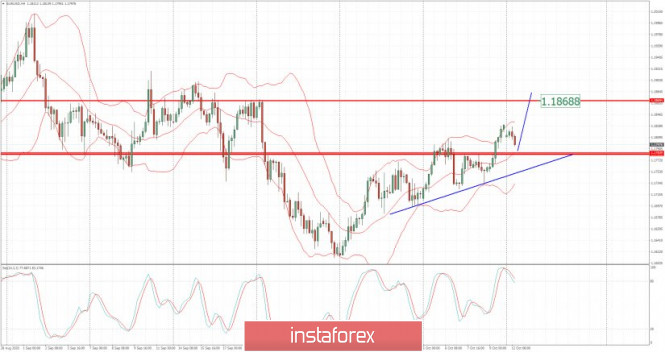
Analyzing the current trading chart of EUR/USD on 4H time-frame, I found that there is bear correction in progress but that trend is still upside. I would watch for buying opportunities around the price 1,1785 with target at 1,1865 The trend is still bullish and I didn't see any big reversal yet, whih is good confirmation for further rise.... 1-Day relative strength performance Finviz 
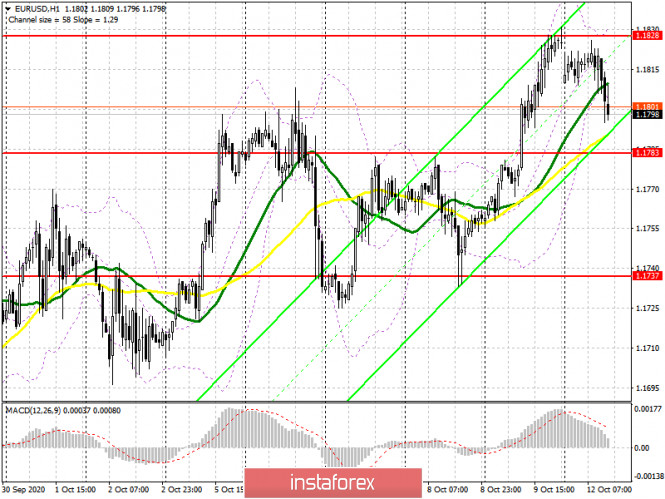
Based on the graph above I found that on the top of the list we got Natural Gas and Orange Juice today and on the bottom Lumber and Heating Oil EUR is slightly negative on the 1-day relative performance list... Key Levels: Resistance: 1,1865 Support level: 1,1785 EUR/USD: plan for the American session on October 12 (analysis of morning deals) 2020-10-12 To open long positions on EURUSD, you need: In the first half of the day, no signals were generated to enter the market. Low trading volume will continue in the afternoon against the backdrop of Columbus Day, which is celebrated in the United States today. From a technical point of view, nothing has changed, since none of the levels indicated earlier in the morning were tested. It will be possible to talk about the continued growth of the euro only after a breakout and consolidation above the resistance of 1.1828, which will open a direct road to new highs in the area of 1.1868 and 1.1915, where I recommend fixing the profits. However, we can hardly expect such a strong bullish momentum at the beginning of the week. Now there is pressure on the euro, thus, a more optimal scenario for buying will be a test of the support of 1.1783, where the moving averages that play on the side of buyers also pass. You can open long positions from this level immediately for a rebound in the expectation of continuing the bull market. To open short positions on EURUSD, you need: The bears did not manage to prove themselves, as the pair did not test the resistance of 1.1828, which I paid attention to this morning. Only the formation of a false breakout forms a signal to open short positions. The lack of fundamental data in the second half of the day can keep the pressure on the euro and more important to the bears will be a break and consolidation below the support of 1.1783 that forms a new entry point into short positions with the aim of reducing the area of low 1.1737 where I recommend taking the profit. With another rise in the pair in the afternoon and a breakout of the resistance at 1.1828, it is best not to rush to sell against a new upward trend, but wait for the update of the larger resistance at 1.1868, from where you can sell the euro immediately on a rebound, counting on correction of 20-30 points within the day. 
Let me remind you that the COT report (Commitment of Traders) for October 6 recorded a reduction in long positions and an increase in short ones, which led to an even greater decrease in the delta. Buyers of risky assets believe in the continuation of the bull market, but prefer to proceed cautiously, as there is no good news on the Eurozone and the pace of economic recovery yet. Thus, long non-commercial positions decreased from the level of 241,967 to the level of 231,369, while short non-commercial positions increased from the level of 53,851 to the level of 57,061. The total non-commercial net position fell to 174,308, compared to 188,116 a week earlier, which indicates a wait-and-see attitude of new players, however, bullish sentiment for the euro remains quite high in the medium term. Signals of indicators: Moving averages Trading is conducted around 30 and 50 daily moving averages, which indicates a return to market equilibrium. Note: The period and prices of moving averages are considered by the author on the hourly chart H1 and differ from the general definition of classic daily moving averages on the daily chart D1. Only a break of the upper limit of the indicator in the area of 1.1830 will lead to a new wave of growth of the European currency. Description of indicators - Moving average (moving average determines the current trend by smoothing out volatility and noise). Period 50. The graph is marked in yellow.
- Moving average (moving average determines the current trend by smoothing out volatility and noise). Period 30. The graph is marked in green.
- MACD indicator (Moving Average Convergence / Divergence - moving average convergence / divergence) Fast EMA period 12. Slow EMA period 26. SMA period 9
- Bollinger Bands (Bollinger Bands). Period 20
- Non-profit speculative traders, such as individual traders, hedge funds, and large institutions that use the futures market for speculative purposes and meet certain requirements.
- Long non-commercial positions represent the total long open position of non-commercial traders.
- Short non-commercial positions represent the total short open position of non-commercial traders.
- Total non-commercial net position is the difference between the short and long positions of non-commercial traders.
GBP/USD: plan for the American session on October 12 (analysis of morning deals) 2020-10-12 To open long positions on GBP/USD, you need: In the first half of the day, a signal was formed to buy the British pound, which led to losses, as the bulls failed to maintain the momentum gained at the end of last week. Let's look at the 5-minute chart and analyze the deal. Buyers of the pound achieve a breakdown of the resistance of 1.3045 and test it from top to bottom, which forms a good entry point for the continuation of the bullish trend. However, we did not see a more powerful upward wave, after which the bears returned the pair to the area of 1.3045. Unfortunately, it was not possible to wait for the test of this level from the reverse side to form a sell signal, and the market went down. 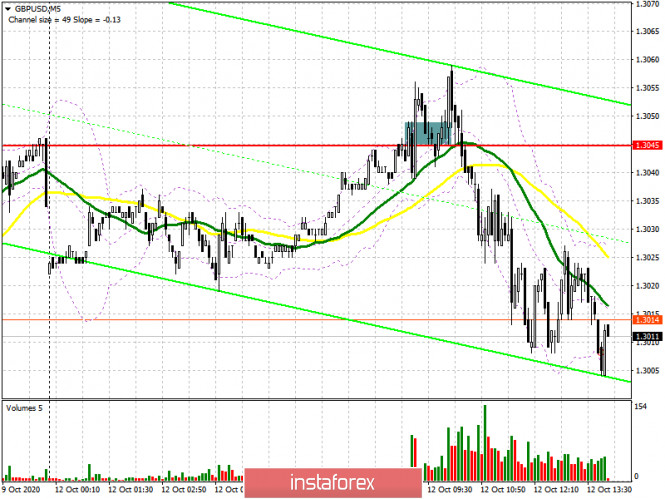
As for the current picture of the GBP/USD pair, it has not changed much. Only another breakout and consolidation above the resistance of 1.3052 forms a signal to open long positions, which may lead to the demolition of a number of sellers' stop orders and strengthen the upward trend of the pair to the area of the maximum of 1.3106. A longer-term goal will be the area of 1.3178, where I recommend taking the profit. However, do not forget that today is Columbus Day in the United States and volatility, along with trading volume, will be at a fairly low level, especially in the afternoon. In the scenario of a further decline in the pair, the emphasis will be placed on the protection of the area of 1.2991, where the moving averages also pass, which are now playing on the side of the pound buyers. However, only the formation of a false breakout will be a signal to open long positions. If there is no activity on the part of the bulls at this level, I recommend that you do not rush to buy, but wait for the test of the 1.2925 area and buy the pound there for a rebound in the expectation of correction of 30-40 points within the day. To open short positions on GBP/USD, you need: Sellers defended the resistance of 1.3045, slightly changing it to 1.3052. Now all the emphasis is placed on the pair's return to the support area of 1.2991. However, only fixing below this level, where the moving averages also pass, will return the initiative to the bears and lead to the formation of a larger movement to the area of 1.2925, where I recommend fixing the profits. In the scenario of a repeated growth of the pound and a breakout of the resistance of 1.3052, especially in the absence of important fundamental statistics, it is better not to rush to sell, as the market may continue to implement Friday's bullish momentum. Most likely, the bears will resort to the protection of the resistance of 1.3106. Otherwise, you can sell GBP/USD immediately for a rebound from the maximum of 1.3178, based on a correction of 30-40 points within the day. 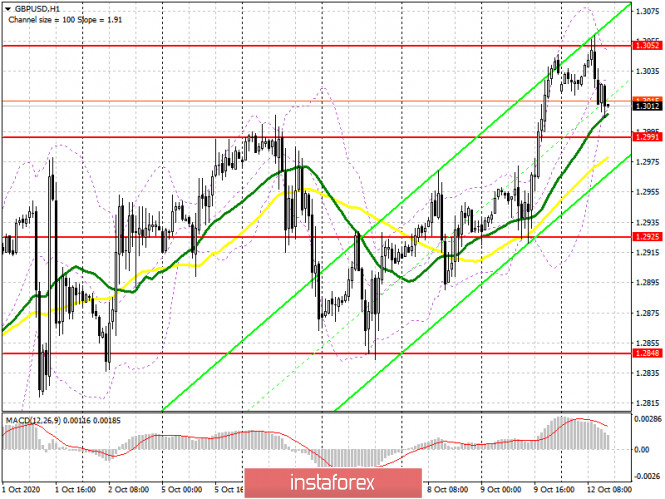
Let me remind you that in the COT reports (Commitment of Traders) for October 6, there was a minimal increase in short non-commercial positions from the level of 51,961 to the level of 51,996. Long non-profit positions slightly increased from the level of 39,216 to the level of 40,698. As a result, the non-commercial net position remained negative and amounted to -11,298, against -12,745, which indicates that sellers of the British pound remain in control and have a minimal advantage in the current situation. The higher the pair grows, the more attractive it will become for sale. Signals of indicators: Moving averages Trading is above 30 and 50 daily averages, which indicates a possible continuation of the pound's growth in the short term. Note: The period and prices of moving averages are considered by the author on the hourly chart H1 and differ from the general definition of classic daily moving averages on the daily chart D1. Bollinger Bands A break of the upper limit of the indicator in the area of 1.3052 will lead to a new major wave of growth of the pound. A break of the lower border of the indicator in the area of 1.3010 will increase the pressure on the pair. Description of indicators - Moving average (moving average determines the current trend by smoothing out volatility and noise). Period 50. The graph is marked in yellow.
- Moving average (moving average determines the current trend by smoothing out volatility and noise). Period 30. The graph is marked in green.
- MACD indicator (Moving Average Convergence / Divergence - moving average convergence / divergence) Fast EMA period 12. Slow EMA period 26. SMA period 9
- Bollinger Bands (Bollinger Bands). Period 20
- Non-profit speculative traders, such as individual traders, hedge funds, and large institutions that use the futures market for speculative purposes and meet certain requirements.
- Long non-commercial positions represent the total long open position of non-commercial traders.
- Short non-commercial positions represent the total short open position of non-commercial traders.
- Total non-commercial net position is the difference between the short and long positions of non-commercial traders.
Author's today's articles: Mourad El Keddani  Was born in Oujda, Morocco. Currently lives in Belgium. In 2003 obtained B.S. in Experimental Sciences. In 2007 obtained a graduate diploma at Institut Marocain Specialise en Informatique Applique (IMSIA), specialty – Software Engineering Analyst. In 2007–2009 worked as teacher of computer services and trainer in a professional school specializing in computer technologies and accounting. In 2005 started Forex trading. Authored articles and analytical reviews on Forex market on Forex websites and forums. Since 2008 performs Forex market research, and develops and implements his own trading strategies of Forex analysis (especially in Forex Research & Analysis, Currency Forecast, and Recommendations and Analysis) that lies in: Numerical analysis: Probabilities, equations and techniques of applying Fibonacci levels. Classical analysis: Breakout strategy and trend indicators. Uses obtained skills to manage traders' accounts since 2009. In April 2009 was certified Financial Technician by the International Federation of Technical Analysts. Winner of several social work awards: Education Literacy and Non-Formal Education (in Literacy and Adult Education in The National Initiative for Human Development). Was born in Oujda, Morocco. Currently lives in Belgium. In 2003 obtained B.S. in Experimental Sciences. In 2007 obtained a graduate diploma at Institut Marocain Specialise en Informatique Applique (IMSIA), specialty – Software Engineering Analyst. In 2007–2009 worked as teacher of computer services and trainer in a professional school specializing in computer technologies and accounting. In 2005 started Forex trading. Authored articles and analytical reviews on Forex market on Forex websites and forums. Since 2008 performs Forex market research, and develops and implements his own trading strategies of Forex analysis (especially in Forex Research & Analysis, Currency Forecast, and Recommendations and Analysis) that lies in: Numerical analysis: Probabilities, equations and techniques of applying Fibonacci levels. Classical analysis: Breakout strategy and trend indicators. Uses obtained skills to manage traders' accounts since 2009. In April 2009 was certified Financial Technician by the International Federation of Technical Analysts. Winner of several social work awards: Education Literacy and Non-Formal Education (in Literacy and Adult Education in The National Initiative for Human Development).
Languages: Arabic, English, French and Dutch.
Interests: Algorithm, Graphics, Social work, Psychology and Philosophy. Andrey Shevchenko  Andrey Shevchenko Andrey Shevchenko Alexander Dneprovskiy  Graduated from Kiev State University of Economics. On Forex market since 2007. Started his work at Forex as a trader. Since 2008 is working as a currency analyst. Graduated from Kiev State University of Economics. On Forex market since 2007. Started his work at Forex as a trader. Since 2008 is working as a currency analyst. Petar Jacimovic  Petar was born on July 08, 1989 in Serbia. Graduated from Economy University and after has worked as a currency analyst for large private investors. Petar has been involved in the world of finance since 2007. In this trading he specializes in Volume Price Action (volume background, multi Fibonacci zones, trend channels, supply and demand). He also writes the market analytical reviews for Forex forums and websites. Moreover Petar is forex teacher and has wide experience in tutoring and conducting webinars. Interests : finance, travelling, sports, music "The key to success is hard work" Petar was born on July 08, 1989 in Serbia. Graduated from Economy University and after has worked as a currency analyst for large private investors. Petar has been involved in the world of finance since 2007. In this trading he specializes in Volume Price Action (volume background, multi Fibonacci zones, trend channels, supply and demand). He also writes the market analytical reviews for Forex forums and websites. Moreover Petar is forex teacher and has wide experience in tutoring and conducting webinars. Interests : finance, travelling, sports, music "The key to success is hard work" Maxim Magdalinin  In 2005 graduated from the Academy of the Ministry of Internal Affairs of the Republic of Belarus, law faculty. Worked as a lawyer for three years in one of the biggest country's company. Besides the trading, he develops trading systems, writes articles and analytical reviews. Works at stock and commodity markets explorations. On Forex since 2006. In 2005 graduated from the Academy of the Ministry of Internal Affairs of the Republic of Belarus, law faculty. Worked as a lawyer for three years in one of the biggest country's company. Besides the trading, he develops trading systems, writes articles and analytical reviews. Works at stock and commodity markets explorations. On Forex since 2006.
Subscription's options management Theme's:
Fundamental analysis, Fractal analysis, Wave analysis, Technical analysis, Stock Markets
Author's :
A Zotova, Aleksey Almazov, Alexander Dneprovskiy, Alexandr Davidov, Alexandros Yfantis, Andrey Shevchenko, Arief Makmur, Dean Leo, Evgeny Klimov, Fedor Pavlov, Grigory Sokolov, I Belozerov, Igor Kovalyov, Irina Manzenko, Ivan Aleksandrov, l Kolesnikova, Maxim Magdalinin, Mihail Makarov, Mohamed Samy, Mourad El Keddani, Oleg Khmelevskiy, Oscar Ton, Pavel Vlasov, Petar Jacimovic, R Agafonov, S Doronina, Sebastian Seliga, Sergey Belyaev, Sergey Mityukov, Stanislav Polyanskiy, T Strelkova, Torben Melsted, V Isakov, Viktor Vasilevsky, Vladislav Tukhmenev, Vyacheslav Ognev, Yuriy Zaycev, Zhizhko Nadezhda
Edit data of subscription settings
Unsubscribe from the mailing list Sincerely,
Analysts Service | If you have any questions, you can make a phone call using one of the
InstaForex Toll free numbers right now:
|  | InstaForex Group is an international brand providing online trading services to the clients all over the world. InstaForex Group members include regulated companies in Europe, Russia and British Virgin Islands. This letter may contain personal information for access to your InstaForex trading account, so for the purpose of safety it is recommended to delete this data from the history. If you have received this letter by mistake, please contact InstaForex Customer Relations Department. |


No comments:
Post a Comment