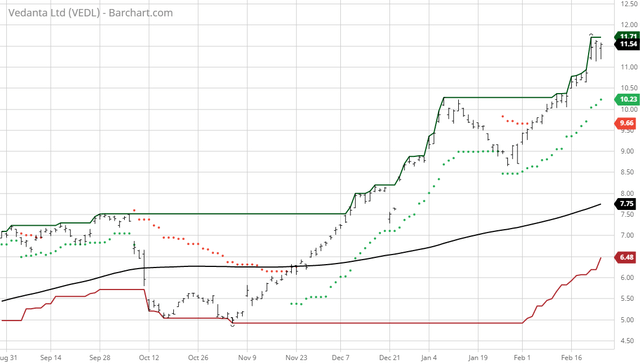
The Barchart Chart of the Day belongs to the natural resources company Vedanta (NYSE:VEDL). I found the stock by using Barchart's powerful screening tools to find the stocks with the highest Weighted Alpha and technical buy signals. After I sorted for the most frequent number of new highs in the last month, I used the Flipchart feature to review the charts for consistent prices appreciation. Since the Trend Spotter signaled a buy on 2/3 the stock gained 19.21%. Vedanta Limited operates as a diversified natural resources company in India. The company explores for, develops, produces, processes, and sells oil and gas, zinc, lead, silver, copper, aluminum, iron ore, steel, and power. It is involved in the exploration, development, and production of oil and gas; and exploration, mining, and processing of iron ore, pig iron, and metallurgical coke. The company also operates a thermal coal- based commercial power facility of 600 megawatts (MW) at Jharsuguda in the State of Odisha in eastern India; a 300 MW thermal coal based power plant at Korba; 1,980 MW (three units of 660 MW each) thermal coal- based commercial power facilities; 274MW of wind power plants; and a power plant situated at Mettur Dam in the state of Tamil Nadu in southern India. In addition, it manufactures and supplies billets, TMT bars, wire rods, and ductile iron pipes; engages in the mechanization of coal handling facilities and upgradation of general cargo berth for handling coal at the outer harbour of Visakhapatnam Port on the east coast of India; and provides logistics and other allied services inter alia rendering stevedoring, and other allied services in ports and other allied sectors. Further, the company is involved in manufacturing glass substrates in South Korea and Taiwan. It also has operations in South Africa, Namibia, Ireland, Australia, Liberia, and the United Arab Emirates. The company was incorporated in 1965 and is based in Mumbai, India. 
Barchart's Opinion Trading systems are listed below. Please note that the Barchart Opinion indicators are updated live during the session every 20 minutes and can therefore change during the day as the market fluctuates. The indicator numbers shown below therefore may not match what you see live on the Barchart.com website when you read this report. Barchart technical indicators: - 100% technical buy signals
- 124.02+ Weighted Alpha
- 54.98% gain in the last year
- Trend Spotter buy signal
- Above its 20, 50 and 100 day moving averages
- 17 new highs and up 26.01% in the last month
- Relative Strength Index 78.40%
- Technical support level at 11.29
- Recently traded at 11.54 with a 50 day moving average of 9.45
Fundamental factors: - Market Cap $10.79 billion
- P/E 24.93
- Dividend yield 7.56%
- The is an Indian based ADR and is not widely followed on Wall Street
- The analyst following the stock rated it a strong buy
- 4,850 investors monitor the stock on Seeking Alpha
The Barchart Chart of the Day highlights stocks that are experiencing exceptional current price appreciation. They are not intended to be buy recommendations as these stock are extremely volatile and speculative. Should you decide to add one of these stocks to your investment portfolio it is highly suggested you follow a predetermined diversification and moving stop loss discipline that is consistent with your personal investment risk tolerance and reevaluate your stop losses at least on a weekly basis. | 

No comments:
Post a Comment