| Trading recommendations for EUR/USD and GBP/USD pair on 12/07/20 2020-12-07 
Past review of EUR/USD pair Last Friday, the Euro managed to update its local high once again, but the upward movement slowed down after that. What was published on the economic calendar? The report of the US Department of Labor was the main event in terms of statistics, where the unemployment rate fell from 6.9% to 6.7%, which is better than the forecast of 6.8%. The decline in the unemployment rate signals the recovery of the labor market and, as a result, the economy. On the other hand, non-agricultural employment grew by only 245 thousand, while expecting 469 thousand. This is considered the weakest growth in seven months. The discrepancy in employment expectations is not considered the best signal, but huge growth was still observed. The market reaction to the report of the US Department of Labor had a positive effect on the dollar against the euro. What happened on the trading chart? Initially, the quote maintained the upward trend, resulting in an update of the local high at 1.2174 ---> 1.2177. It was followed by a stop within the level of 1.2177, which the market regarded as resistance. As a result, the European currency began to lose its positions, pulling back as much as possible to the level of 1.2110. A high degree of overbought Euro and the decline in the US unemployment rate contributed to the strengthening of the US dollar. 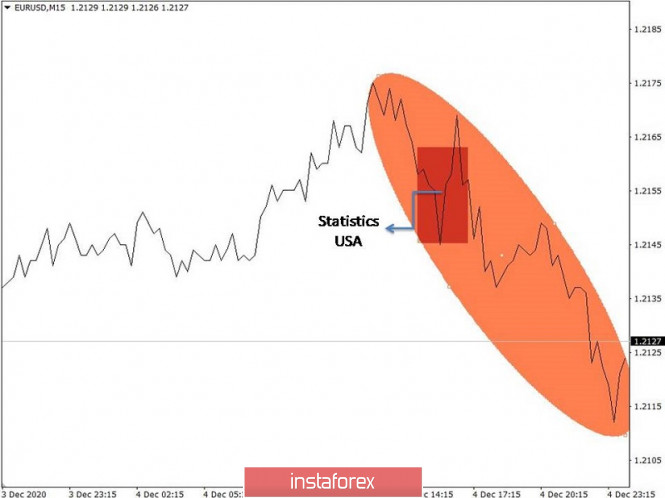
Past review of GBP/USD pair The pound managed to show local upward interest on Friday, but a correction still occurred at the end of the trading day. What was published on the economic calendar? The business activity index in the construction sector was published in the UK, where there was an acceleration from 53.1 points to 54.7 points, instead of an activity slowdown. At the time the statistics was published, the pound was strengthening. As before, the main event was the report of the US Department of Labor, which contributed to the strengthening of the US dollar. What happened on the trading chart? The British currency showed an upward interest at the beginning of the European session. As a result, the quote managed to rise to the level of 1.3537, which led to updating the local highs and reaching the levels of 2018. The overbought pound, paired with the report of the US Department of Labor, led to a slowdown in the upward movement, which resulted in a correction towards the level of 1.3400. A similar result with correction was forecasted in the previous review, which could bring us profit around 70-80 points. 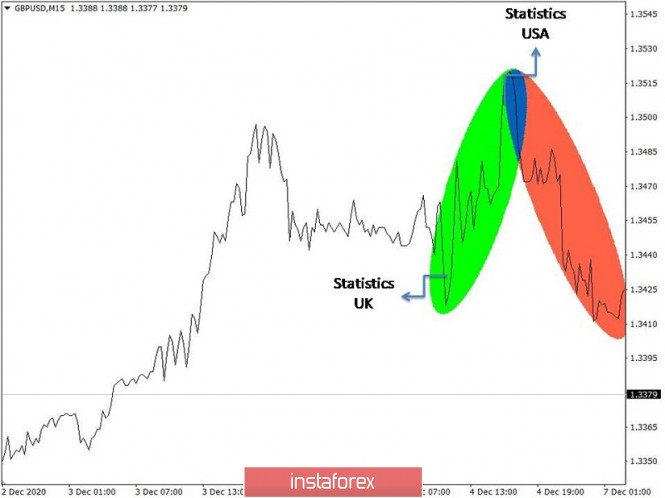
Trading recommendation for EUR/USD on December 7 We do not have any significant statistics for Europe and the United States in today's economic calendar. Therefore, the market will follow technical analysis, as well as the flow of information noise. In terms of technical analysis, the pullback stage from the coordinate 1.2177 can be seen. If the quote manages to consolidate below the level of 1.2100, then moving to a new level in the form of a correction will be possible, with a more impressive decline towards 1.2050-1.2000. It is worth noting that the overbought factor of the European currency still remains on the market. 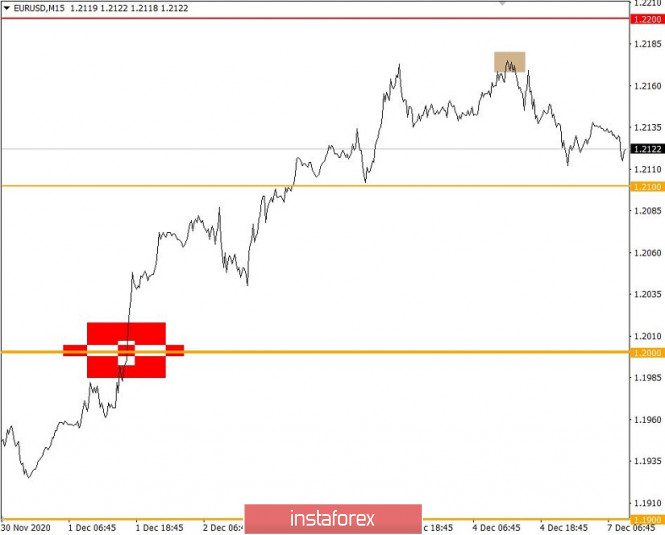
Trading recommendation for GBP/USD on December 7 Considering the economic calendar, statistics from the UK and the United States will not be released today. However, we will pay special attention to the trade negotiations on Brexit. Any positive Brexit news will push the pound upwards, while a negative background on the trade deal will lead to the pound's decline. As for the technical analysis, it can be seen that the previously set correction move from the local high of 1.3537 has already led the quote below the level of 1.3350. If the downward move continues, the quote may further decline to the level of 1.3300, where a rebound will likely occur. 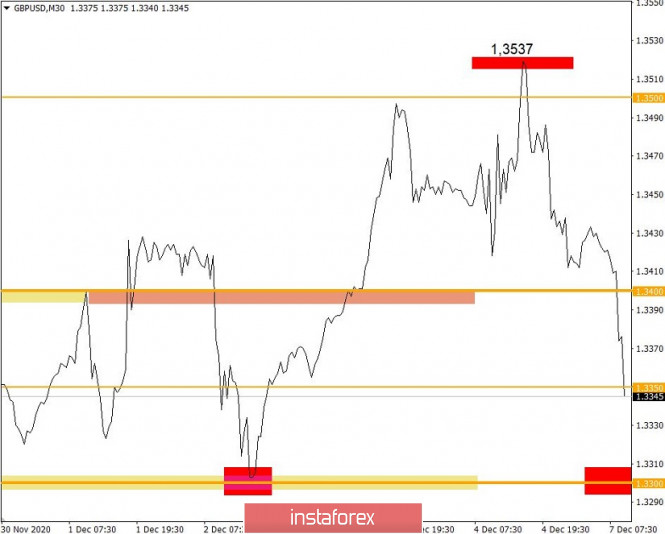
Trading plan for the EUR/USD pair on December 7. New peak in the US market, upward trend in the euro. 2020-12-07 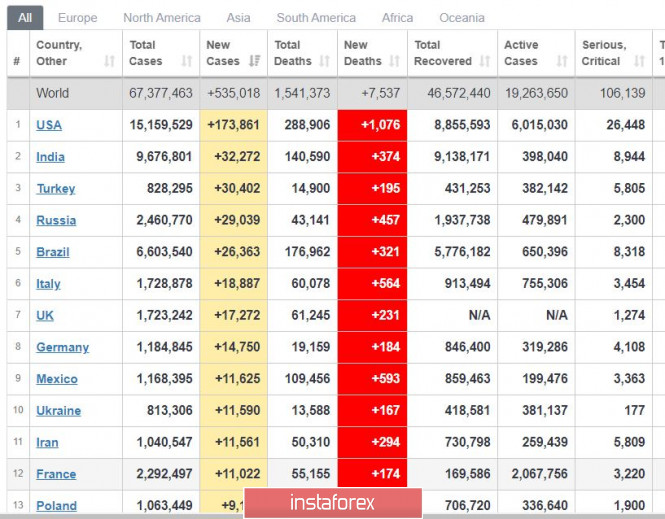
There is a strong pullback in global COVID-19 incidence, but this may be only due to being a weekend. Two days before, infections had risen to 680,000, while yesterday it only to 535,000. A sharp decline was also observed in the United States, as it only recorded around 174,000. However, a decrease can not be confirmed with only data for two to three days, thus, more careful observation is still needed. In Europe, the situation is clearly stabilizing, and this is due to tighter sanitary measures. All these suggest that the second pandemic wave is receding. To add to that, vaccinations are set to begin in the UK next Friday. The US, meanwhile, is still awaiting approval. 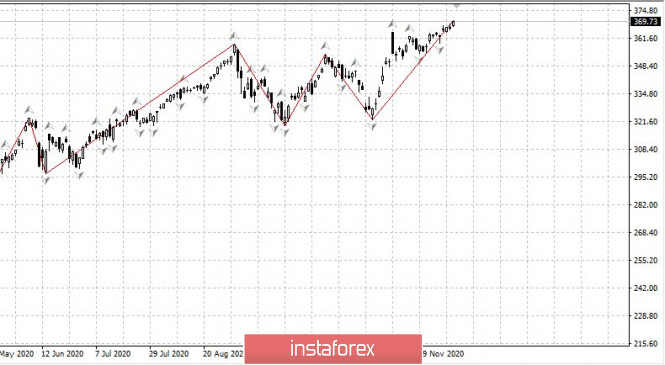
The US market reached a new peak amid expectations of a new stimulus worth $ 900 billion. Such an amount is a lot, about 4% of annual GDP, therefore, JPM analysts predict a further increase in the market. In that regard, positions must be placed very carefully. Buy positions should be opened with downward pullbacks, while sell positions must be opened after a strong decline. 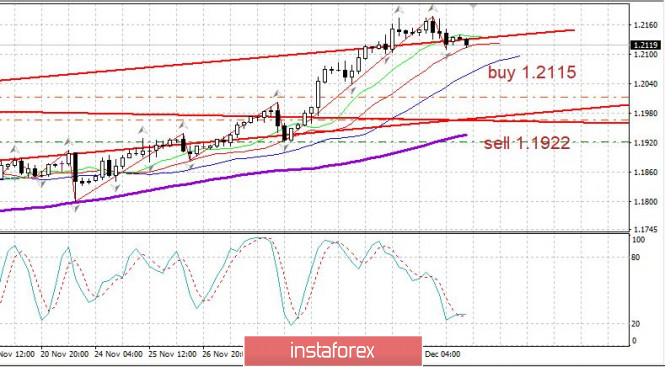
EUR / USD - the euro remains in an upward trend. Keep buying from 1.2012, or from the level of 1.2115. Place stop loss at 1.2055. There is no good level for sales yet. GBP/USD. Sterling dives down: Top politicians joins the Brexit game 2020-12-07 The Brexit process is often compared to a difficult divorce process when the former spouses cannot divide the jointly acquired property for a long time. In my opinion, the similarity in this case is manifested not only in essence, but also in form: the parties have already slammed doors several times and announced the completion of the negotiation process, but in the end, they still returned to dialogue. Thus, on Friday morning, EU negotiator Michelle Barnier and his British counterpart David Frost once again announced that they were ending negotiations that had lasted for a week. A few hours later, British Prime Minister Boris Johnson and the head of the European Commission Ursula von der Leyen agreed to resume the dialogue during a telephone conversation. Both parties sat down at the negotiating table on Sunday. However, on Monday, it became known that the negotiations are again under threat of failure. By and large, on Sunday, the situation has returned to zero. And although this outcome was very predictable, the pound reacted quite violently to the events taking place, reacting sharply to the news flow. So, in the second half of Friday, GBP/USD impulsively broke the 1.3500 mark for the first time since May 2018, amid rumors that the deal will be concluded over the weekend. But at the end of the trading week, the optimistic mood dissipated: the pound again rolled down, stopping at 1.3439. On Monday, the pair started a new trading week with a downward gap. The bearish sentiment still prevails: sellers were able to pull the pair into the area of the 32nd figure, reflecting the panic among investors. 
But there is no need to panic. Such 300-point flights are very typical for the pound sterling when it comes to making key decisions about the prospects of Brexit. Remember the price fluctuations that preceded the general Brexit agreement. At the end of last year, such a heated situation was observed in the currency market: the GBP/USD pair overcame more than a thousand points, rising from the 20th figure to the 32nd price level. This growth was also accompanied by deep price reversals, which were caused by negative rumors around the negotiation process. The situation at present is precisely the same: the deadline is approaching, but there is still no decision on the deal. There are only three weeks left until the end of the transition period, so the market is reacting more sharply to the news flow about the prospects of the negotiation process every day. Even in the absence of news, the market makes certain conclusions. The information vacuum usually plays against the sterling. The fundamental background for the GBP/USD pair is changing at a kaleidoscopic speed: within a day, the pair can go down for several hours against the background of negative rumors, but then impulsively shoot up, reacting to positive comments from officials. Therefore, it is impossible to assess the short-term prospects of the pair: the market is now too susceptible to emotions. But if we talk about the medium-term (and even more so long-term) GBP/USD, in my opinion, the priority remains for long positions. The parties continue to rock the boat, trying to find a compromise in the remaining problematic issues. Differences remain over the institutional framework of the legal framework and governance system (the protection of citizens and businesses on both sides depends on resolving this issue), as well as over the regulation of the fishing industry, in particular the preservation of access to fishing in British waters for European fishermen. At the weekend, the influential publication, The Times, reported that the Europeans agreed to soften their position on the issue of level playing field. According to anonymous sources, the leaders of Germany and France agreed to make certain concessions. However, on Monday morning, the information flow has turned dark. Several news agencies and publications (among them both European and British) reported that the negotiations are under threat of a final breakdown. Initially, it was reported that the most ardent opponent of the British on the Brexit issue, French President Emmanuel Macron, expressed disappointment that the parties could not conclude a deal at the weekend. At the same time, he said he was ready to withdraw from the negotiations and focus on preparing for a Brexit scenario without a trade deal. A little later, the British press reported that Prime Minister Boris Johnson is also ready to refuse further negotiations with the European Union. In addition, according to journalists, every minute counts, that is, by the end of this day, London may withdraw from the negotiation process. In my opinion, now we are seeing a kind of "game of nerves", or rather its continuation. If earlier the heads of negotiating delegations "slammed the doors", now the leaders of states demonstrate the same behavior. Recall that the French have repeatedly left the negotiating table - both in the past years and this year. But in reality, the negotiation process did not stop (except for temporary pauses). At the same time, it is possible that Boris Johnson will actually exit the negotiation process today, thereby raising the stakes in this difficult political game. The reaction of the pound sterling in this case will be extremely negative. The GBP/USD pair may go to the base of the 30th figure or even test the area of the 29th figure. But we can't rule out the possibility that against the background of such intentions of the leaders of Britain and France, the negotiators will be able to outline the contours of compromise solutions. In this case, the pound will return the lost positions in just a few hours. Therefore, at the moment, it is better to take a wait-and-see position, in order to avoid a strong drawdown. 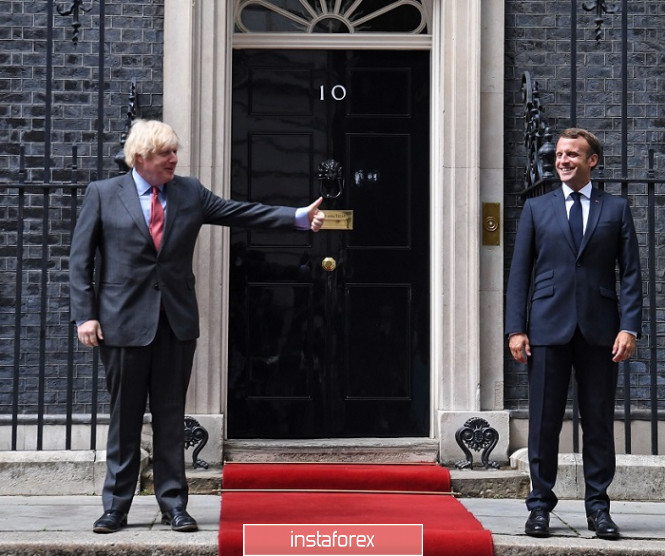
If we talk about medium - and long-term prospects, then a return to the 35th figure is likely. The stronger the spring is compressed,the faster it is then released. Many experts still believe that the parties are, figuratively speaking, bluffing. Only in the run-up to the X-hour, when only a few weeks remain before the end of the transition period, the leaders of states have already joined the game, whereas previously such political maneuvers were performed by the heads of negotiating groups. Thus, for the GBP/USD pair, it is better to take a wait-and-see position at the moment, since the downward corrective impulse is still not over. When the momentum fades, you can consider long positions, counting on the long game (that is, at least we are talking about the average time). Such price reversals are possible in the future, so they must be taken into account when calculating the transaction volume. The target of the upward movement remains the 2.5-year high, which was reached last week – 1.3538. But, I repeat, it is advisable to make trading decisions for the pair after the current downward impulse fades. Trading idea for the EUR/USD pair 2020-12-07 The weakness of the US dollar last week led to an incredible rise in the EUR / USD pair. However, by the end of the week, growth has noticeably decreased, and in the daily chart, two pin bars have formed, which is considered a "bull trap" 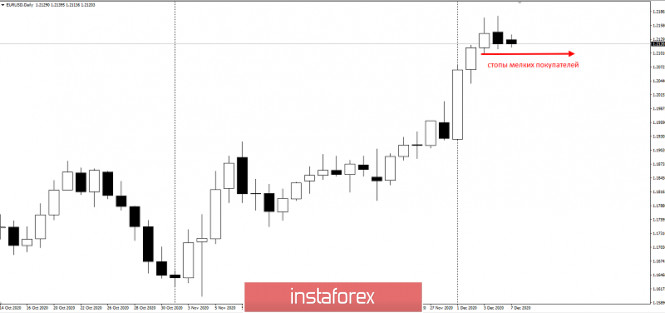 It also appears on the hourly chart, especially if there is an indicator of round levels. Taking this into account, the best thing to do is to work for a decline, following this plan below: 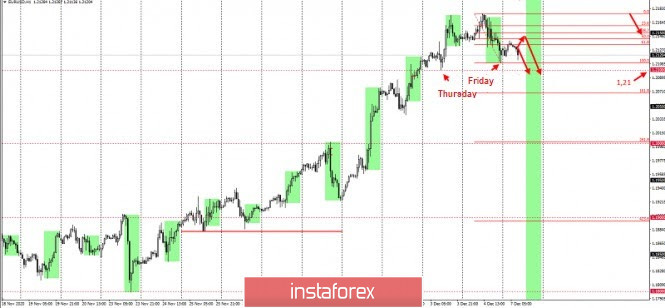 The quotes have already formed three wave patterns, wherein wave "A" was the short initiative last Friday (shown in green). Considering this, short positions should be opened, the aim of which is the breakdown of 1.21. Such follows the classic Price Action and Stop Hunting methods. It also has a risk/profit ratio of 1:1. Of course, traders still need to monitor and control the risks in order to avoid losing money. Trading is very precarious, but also profitable as long as the right approach is used. Good luck! Technical analysis for EUR/USD pair for the week of Dec 7-12, 2020 2020-12-07 Trend analysis The price from the level of 1.2121 (closing of the last weekly candle) may continue to decline this week to the target of 1.1952 – a pullback level of 14.6% (red dotted line). Upon reaching this level, continue to work upwards to the target of 1.2177 (red dashed line) – upper fractal (weekly candle from 11/29/2018). 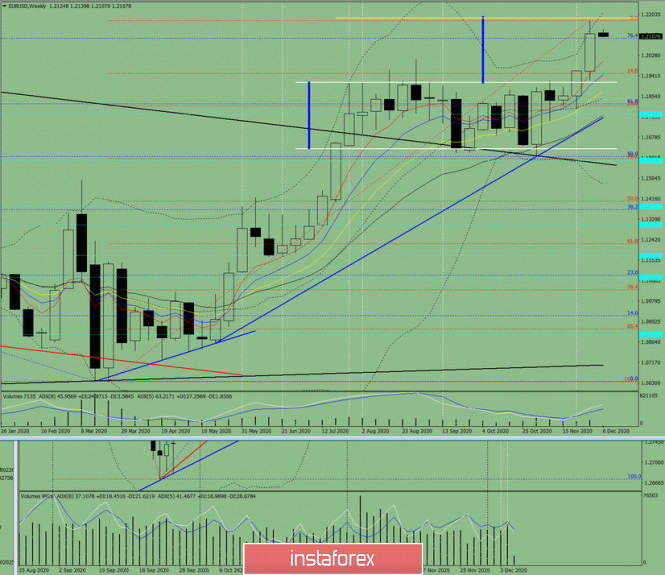
Fig. 1 (weekly chart) Comprehensive analysis: - indicator analysis - down; - Fibonacci levels - down; - volumes - down; - candlestick analysis - down; - trend analysis - down; - Bollinger lines - down; - monthly chart - down. A downward movement can be concluded based on the comprehensive analysis. The overall result of the candlestick calculation on the weekly chart: the price is likely to have a downward trend this week, with no upper shadow in the weekly black candlestick (Monday - down) and no lower shadow (Friday - up). The first downside target is 1.1952 – a pullback level of 14.6% (red dashed line). After reaching this level, the price can move upwards to the target of 1.2177 (red dashed line) – the upper fractal (weekly candle from 11/29/2018). An alternative scenario: the price from the level of 1.2121 (closing of the last weekly candle) can decline to the target of 1.1952 – a pullback level of 14.6% (red dotted line). Upon reaching this level, further decline can be expected to the target of 1.1812 – pullback level of 23.6% (red dotted line). Technical analysis for GBP/USD pair for the week of Dec 7-12, 2020 2020-12-07 Trend analysis The price from the level of 1.3439 (closing of the last weekly candle) is expected to decline this week to the first target of 1.3225 – the pullback level of 14.6% (red dashed line). If this level is reached, it is possible to continue working down to the target of 1.3054 – support line (white thick line). 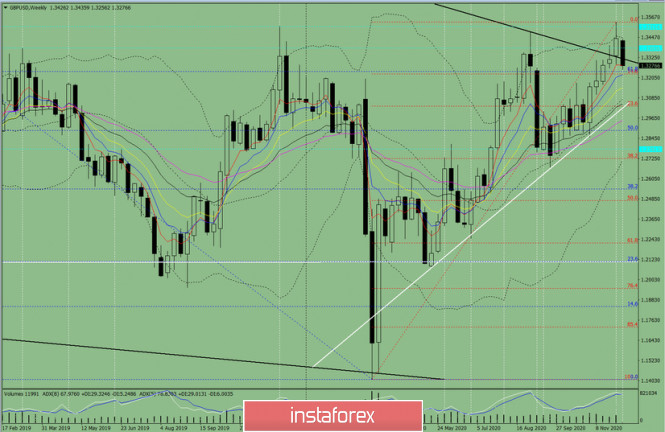
Fig. 1 (weekly chart) Comprehensive analysis: - indicator analysis - down; - Fibonacci levels - down; - volumes - down; - candlestick analysis - down; - trend analysis - down; - Bollinger lines - down; - monthly chart - down. A downward movement can be concluded based on the comprehensive analysis. The overall result of the candlestick calculation on the weekly chart: the price is likely to have a downward trend this week, with no first upper shadow of the weekly black candlestick (Monday - down) and no second lower shadow (Friday - up). The first downside target is 1.3225 – the pullback level of 14.6% (red dotted line). Upon reaching this level, further decline can be considered to the target of 1.3054 – the pullback level of 23.6% (red dotted line). An alternative scenario: the price from the level of 1.3439 (closing of the last weekly candle) may decline to the first target of 1.3225 - a pullback level of 14.6% (red dotted line). After reaching this level, it is possible to work upwards to the target of 1.3538 – the upper fractal (red dotted line). Technical recommendations for EUR/USD and GBP/USD pair on 12/07/20 2020-12-07 EUR / USD 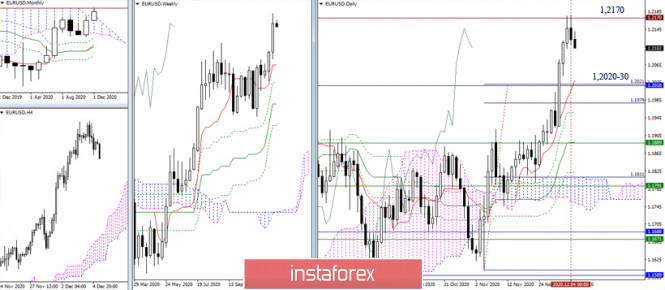 The reached historical resistance level of 1.2170 continues to insist on a longer break and formation of a rebound. If the decline happens, bearish interests will be directed to the area of 1.2120-30 (limit of the monthly cloud + daily Tenkan) in the near future. Further development of the situation depends on the decline rate and the result of reaching the support levels in the area of 1.2120-30. 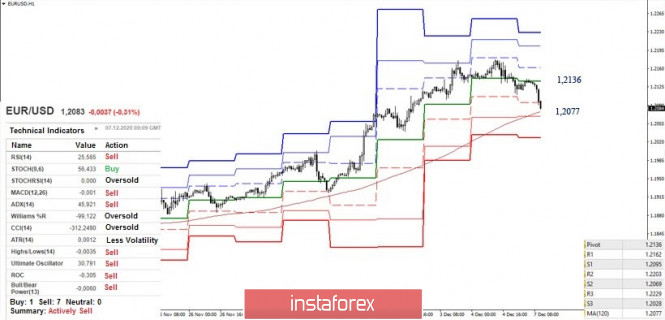 The smaller time frames are actively involved in strengthening the bearish mood. The downward correction has taken hold of the central pivot level and is now seeking to support the weekly long-term trend (1.2077). The bulls losing the moving average and its reversal will transfer all the key advantages to the bears on the hourly time frame. On the other hand, today's intraday target below can still be noted at 1.2028 (S3). In case of slowdown, the central pivot level (1.2136) will be the key resistance at hourly TF today. A consolidation above will affect the current balance of power, while bulls will have a chance to restore the upward trend (1.2177). GBP / USD 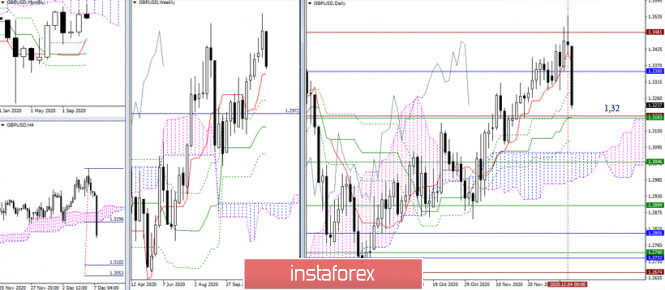 It was for a reason why some weakness of the bulls and the constant opposition of the opponent were well shown during the growth. No matter how much things were tightened, the moment will surely come when it will be forced to loosen up. The activity of the bears today proved this. The further development of the situation depends on bears' ability to remain active and consolidate the result. Now, significant support can be noted around 1.32 (historical level + daily Kijun + weekly Tenkan). 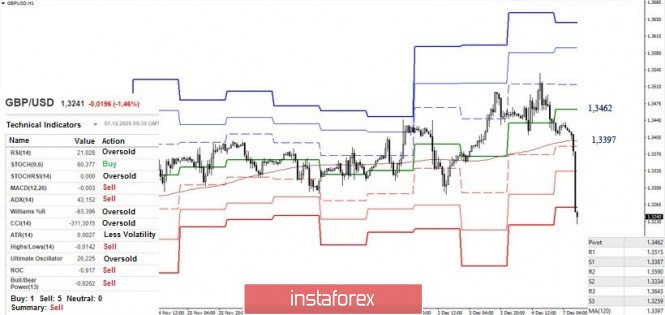 Today, the bears found themselves crowded within the limits of intraday supports of the classic pivot levels, as all support for smaller time frames has been worked out. The level of 1.32 is now the downward pivot point, where the combined supports of the bigger time frames formed their influence and attraction zone. On the other hand, the current key resistances of the smaller TFs can be noted at 1.3397 (weekly long-term trend) and 1.3462 (central pivot level). Ichimoku Kinko Hyo (9.26.52), Pivot Points (classical), Moving Average (120) Technical analysis of GBP/USD for December 07, 2020 2020-12-07 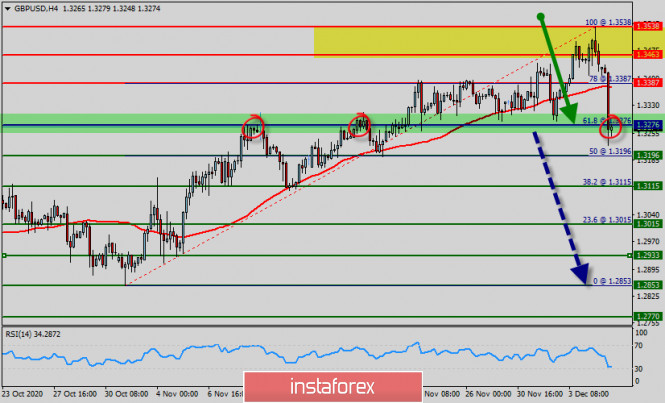 Overview : The GBP/USD pair has tumbled down, sending momentum on the four-hour chart to negative territory. The GBP/USD pair fell from the level of 1.3538 to bottom at 1.3260 this morning. Today, the GBP/USD pair has faced strong support at the level of 1.3196. The weekly pivot point has already set at the point of 1.3276. The British pound sterling continues to trade downtrend from market's opening. Price action is not making any new lows, leading to a consolidation. The support level near 1.3276 is holding up for the moment. However, if price action succeeds near this support, then we could expect to see some strong declines. On the other hand, the fall was so sharp that it also pushed the RSI (Relative Strength Index to 30) – on the verge of oversold conditions. So, the strong resistance has already faced at the level of 1.3387 and the pair is likely to try to approach it in order to test it again and form a double top. Hence, the GBP/USD pair is continuing to trade in a bearish trend from the new support level of 1.3276; to form a bearish channel. According to the previous events, we expect the pair to move between 1.3387 and 1.3196. Also, it should be noted major resistance is seen at 1.3538, while immediate resistance is found at 1.3387. Then, we may anticipate potential testing of 1.3387 to take place soon. For the moment, the consolidation is taking place between the trendline resistance and the horizontal support. Moreover, if the pair fails in passing through the level of 1.3387, the market will indicate a bearisg opportunity below the level of 1.3387. A breakout of that target will move the pair further downwards to 1.3196. Sell orders are recommended below the area of 1.3387 - 1.3300 with the first target at the level of 1.3196; and continue towards 1.3115. If the GBP/USD pair succeeds to break out through the support level of 1.3115; the market will decline further to the level of 1.2853 so as to test the weekly double bottom. Nevertheless, stop loss should always be taken into account, accordingly, it will be of beneficial to set the stop loss above the last bullish wave at the level of 1.3540. Technical analysis of EUR/USD for December 07, 2020 2020-12-07 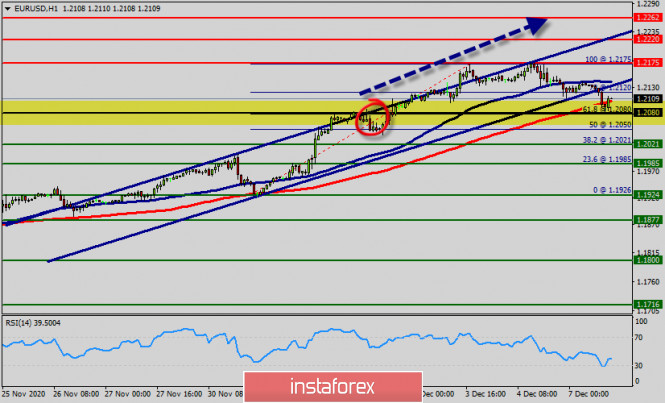 Overview : - Pair : EUR/USD.
- Pivot : 1.2080.
A move higher could take the pair until the double top at 1.2175, a challenging point over the last week. Higher resistance could next be found around the 1.2175 barrier, taken from the peak on September 3rd, 2020. The pair is trading above its pivot point. It is likely to trade in a higher range as long as it remains above the pivot point (1.2080). The RSI holds above 40, while the Moving average continues to strengthen in bullish territory above its trigger line. The EUR/USD pair faced resistance at the level of 1.2175, while minor resistance is seen at 1.2120. Support is found at the levels of 1.2021 and 1.1985. Also, it should be noted that a daily pivot point has already set at the level of 1.2080. Equally important, the EUR/USD pair is still moving around the key level at 1.2080, which represents a daily pivot in the H1 time frame at the moment. The EUR/USD pair will probably continue to move upwards from the level of 1.2080 We guess that the pair will rise from the level of 1.2080 to the top around 1.2175. The level of 1.2021 is expected to act as major support today. From this point, we expect the EUR/USD pair to continue moving in the bullish trend from the support level of 1.2021 towards the target level of 1.2175. If the pair succeeds in passing through the level of 1.2175, the market will indicate the bullish opportunity above the level of 1.2175 in order to reach the second target at 1.2220. Amid the previous events, the price is still moving between the levels of 1.2080 and 1.2220. In overall, we still prefer the bulish scenario as long as the price is above the level of 1.2220. Moreover, in larger time frames the trend is still bullish as long as the level of 1.2080 is not breached. On the other hand, in case a reversal takes place and the EUR/USD pair breaks through the support level of 1.2021, a further decline to 1.1924 can occur which would indicate a bearish market. Forecast If the pair fails to pass through the level of 1.2080 (support, pivot, 61.8% Fibonacci) , the market will indicate a bullish opportunity above the strong support level of 1.2080. In this regard, buy deals are recommended higher than the 1.2080 level with the first target at 1.2175. It is possible that the pair will turn upwards continuing the development of the bullish trend to the level 1.2220. The third resistance hasy already placed at the 1.2262 price. However, stop loss has always been in consideration thus it will be useful to set it below the last bearish wave at the level of 1.2021 (notice that the major support today has set at 1.1985). Technical analysis of GBP/USD for December 07, 2020 2020-12-07 Overview : The GBP/USD pair has tumbled down, sending momentum on the four-hour chart to negative territory. The GBP/USD pair fell from the level of 1.3538 to bottom at 1.3260 this morning. Today, the GBP/USD pair has faced strong support at the level of 1.3196. The weekly pivot point has already set at the point of 1.3276. The British pound sterling continues to trade downtrend from market's opening. Price action is not making any new lows, leading to a consolidation. The support level near 1.3276 is holding up for the moment. However, if price action succeeds near this support, then we could expect to see some strong declines. On the other hand, the fall was so sharp that it also pushed the RSI (Relative Strength Index to 30) – on the verge of oversold conditions. So, the strong resistance has already faced at the level of 1.3387 and the pair is likely to try to approach it in order to test it again and form a double top. Hence, the GBP/USD pair is continuing to trade in a bearish trend from the new support level of 1.3276; to form a bearish channel. According to the previous events, we expect the pair to move between 1.3387 and 1.3196. Also, it should be noted major resistance is seen at 1.3538, while immediate resistance is found at 1.3387. Then, we may anticipate potential testing of 1.3387 to take place soon. For the moment, the consolidation is taking place between the trendline resistance and the horizontal support. Moreover, if the pair fails in passing through the level of 1.3387, the market will indicate a bearisg opportunity below the level of 1.3387. A breakout of that target will move the pair further downwards to 1.3196. Sell orders are recommended below the area of 1.3387 - 1.3300 with the first target at the level of 1.3196; and continue towards 1.3115. If the GBP/USD pair succeeds to break out through the support level of 1.3115; the market will decline further to the level of 1.2853 so as to test the weekly double bottom. Nevertheless, stop loss should always be taken into account, accordingly, it will be of beneficial to set the stop loss above the last bullish wave at the level of 1.3540. Gold remains vulnerable 2020-12-07 Gold price last week tried to reach the important resistance area of $1,850 that was once major support. Price got rejected and turned lower. As we explained in our last analysis, Gold price is expected to pull back towards $1,814 at least. Today the first important short-term support at $1,820 was tested. 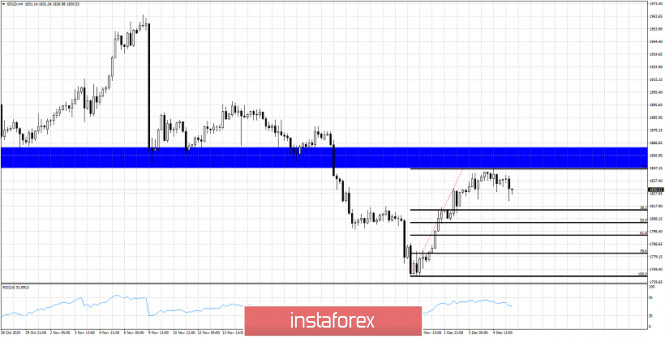
Blue rectangle - major resistance area Black lines -Fibonacci levels Gold price started the week under pressure with price reaching lower towards $1,820. Support was respected and Gold price is now again at $1,830. Gold price remains below key resistance and we prefer to short any bounce as long as price is below $1,850. If support at $1,820 is broken we expect price to reach $1,815 and then $1,795-$1,800 which is the most important short-term support level. EUR/USD analysis for December 07 2020 - Potential completion of the downside correction and start of the new up cyccle 2020-12-07 Brexit: von der Leyen to speak with Boris Johnson later today; negotiations could continue until Wednesday The latest on the Brexit news front European Commission president, Ursula von der Leyen, is to speak with UK prime minister, Boris Johnson, later today at 1600 GMT. Just be aware of the timing in case we hear of anything substantial after that. Adding to tat, RTE's Tony Connelly also reports that talks could stretch on until Wednesday this week, citing EU chief negotiator, Michel Barnier: BREAKING: The EU's chief negotiator has told MEPs that negotiations on a post-Brexit deal could continue until Wednesday but no further. Further Development 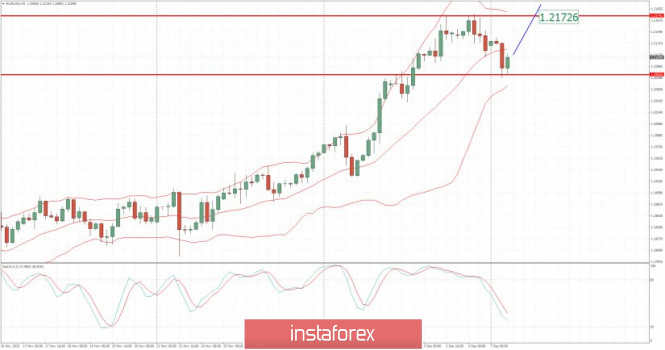
Analyzing the current trading chart of EUR, I found that sellers got exhausted this morning and that we might see upside continuation. 1-Day relative strength performance Finviz 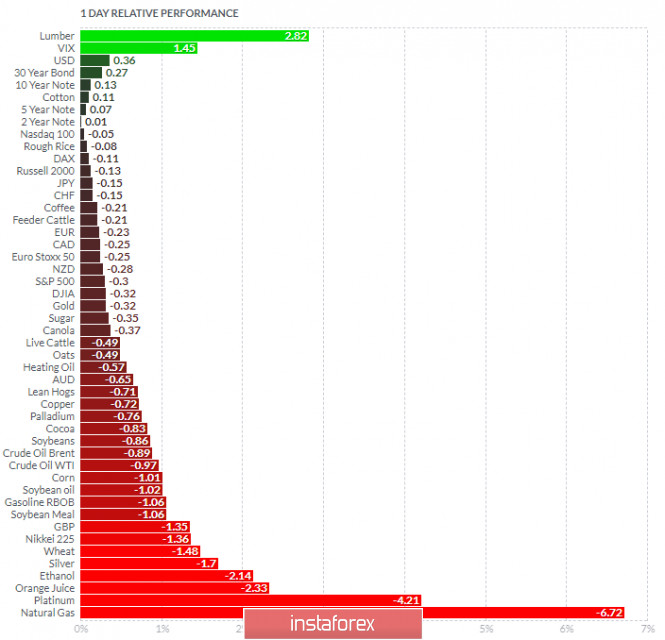
Based on the graph above I found that on the top of the list we got Lumber and VIX today and on the bottom Nattural Gas and Platinum. Key Levels: Resistance: 1,2175 Support levels: 1,2075 Analysis of Gold for December 07,.2020 - Potential completion of the bigger ABC correction. Upside opportunities in play.... 2020-12-07 Japan's new stimulus package reportedly worth about £73.6 trillion Bloomberg reports, citing a document on the package Fiscal measures are to comprise around £40 trillion, partly financed by £19.2 trillion in spending from a third extra budget. This is a bit on the higher end of reports on what ruling party lawmakers are calling for in terms of new measures. 
Further Development 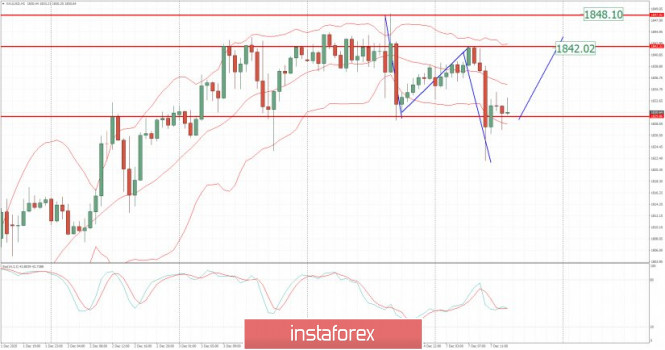
Analyzing the current trading chart of Gold, I found that there is potential for the completion of the ABC downside correction and new upwave to begin. 1-Day relative strength performance Finviz 
Based on the graph above I found that on the top of the list we got Lumber and VIX today and on the bottom Natural Gas and Platinum. Gold is slightly negative today on the list but with potential for upside continuation. Key Levels: Resistance: $1,834, $1,842 and $1,848 Support levels: $1,822
Author's today's articles: Vladislav Tukhmenev  Vladislav graduated from Moscow State University of Technologiy and Management. He entered the forex market in early 2008. Vladislav is a professional trader, analyst, and manager. He applies a whole gamut of analysis – technical, graphical, mathematical, fundamental, and candlestick analysis. Moreover, he forecasts the market movements using his own methods based on the chaos theory. Vladimir took part in development of trading systems devoted to fractal analysis. In his free time, Vladimir blogs about exchange markets. Hobbies: active leisure, sporting shooting, cars, design, and marketing. "I do not dream only of becoming the best in my field. I also dream about those who I will take with me along the way up." Vladislav graduated from Moscow State University of Technologiy and Management. He entered the forex market in early 2008. Vladislav is a professional trader, analyst, and manager. He applies a whole gamut of analysis – technical, graphical, mathematical, fundamental, and candlestick analysis. Moreover, he forecasts the market movements using his own methods based on the chaos theory. Vladimir took part in development of trading systems devoted to fractal analysis. In his free time, Vladimir blogs about exchange markets. Hobbies: active leisure, sporting shooting, cars, design, and marketing. "I do not dream only of becoming the best in my field. I also dream about those who I will take with me along the way up." Mihail Makarov  - - Irina Manzenko  Irina Manzenko Irina Manzenko Andrey Shevchenko  Andrey Shevchenko Andrey Shevchenko Sergey Belyaev  Born December 1, 1955. In 1993 graduated from Air Force Engineering Academy. In September 1999 started to study Forex markets. Since 2002 has been reading lectures on the technical analysis . Is fond of research work. Created a personal trading system based on the indicator analysis. Authored the book on technical analysis "Calculation of the next candlestick". At present the next book is being prepared for publishing "Indicator Analysis of Forex Market. Trading System Encyclopedia". Has created eleven courses on indicator analysis. Uses classical indicators. Works as a public lecturer. Held numerous seminars and workshops presented at international exhibitions of financial markets industry. Is known as one of the best specialists in the Russian Federation researching indicator analysis. Born December 1, 1955. In 1993 graduated from Air Force Engineering Academy. In September 1999 started to study Forex markets. Since 2002 has been reading lectures on the technical analysis . Is fond of research work. Created a personal trading system based on the indicator analysis. Authored the book on technical analysis "Calculation of the next candlestick". At present the next book is being prepared for publishing "Indicator Analysis of Forex Market. Trading System Encyclopedia". Has created eleven courses on indicator analysis. Uses classical indicators. Works as a public lecturer. Held numerous seminars and workshops presented at international exhibitions of financial markets industry. Is known as one of the best specialists in the Russian Federation researching indicator analysis. Zhizhko Nadezhda  Graduated from Irkutsk State University. Having acquainted with Forex market in 2008, followed the courses in the International Academy of Stock Exchange Trading. The agenda was so exiting that she moved to St. Petersburg in order to get professional education. Obtained a diploma of the retraining course on the discipline Exchange market and stock market issues, defended the graduation paper with distinction on the subject "Modern technical indicators as the basis of the trading system". At the moment obtains a master degree in International Banking Institute on specialty Financial markets and investments. Apart from trading is occupied with development of trading systems and formalization of the working strategies using Ichimoku indicator. At the moment is working on the book dedicated to the peculiarities of Ichimoku indicator and its operating methods. Interests: yoga, literature, travelling and photograph. "You can only get smarter by playing a smarter opponent" Basics of Chess play, 1883 "Successful people change by themselves, the others are changed by life" Jim Rohn Graduated from Irkutsk State University. Having acquainted with Forex market in 2008, followed the courses in the International Academy of Stock Exchange Trading. The agenda was so exiting that she moved to St. Petersburg in order to get professional education. Obtained a diploma of the retraining course on the discipline Exchange market and stock market issues, defended the graduation paper with distinction on the subject "Modern technical indicators as the basis of the trading system". At the moment obtains a master degree in International Banking Institute on specialty Financial markets and investments. Apart from trading is occupied with development of trading systems and formalization of the working strategies using Ichimoku indicator. At the moment is working on the book dedicated to the peculiarities of Ichimoku indicator and its operating methods. Interests: yoga, literature, travelling and photograph. "You can only get smarter by playing a smarter opponent" Basics of Chess play, 1883 "Successful people change by themselves, the others are changed by life" Jim Rohn Mourad El Keddani  Was born in Oujda, Morocco. Currently lives in Belgium. In 2003 obtained B.S. in Experimental Sciences. In 2007 obtained a graduate diploma at Institut Marocain Specialise en Informatique Applique (IMSIA), specialty – Software Engineering Analyst. In 2007–2009 worked as teacher of computer services and trainer in a professional school specializing in computer technologies and accounting. In 2005 started Forex trading. Authored articles and analytical reviews on Forex market on Forex websites and forums. Since 2008 performs Forex market research, and develops and implements his own trading strategies of Forex analysis (especially in Forex Research & Analysis, Currency Forecast, and Recommendations and Analysis) that lies in: Numerical analysis: Probabilities, equations and techniques of applying Fibonacci levels. Classical analysis: Breakout strategy and trend indicators. Uses obtained skills to manage traders' accounts since 2009. In April 2009 was certified Financial Technician by the International Federation of Technical Analysts. Winner of several social work awards: Education Literacy and Non-Formal Education (in Literacy and Adult Education in The National Initiative for Human Development). Was born in Oujda, Morocco. Currently lives in Belgium. In 2003 obtained B.S. in Experimental Sciences. In 2007 obtained a graduate diploma at Institut Marocain Specialise en Informatique Applique (IMSIA), specialty – Software Engineering Analyst. In 2007–2009 worked as teacher of computer services and trainer in a professional school specializing in computer technologies and accounting. In 2005 started Forex trading. Authored articles and analytical reviews on Forex market on Forex websites and forums. Since 2008 performs Forex market research, and develops and implements his own trading strategies of Forex analysis (especially in Forex Research & Analysis, Currency Forecast, and Recommendations and Analysis) that lies in: Numerical analysis: Probabilities, equations and techniques of applying Fibonacci levels. Classical analysis: Breakout strategy and trend indicators. Uses obtained skills to manage traders' accounts since 2009. In April 2009 was certified Financial Technician by the International Federation of Technical Analysts. Winner of several social work awards: Education Literacy and Non-Formal Education (in Literacy and Adult Education in The National Initiative for Human Development).
Languages: Arabic, English, French and Dutch.
Interests: Algorithm, Graphics, Social work, Psychology and Philosophy. Alexandros Yfantis  Alexandros was born on September 14, 1978. He graduated from the ICMA Centre, University of Reading with the MSc in International Securities, investment and Banking in 2001. In 2000, Alexandros got the BSc in Economics and Business Finance from Brunel University, UK. In 2004, he began trading on the Greek stock market, where Alexandros got a specialization in international derivatives. Alexandros Yfantis has worked in a top financial company in Greece, responsible for the day-to-day running of the International markets department. He is a certified Portfolio Manager and a certified Derivatives Trader. Alexandros is also a contributor and analyst using Elliott wave and technical analysis of global financial markets. In 2007, he started Forex trading. He loves his profession and believes that entering a trade should always be accompanied by money management rules. His goal is to find profitable opportunities across the markets while minimizing risk and maximizing potential profit. "I'm still learning" Michelangelo Alexandros was born on September 14, 1978. He graduated from the ICMA Centre, University of Reading with the MSc in International Securities, investment and Banking in 2001. In 2000, Alexandros got the BSc in Economics and Business Finance from Brunel University, UK. In 2004, he began trading on the Greek stock market, where Alexandros got a specialization in international derivatives. Alexandros Yfantis has worked in a top financial company in Greece, responsible for the day-to-day running of the International markets department. He is a certified Portfolio Manager and a certified Derivatives Trader. Alexandros is also a contributor and analyst using Elliott wave and technical analysis of global financial markets. In 2007, he started Forex trading. He loves his profession and believes that entering a trade should always be accompanied by money management rules. His goal is to find profitable opportunities across the markets while minimizing risk and maximizing potential profit. "I'm still learning" Michelangelo Petar Jacimovic  Petar was born on July 08, 1989 in Serbia. Graduated from Economy University and after has worked as a currency analyst for large private investors. Petar has been involved in the world of finance since 2007. In this trading he specializes in Volume Price Action (volume background, multi Fibonacci zones, trend channels, supply and demand). He also writes the market analytical reviews for Forex forums and websites. Moreover Petar is forex teacher and has wide experience in tutoring and conducting webinars. Interests : finance, travelling, sports, music "The key to success is hard work" Petar was born on July 08, 1989 in Serbia. Graduated from Economy University and after has worked as a currency analyst for large private investors. Petar has been involved in the world of finance since 2007. In this trading he specializes in Volume Price Action (volume background, multi Fibonacci zones, trend channels, supply and demand). He also writes the market analytical reviews for Forex forums and websites. Moreover Petar is forex teacher and has wide experience in tutoring and conducting webinars. Interests : finance, travelling, sports, music "The key to success is hard work"
Subscription's options management Theme's:
Fundamental analysis, Fractal analysis, Wave analysis, Technical analysis, Stock Markets
Author's :
A Zotova, Aleksey Almazov, Alexander Dneprovskiy, Alexandr Davidov, Alexandros Yfantis, Andrey Shevchenko, Arief Makmur, Dean Leo, Evgeny Klimov, Fedor Pavlov, Grigory Sokolov, I Belozerov, Igor Kovalyov, Irina Manzenko, Ivan Aleksandrov, l Kolesnikova, Maxim Magdalinin, Mihail Makarov, Mohamed Samy, Mourad El Keddani, Oleg Khmelevskiy, Oscar Ton, Pavel Vlasov, Petar Jacimovic, R Agafonov, S Doronina, Sebastian Seliga, Sergey Belyaev, Sergey Mityukov, Stanislav Polyanskiy, T Strelkova, Torben Melsted, V Isakov, Viktor Vasilevsky, Vladislav Tukhmenev, Vyacheslav Ognev, Yuriy Zaycev, Zhizhko Nadezhda
Edit data of subscription settings
Unsubscribe from the mailing list Sincerely,
Analysts Service | If you have any questions, you can make a phone call using one of the
InstaForex Toll free numbers right now:
|  | InstaForex Group is an international brand providing online trading services to the clients all over the world. InstaForex Group members include regulated companies in Europe, Russia and British Virgin Islands. This letter may contain personal information for access to your InstaForex trading account, so for the purpose of safety it is recommended to delete this data from the history. If you have received this letter by mistake, please contact InstaForex Customer Relations Department. |


No comments:
Post a Comment