| Technical analysis of AUD/USD for December 02, 2020 2020-12-02 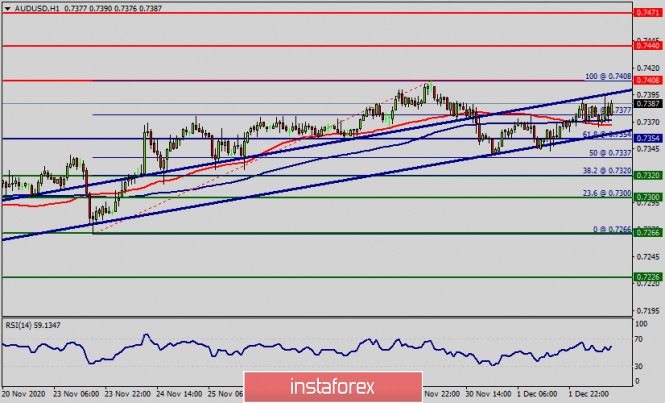 Overview : The AUD/USD pair has strongly broken above the 0.7354 resistance zone (61.8% Fibonacci retracement). Yesterday's daily candle was large which indicates that the bulls remain in control. So, the AUD/USD pair is holding onto gains above the level of 0.7354. A trade through the December 1 main top at 0.7408 will signal a resumption of the uptrend. The AUD/USD pair has reached the powerful resistance and target zone at 0.7408 - current price sets at 0.7379. Traders will be keying in on 1.2011 throughout the session on Wednesday. This is a potential trigger point for an acceleration to the upside since there is no true resistance until about 0.7408 - 0.7379. The AUD/USD pair continues moving in a bullish trend from the support levels of 0.7320 and 0.7354. Currently, the price is in a bullish channel. This is confirmed by the RSI indicator signaling that we are still in a bullish trending market. As the price is still above the moving average (100), immediate support is seen at 0.7354, which coincides with a golden ratio (61.8% of Fibonacci). On the H1 chart, resistance is seen at the levels of 0.7408 and 0.7440. Also, it should be noticed that, the level of 0.7354 represents the daily pivot point. Consequently, the first support is set at the level of 0.7354. So, the market is likely to show signs of a bullish trend around the spot of 0.7354. In other words, buy orders are recommended above the golden ratio (0.7354) with the first target at the level of 0.7408. Furthermore, if the trend is able to breakout through the first resistance level of 0.7408. We should see the pair climbing towards the double top (0.7440) to test it. The AUD/USD pair is continuing in a bullish trend from the resistance of 0.7440. According to the previous events, we expect the AUD/USD pair to move between 0.7354 and 0.7440. The third resistance has already placed at 0.7471. It would also be wise to consider where to place a stop loss; this should be set below the second support of 0.7300. On the other hand, in case a reversal takes place and the AUD/USD pair breaks through the support level of 0.7300, a further decline to 0.7226 can occur which would indicate a bearish market. EUR/USD. Beware of motion sickness 2020-12-02 The EUR/USD pair has updated this year's high once again, approaching the borders of the 1.21 level. And although the upward impulse faded during the Asian session, traders are still bullish. The pair was last seen at these price heights in early 2018, when the multi-year high of 1.2555 was reached. After that, the buyers of EUR/USD began to gradually lose their positions – at least, they have not returned to such highs since then. However, the current fundamental background allows traders to show revengeful intentions. From September to November, the indicated pair fluctuated in a wide range of 1.1620-1.1850, alternately starting from the limits of this range. However, it swung to the level of 1.19 last month, and now, the price was seen getting near the level of 120. The buyers of the pair took advantage of the weakness of the US currency, the general market interest in risky assets and the silence of the ECB. All these factors combined allowed EUR/USD bulls not only to break through the psychological important price level of 1.2000, but also hold its position here, which indicates the growth of the upward trend. However, the higher the EUR/USD pair climbs, the higher the risk of developing motion sickness, which has become the reason why the Euro weakened more than once. 
The European Central Bank does not actually need an overvalued euro. Amid yesterday's release on the growth of European inflation, the current surge in the EUR/USD pair looks more like mocking the ECB members, who blame the overvalued exchange rate of the euro in regards to the slowing inflation processes. Therefore, the European regulator will probably follow the corresponding reaction in the near future, as it already did in early September. The general consumer price index in November remained at the level of October, that is, at the level of -0.3%. The indicator is in the negative area for four consecutive months and, judging by the ECB forecasts, it will stay below zero for several more months. The core CPI index was also at the October level, that is, at around 0.2%. There are many reasons for this weak inflationary dynamics. In particular, almost all EU countries, especially Germany, Italy, Spain, France significantly tightened quarantine restrictions up to a complete lockdown in November. Therefore, economic activity has slowed down, while in contrast, the unemployment rate has increased. As soon as the first reports of repeated lockdowns appeared in the press, European's consumer activity noticeably declined. However, the EUR/USD pair only formally reacted to yesterday's release, which was immediately followed by the resumption of growth. All this suggests that the upward trend of the main currency pair is primarily due to the weakness of the US currency, while the euro's interest is just a secondary factor. It is worth recalling here that as soon as the pair reached the level of 1.20 in September, the European Central Bank immediately became worried. In particular, ECB's Chief Economist, Philip Lane, said that the current euro rate is unacceptable for the Central Bank. Such rhetoric alarmed traders: rumors spread throughout the market that the regulator would conduct a currency intervention to devalue the single currency. As a result, the pair dropped to the level of 1.17 and 1.16 respectively. There is no doubt that the ECB will react to the euro's growth in the same way this time. For this to happen, the ECB members will need to directly scare the market with currency intervention. Otherwise, the negative reaction of traders will be short-term. And while the Euro zone has a positive trade balance, and the dollar index is updating two and a half year lows, it will be quite difficult to stop the upward trend of the EUR/USD pair. At the same time, it should be noted that there is nothing can be done about the downward pullback in prices, since the overvalued euro exchange rate will be criticized so much by the ECB amid weak inflation. 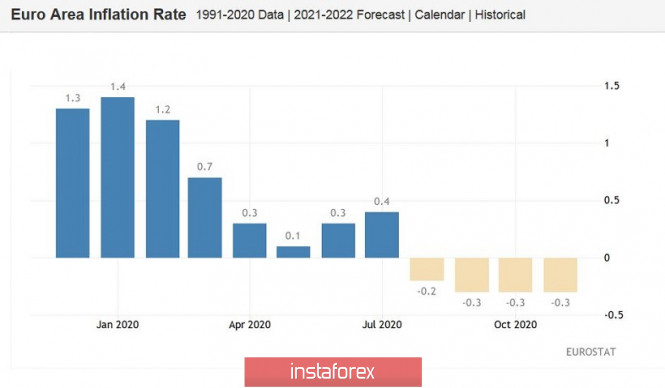
However, even if this threat is ignored, it should be noted that as a rule, a correction follows after such impulse growth. The "dovish" rhetoric of the ECB members will only strengthen the correctional movement, which is up to the level of 1.2005 (Tenkan-sen line in the four-hour time frame). If the bears manage to move below this target, then the upward scenario will lose its relevance in the medium term. Alternatively, if buyers keep the level of 1.20, then they will provoke another wave of longs. Therefore, it is currently advisable to take a wait-and-see attitude on the pair. Firstly, the upward impulse has already faded and secondly, it is necessary to assess the depth of the corrective pullback. If the pair does not go below the level of 1.2000 in the next day, long positions can be considered, at least to the updated high of 1.2088. In this situation, the level of 1.20 acts as a kind of point in regards to the prospects for the upward trend in the medium term. Trading idea for gold 2020-12-02  An interesting event took place on gold yesterday. Trades have triggered a bullish absorption, which is one of the strongest reversal signals in the Price Action system and candlestick analysis. 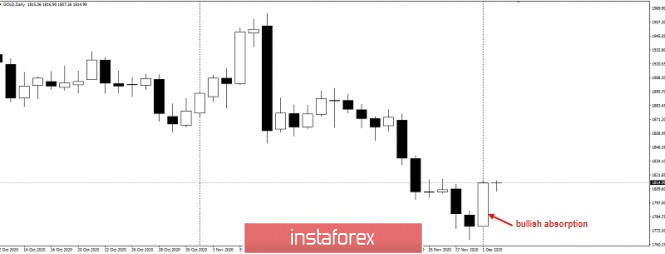 Such a scenario suggests that sellers are now in a classic trap and are forced to hide risks at 1818: 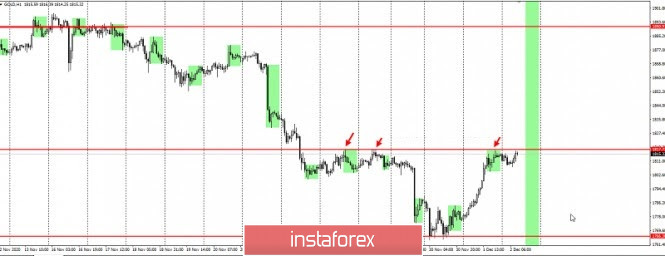 Taking this into account, the best strategy right now is to increase the price, which can be done by following this plan: 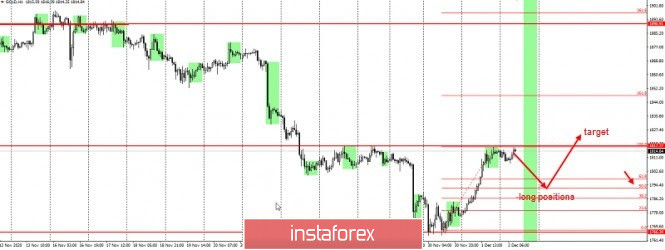 Since the quotes have formed three wave structures (ABC), in which wave "A" is yesterday's absorption at D1, long positions should be opened at 61.8% and 50% Fibonacci retracement levels. But if you want to sell gold, do it only after the quote falsely breaks out of 1818. This follows the classic Price Action and Stop Hunting strategies. Good luck! GBP/USD analysis on December 2. UK and EU still cannot arrive at an agreement and continue to blame each other for the lack of a deal 2020-12-02 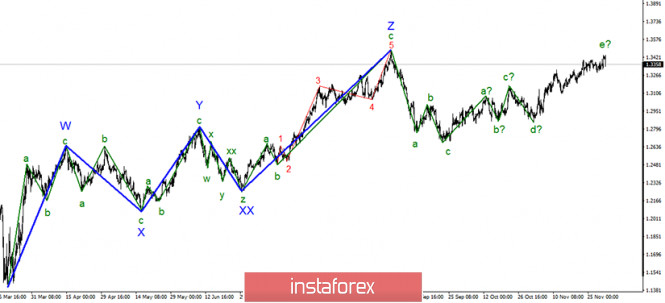
In the most global terms, the construction of the upward section of the trend continues, but the wave marking takes a complex form and may become complicated more than once. The section of the trend that originated on September 23 took a five-wave form, but not an impulse one. A successful attempt to break the previous peak indicates that the markets are ready for further purchases of the British pound. The supposed wave e has also assumed a five-wave form and may be nearing its end. At the same time, the level of demand for the British pound and the news background are now a priority. 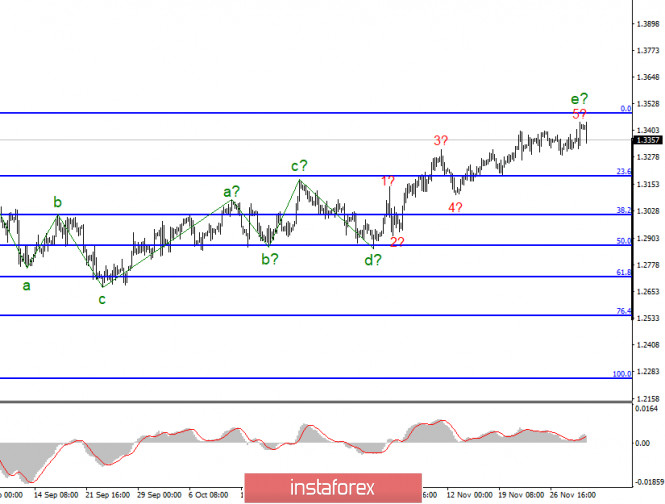
The a-b-c-d-e waves of the upward trend section are clearly shown on the lower chart. The assumed wave e took a five-wave form, which is also visible on the chart. But even with this complication, it is nearing completion. Even if the entire upward section of the trend continues its construction and complication, now three waves should be built down, since we clearly see the top five on the chart. Despite the completed form of the wave e, the pound sterling continues to be in demand in the foreign exchange market. Thus, it seems that the news background supports the British at this time, but this is absolutely not the case in reality. Trade negotiations are ongoing, but there is still no positive information. The British pound continues to increase, although even the wave markings have long indicated the need to build a downward set of waves. But nothing can be done about it. If markets continue to invest in the pound, it will continue to rise. However, there is a huge amount of negative information. Many analysts believe that negotiations on a trade agreement have once again reached an impasse. The EU has said that the UK will have to adhere to European market rules after the completion of Brexit. London said the EU wants too much. There are still "serious differences" over fishing in British waters. France says it will not give up on the fish issue. Meanwhile, the transition period is less than a month away. Top British officials reiterated that the European Union wants to exert as much influence as possible on their country, while Britain wants to gain full independence and total control over its territories and waters. Therefore, the markets can only wait to see how everything will end. Yesterday, several economic reports were also released but did not attract the attention of the markets. Business activity in the manufacturing sector in Britain was almost unchanged compared to the value of October. In America, a similar report showed a deterioration, but it still remained at a very high level, which does not cause concerns for the US manufacturing sector. Today, markets can pay attention to the ADP report in America, as well as Jerome Powell's speech to Congress. Although his second speech is unlikely to differ much in content from the first. Also, the markets are still not too interested in all this news and events. General conclusions and recommendations: The pound-dollar instrument continues to build an upward trend, but its last wave is nearing completion. Thus, now I recommend looking closely at the sales of the instrument, however, there are still no clear signals about the end of the upward section of the trend from the British. Considering the uncertainty associated with the trade deal and the current wave markup, purchases of the instrument are now quite dangerous. Technical analysis of GBP/USD for December 02, 2020 2020-12-02 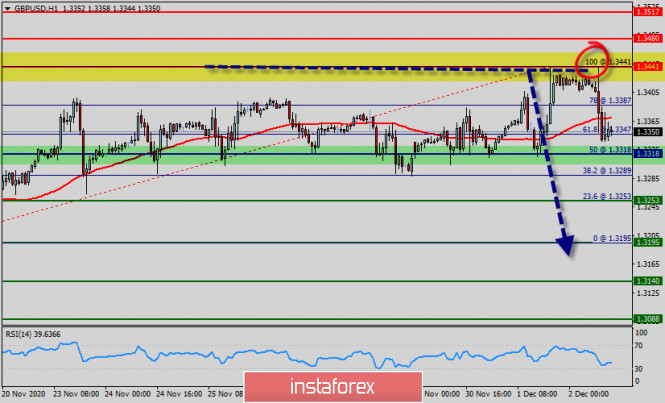 Overview : The GBP/USD pair faced a strong resistance at the level of 1.3441, while minor resistance is seen at 1.3387. Support is found at the levels of 1.3318 and 1.3253. This resistance (1.3441) has been rejected two times confirming the veracity of a downtrend. The pair is trading below its double top (1.3441). It is likely to trade in a lower range as long as it remains below the double top. Short positions are recommended with the first target at 1.3318. A break of that target will move the pair further downwards to 1.3253 (S2). Also, it should be noted that a daily pivot point has already set at the level of 1.3318. Equally important, the GBP/USD pair is still moving around the key level at 1.3318, which represents a daily pivot in the H1 time frame at the moment. Yesterday, the GBP/USD pair continued to move downwards from the level of 1.3441. The pair fell from the level of 1.3441 (this level of 1.3441 coincides with the double top) to the bottom around 1.3346. In consequence, the GBP/USD pair broke support , which turned minor resistance at the level of 1.3387. The level of 1.3441 is expected to act as major support today. From this point, we expect the GBP/USD pair to continue moving in the bearish trend from the resistance level of GBP/USD towards the target level of 1.3318. If the pair succeeds in passing through the level of 1.3318, thus, the maket is indicating a bearish opportunity below the 1.3318 level so it will be a good sign to sell at 1.3318 with the second target of 1.3253. It will also call for a downtrend in order to continue towards 1.3195. The daily strong support is seen at 1.3195. Notwithstanding, if a breakout happens at the support level of 1.3441, then this scenario may be invalidated. However, the stop loss should always be taken into account, for that it will be reasonable to set your stop loss at the price of 1.3480.
Author's today's articles: Mourad El Keddani  Was born in Oujda, Morocco. Currently lives in Belgium. In 2003 obtained B.S. in Experimental Sciences. In 2007 obtained a graduate diploma at Institut Marocain Specialise en Informatique Applique (IMSIA), specialty – Software Engineering Analyst. In 2007–2009 worked as teacher of computer services and trainer in a professional school specializing in computer technologies and accounting. In 2005 started Forex trading. Authored articles and analytical reviews on Forex market on Forex websites and forums. Since 2008 performs Forex market research, and develops and implements his own trading strategies of Forex analysis (especially in Forex Research & Analysis, Currency Forecast, and Recommendations and Analysis) that lies in: Numerical analysis: Probabilities, equations and techniques of applying Fibonacci levels. Classical analysis: Breakout strategy and trend indicators. Uses obtained skills to manage traders' accounts since 2009. In April 2009 was certified Financial Technician by the International Federation of Technical Analysts. Winner of several social work awards: Education Literacy and Non-Formal Education (in Literacy and Adult Education in The National Initiative for Human Development). Was born in Oujda, Morocco. Currently lives in Belgium. In 2003 obtained B.S. in Experimental Sciences. In 2007 obtained a graduate diploma at Institut Marocain Specialise en Informatique Applique (IMSIA), specialty – Software Engineering Analyst. In 2007–2009 worked as teacher of computer services and trainer in a professional school specializing in computer technologies and accounting. In 2005 started Forex trading. Authored articles and analytical reviews on Forex market on Forex websites and forums. Since 2008 performs Forex market research, and develops and implements his own trading strategies of Forex analysis (especially in Forex Research & Analysis, Currency Forecast, and Recommendations and Analysis) that lies in: Numerical analysis: Probabilities, equations and techniques of applying Fibonacci levels. Classical analysis: Breakout strategy and trend indicators. Uses obtained skills to manage traders' accounts since 2009. In April 2009 was certified Financial Technician by the International Federation of Technical Analysts. Winner of several social work awards: Education Literacy and Non-Formal Education (in Literacy and Adult Education in The National Initiative for Human Development).
Languages: Arabic, English, French and Dutch.
Interests: Algorithm, Graphics, Social work, Psychology and Philosophy. Irina Manzenko  Irina Manzenko Irina Manzenko Andrey Shevchenko  Andrey Shevchenko Andrey Shevchenko Alexander Dneprovskiy  Graduated from Kiev State University of Economics. On Forex market since 2007. Started his work at Forex as a trader. Since 2008 is working as a currency analyst. Graduated from Kiev State University of Economics. On Forex market since 2007. Started his work at Forex as a trader. Since 2008 is working as a currency analyst.
Subscription's options management Theme's:
Fundamental analysis, Fractal analysis, Wave analysis, Technical analysis, Stock Markets
Author's :
A Zotova, Aleksey Almazov, Alexander Dneprovskiy, Alexandr Davidov, Alexandros Yfantis, Andrey Shevchenko, Arief Makmur, Dean Leo, Evgeny Klimov, Fedor Pavlov, Grigory Sokolov, I Belozerov, Igor Kovalyov, Irina Manzenko, Ivan Aleksandrov, l Kolesnikova, Maxim Magdalinin, Mihail Makarov, Mohamed Samy, Mourad El Keddani, Oleg Khmelevskiy, Oscar Ton, Pavel Vlasov, Petar Jacimovic, R Agafonov, S Doronina, Sebastian Seliga, Sergey Belyaev, Sergey Mityukov, Stanislav Polyanskiy, T Strelkova, Torben Melsted, V Isakov, Viktor Vasilevsky, Vladislav Tukhmenev, Vyacheslav Ognev, Yuriy Zaycev, Zhizhko Nadezhda
Edit data of subscription settings
Unsubscribe from the mailing list Sincerely,
Analysts Service | If you have any questions, you can make a phone call using one of the
InstaForex Toll free numbers right now:
|  | InstaForex Group is an international brand providing online trading services to the clients all over the world. InstaForex Group members include regulated companies in Europe, Russia and British Virgin Islands. This letter may contain personal information for access to your InstaForex trading account, so for the purpose of safety it is recommended to delete this data from the history. If you have received this letter by mistake, please contact InstaForex Customer Relations Department. |


No comments:
Post a Comment