| EUR/USD: Euro and the US dollar are both strengthening their positions 2020-12-17  The dynamics of the major currencies – US dollar and euro, continued to stay in the forecasted range. The regulators did not bring surprises to the markets, so the upward movement of the EUR/USD pair was quite expected. Before the meeting, a lot of experts are concerned about the dollar's possible collapse. A similar scenario was assumed in the event of fundamental changes in the Fed's current strategy, but this did not happen. They held the target rate of Federal funding in the range of 0-0.25%, coinciding with the forecast of economists. It should be recalled that it remained in this range since March 2020. Therefore, Fed's representatives expected this near-zero rate to be maintained until the end of 2023. At the same time, the current monetary policy aimed at supporting the US economy remained the same. The FRS will continue its massive financial injections and the adoption of new stimuli until a clear progress is observed on key economic indicators, such as employment and inflation. Currently, the US Congress is developing another package of support measures in the amount of $ 900 billion. This measure includes direct payments to Americans of $600 per adult and $600 per child. It is possible that this bill will be submitted before the end of the week, as Congressmen go on vacation from Saturday, December 19. Following the meeting, the Fed retained the previous structure of securities repurchase, not giving preference to long ones. At the same time, the monthly volume of purchases of bonds remained within $120 billion. According to the regulator, this is necessary for positive changes, that is, to successfully reach employment and inflation targets in the United States. Another important task for the Fed is to increase monthly investments in treasury bonds by $80 billion, and by $40 billion per month in agency mortgage securities. The US dollar started rising after the meeting. It has strengthened for the first time in a long time, after being supported by the growth in the yield of Treasury bonds. Late Wednesday evening, the dollar slowed down against the euro in the EUR/USD pair after it rose to the level of 1.2161, sharply gaining impulse. On Thursday morning, the EUR/USD pair continued its upward trend, moving around the range of 1.2230-1.2231. 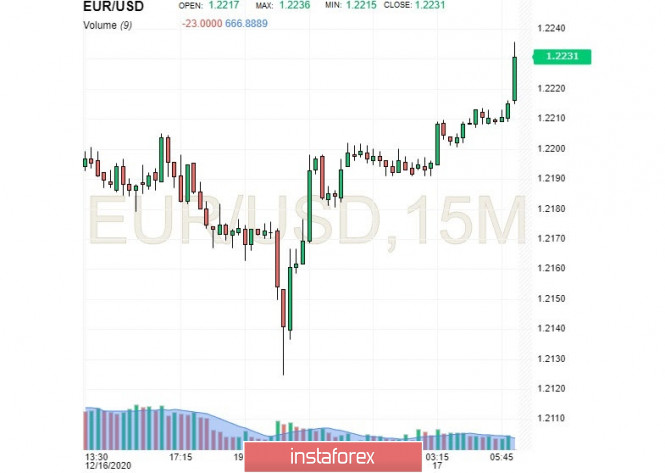 Currency strategists at Wells Fargo believe that the US currency will continue to strengthen against the European one in the near future. Nevertheless, the euro also does not stand aside, strengthening its position. Analysts are sure that it is unlikely for the euro to decline in the current planning range. According to experts, the EUR/USD pair will maintain a relative balance in the medium term, since both of them are slowly rising, without interfering with each other. They believe that it will only be broken if something surprises the market. AUD/USD. Green report on the Australian labor market and a drawback from China 2020-12-17 During the Asian session today, key data on the growth of the labor market in Australia was published. Despite the fairly strong numbers that came out in the green zone, the reaction of the Australian Dollar was relatively mild. The AUD/USD pair only approached the boundaries of the 76th figure but did not test this price level. The deterrent was China, which continues to wage a cold war with Canberra. However, in my opinion, this fact should not confuse traders. The upward trend is still in force and today, the currency received an important trump card which will still play a role in the foreseeable future.  So, let's turn to the numbers. The preliminary forecast was quite cautious as experts assumed that unemployment in November will remain at 7% which is at the level seen in October. Aside from this, they predicted that there will be growth in the number of employed people by 40 thousand– due to the growth of the part-time employment component (which is a negative factor). But the real numbers were much better than the predicted values. First, the unemployment rate dropped to 6.8%. The last time the indicator was at this level was in August, after which it showed an increase for two months against the background of the second wave of Coronavirus in the country and the corresponding quarantine restrictions. In November, Australia completely came out of quarantine. After this, the labor market began to gain momentum. This fact is confirmed by another indicator which is the increase in the number of employees. Instead of the predicted 40,000 increase, the indicator jumped to 90,000. This increased happened most importantly by increasing the full employment component. As you know, full-time positions offer a higher level of salary and a higher level of social security compared to temporary part-time jobs. This factor affects the dynamics of wage growth and indirectly affects the dynamics of inflationary growth. According to today's data release, the full-time component increased by 84,000 and the part-time component by 6,000. It is also worth noting that in the green zone, there was an indicator of the share of the economically active population. From the previous value of 65.8%, it rose to 66.1%. These are the best results since August last year. Today's release is important not only in the context of the short and medium term growth prospects of the AUD/USD pair, but also in the long-term. At the last meeting of the year, members of the Central Bank expressed concern that labor market indicators are recovering at an uneven pace. According to the calculations of the Central Bank's economists, even at such an optimistic pace, the country will need years for unemployment tol go back to the pre-crisis level which is in the range of 4.5-5.2%. Also, RBA members were concerned about the growth of part-time employment. The Reserve Bank of Australia has indicated that if the labor market does not show signs of a sustained recovery in the foreseeable future, the regulator will consider expanding the stimulus program. In the context of such events, the data published today are quite important. It can be assumed that if such dynamics continue, the regulator will not rush to expand QE in the foreseeable future. Despite a fairly positive data, the Australian Dollar paired with the US Dollar only came to the borders of the 76th figure but did not attempt to make an impulse movement on this target. The fact is that China acts as a kind of anchor for the AUD/USD pair. Yesterday, the country officially announced an embargo on coal imports from Australia. It is worth noting that such a decision is not unexpected. Back in early October, steel mills in China received an official verbal notice to stop importing Australian coal which led to a drop in the price of marine coking coal. According to sources, Australia has been replaced by Mongolia as the leading supplier of coking coal to China. Yesterday, Beijing announced the embargo on an official level. Coal is Australia's third-largest export commodity so shares in Australian clean coal exporters fell sharply. However, the foreign exchange market reacted to the latest news quite calmly. This fact only prevented AUD/USD buyers from conquering the 76th figure with an impulse growth. Despite all the anti-Australian decisions, Beijing has not banned iron ore. This raw material product is strategically important for the Australian economy so its absence from the Chinese black list is perceived as a positive fundamental factor. Moreover, China is increasing its ore imports (including from Australia) and the cost of a ton of this raw material has already exceeded the $150 mark. 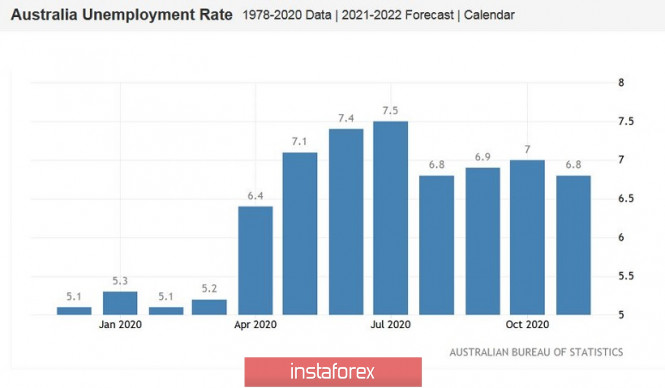 Thus, the upward trend of the AUD/USD pair is still in force. From a technical point of view, the pair, on all higher timeframes (from H4 and above), is on the upper line of the Bollinger Bands Indicator. This tells us that priority is on the upward movement of the pair. On the H4 to W1 timeframes, except for the monthly chart, the Ichimoku Indicator has formed a bullish signal when the price is above all the indicator lines. This also includes the Kumo cloud. This signal indicates bullish sentiment. The strongest resistance level is at 0.7620. This is the upper line of the Bollinger Bands on the monthly chart. It is important for buyers to overcome this target in order to gain a foothold within the 76th figure. EUR/USD: plan for the European session on December 17. COT reports. Fed's decision only temporarily strengthened the dollar. Bulls are focused on surpassing 1.2211 2020-12-17 To open long positions on EUR/USD, you need: Wednesday was on the side of the buyers, and the Federal Reserve's decision did not make it possible for the dollar to accumulate in order to somehow influence the upward trend of risky assets. Let's take a look at the 5-minute chart and figure out where you can and should enter the market. In my morning forecast, I paid attention to long deals above 1.2164, which is what happened. A breakout and being able to test this range from top to bottom produced a signal to open long positions, its goal was to reach a high of 1.2211, where the bulls actually pulled the pair. The euro sharply grew after we received good data on the services sector in the euro area, also amid speculative sellers removing several stop orders, who were found above the 1.2164 level. Several unsuccessful attempts to surpass 1.2211 led to forming a false breakout and a downward correction to the 1.2164 area. We managed to surpass this level after the Fed announced its decision on interest rates, but we did not get a convenient entry point into short positions. 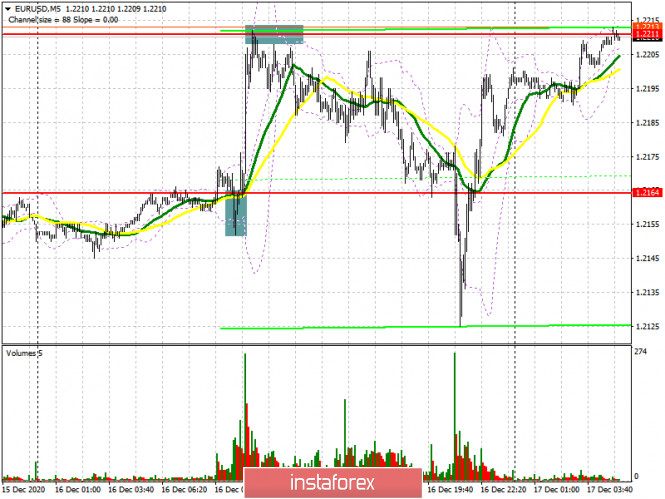
Despite the high volatility of EUR/USD, the pair returned to the 1.2211 area in today's Asian session, where trading is currently underway. In the first half of the day, the entire focus will shift to data on eurozone inflation, which may strengthen the euro, if it turns out to be better than economists' forecasts. Buyers need to surpass the 1.2211 level. Testing it from top to bottom will open a direct road to a new high of 1.2255, with the prospect of updating 1.2297, where I recommend taking profits. The 1.2339 area will be the target at the end of the week. In case the bulls are not active in the 1.2211 area and EUR/USD is under pressure after this data is released, it is best to postpone long deals until support has been updated at 1.2164. Forming a false breakout there will result in producing another signal to open long positions. If buyers fail to protect this area, you can only open long positions in EUR/USD on a rebound after the 1.2110 low has been tested, counting on an upward correction of 20-25 points within the day. To open short positions on EUR/USD, you need: Pound sellers are currently focused on protecting the 1.2211 level, where the upward movement stalled yesterday. Forming a false breakout there in the first half of the day, along with weak eurozone inflation in November, produces a signal to open short positions, the main goal of which is to return EUR/USD to the 1.2164 level. There will be a very big battle for this area, just like yesterday. Being able to settle in this area and testing it from the bottom up will lead to a larger sell-off, to a low of 1.2110 which is where I recommend taking profits. In case of a breakout and EUR/USD settles above 1.2211 in the afternoon, it is best to postpone new short positions until a larger resistance at 1.2255 has been tested. I recommend selling EUR/USD immediately on a rebound from the high of 1.2297, or even higher, from the 1.2339 area, counting on a downward correction of 15-20 points within the day. 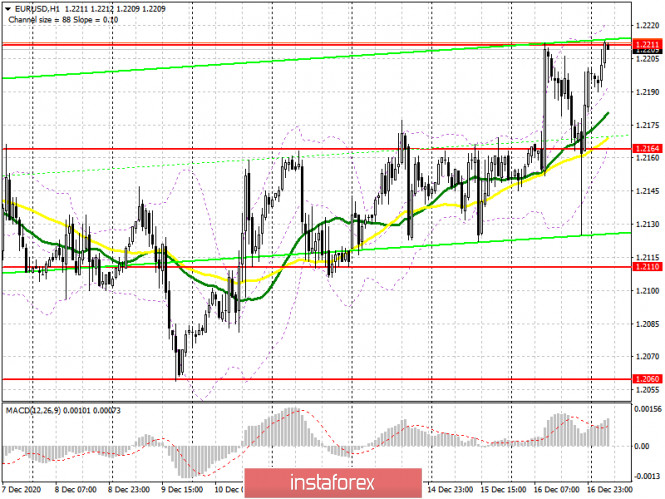
The Commitment of Traders (COT) report for December 8 recorded an increase in long positions and a reduction in short positions. Buyers of risky assets believe in sustaining the bull market and the euro's growth after surpassing the psychological mark in the area of the 20th figure. Thus, long non-commercial positions rose from 207,302 to 222,521, while short non-commercial positions fell from 67,407 to 66,092. The total non-commercial net position rose from 139,894 to 156,429 a week earlier. It is worth paying attention to the growth of the delta, observed for the third consecutive week, which completely negates the bearish trend observed at the beginning of this fall. We can only speak of a larger recovery after European leaders negotiate a new trade agreement with Britain. Indicator signals: Moving averages Trading is carried out slightly above 30 and 50 moving averages, which indicates buyers' attempt to sustain the upward trend in the euro. Note: The period and prices of moving averages are considered by the author on the H1 hourly chart and differs from the general definition of the classic daily moving averages on the D1 daily chart. Bollinger Bands A breakout of the upper border of the indicator in the 1.2211 area will lead to a new upward movement for the euro. A breakout of the lower border of the indicator in the 1.2164 area will increase pressure on the pair and cause the euro to fall. Description of indicators - Moving average (moving average, determines the current trend by smoothing out volatility and noise). Period 50. It is marked in yellow on the chart.
- Moving average (moving average, determines the current trend by smoothing out volatility and noise). Period 30. It is marked in green on the chart.
- MACD indicator (Moving Average Convergence/Divergence — convergence/divergence of moving averages) Quick EMA period 12. Slow EMA period to 26. SMA period 9
- Bollinger Bands (Bollinger Bands). Period 20
- Non-commercial speculative traders, such as individual traders, hedge funds, and large institutions that use the futures market for speculative purposes and meet certain requirements.
- Long non-commercial positions represent the total long open position of non-commercial traders.
- Short non-commercial positions represent the total short open position of non-commercial traders.
- Total non-commercial net position is the difference between short and long positions of non-commercial traders.
GBP/USD: plan for the European session on December 17. COT reports. Bank of England meeting on monetary policy will not lead to major changes in the market 2020-12-17 To open long positions on GBP/USD, you need: Before talking about today's Bank of England meeting, let's see what transactions we had in the afternoon. I have marked four points on the 5-minute chart for entering the market. After a second return and a test of resistance at 1.3534, a signal to open long positions appeared, but, unfortunately, it was not realized, afterwards the pair moved below this area again. When the 1.3534 level was being tested from the bottom up, it was possible and necessary to sell the pound. This signal led to a large sell-off in the 1.3475 area. Towards the middle of the US session, the bears tried to take this level for themselves and even settled below it, which resulted in producing a new entry point for short positions, the movement down was around 25 points. After GBP/USD returned to the 1.3475 level after the Federal Reserve announced its decision on interest rates, this area was tested from top to bottom, which became a signal to open long positions. Now we have returned to the resistance area of 1.3534 and everything needs to start over. 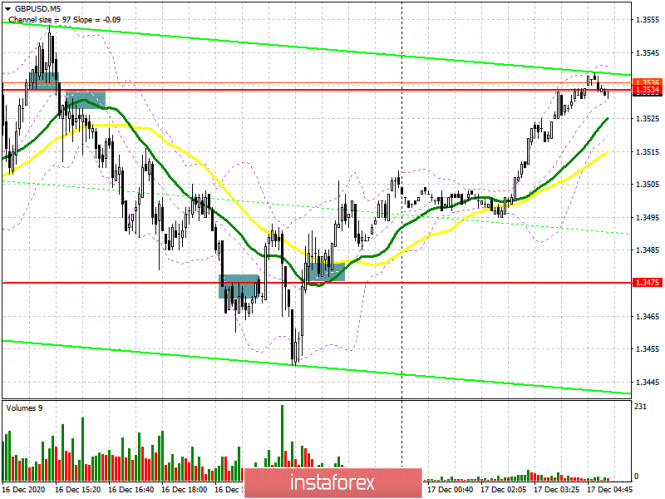
The main task in the first half of the day is to surpass and settle above the resistance of 1.3550. A downward test of this level produces a good signal to open new long positions in sustaining the pound's growth, which will allow the pair to go beyond the wide horizontal channel, which is where it has stayed since the beginning of December. The nearest target will be resistance at 1.3604, surpassing it will quickly push the pair to the 1.3648 and 1.3698 areas, where I recommend taking profits. However, before buying the pound, you need to remember that the Bank of England will announce its decision on interest rates. Many expect the monetary policy to remain unchanged. Any unexpected statements in this regard could result in the pound's decline. Therefore, if GBP/USD is under pressure after the meeting, I recommend taking a closer look at long deals from the 1.3476 level, subject to forming a false breakout there. It is possible to buy GBP/USD immediately on a rebound from the low of 1.3406, counting on a correction of 20-30 points within the day. There are also moving averages, which play on the side of buyers. You should also pay attention to the bearish divergence, which has formed on the MACD indicator. If it persists after yesterday's high has been updated, and the pound does not actively rise above this level, it is better to leave long positions, since all this can lead to producing a false buy signal. To open short positions on GBP/USD, you need: Based on what we are seeing in the market right now, only bad news on the Brexit trade agreement can significantly pull down GBP/USD. The pound can not crash as long as the bull market is underway in all its glory and investors firmly believe that the negotiators will be able to find a compromise. Sellers currently need to form a false breakout in the resistance area of 1.3550, since this area leaves the last hope for the pound's fall in the short term. But if the pound does not actively fall after this, then it is better not to go against the trend, but to wait for the BoE's decision on interest rates and the renewal of resistance at 1.3604, from where you can sell the pound immediately on a rebound, counting on a correction of 20-30 points within the day. Larger resistance levels are seen around 1.3648 and 1.3698. An equally important task for the bears in the first half of the day will be to regain control over the 1.3476 level, which will seriously affect the positions of pound buyers. Getting the pair to settle in this area and testing it from the bottom up produces a good sell signal, the main goal is for the pair to fall towards 1.3406 and 1.3345, where I recommend taking profits. 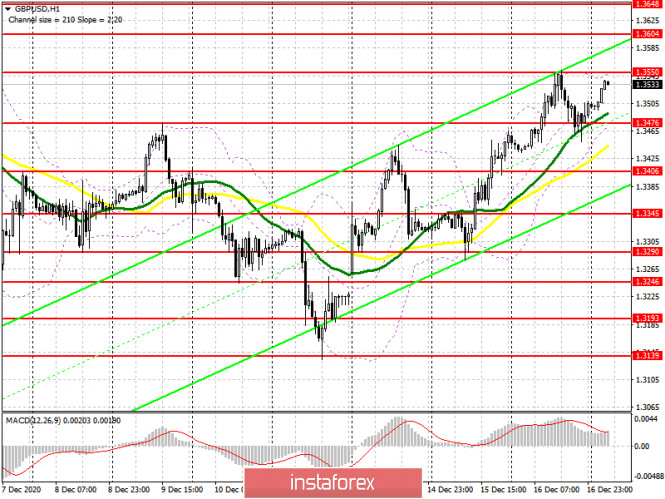
The Commitment of Traders (COT) reports for December 8 notes significant interest in the British pound. Long non-commercial positions rose from 37,087 to 39,344. At the same time, short non-commercial positions decreased from 44,986 to 33,634. As a result, the non-commercial net position became positive and jumped to 5,710 against a negative value of -7,899 a week earlier. All this suggests that traders are ready to bet on the pound's succeeding growth at the beginning of 2021 and on the buyers' advantage in the current situation even when there is no trade deal at the moment, and take note that there is just around two weeks left until the end of the year. Indicator signals: Moving averages Trading is carried out above 30 and 50 moving averages, which indicates the continued recovery of the pound in the short term. Note: The period and prices of moving averages are considered by the author on the H1 chart and differs from the general definition of the classic daily moving averages on the D1 daily chart. Bollinger Bands A breakout of the upper border of the indicator in the 1.3550 area will lead to a new wave of growth for the pound. A break of the lower border of the indicator in the 1.3476 area will increase the pressure on the pound. Description of indicators - Moving average (moving average, determines the current trend by smoothing out volatility and noise). Period 50. It is marked in yellow on the chart.
- Moving average (moving average, determines the current trend by smoothing out volatility and noise). Period 30. It is marked in green on the chart.
- MACD indicator (Moving Average Convergence/Divergence — convergence/divergence of moving averages) Quick EMA period 12. Slow EMA period to 26. SMA period 9
- Bollinger Bands (Bollinger Bands). Period 20
- Non-commercial speculative traders, such as individual traders, hedge funds, and large institutions that use the futures market for speculative purposes and meet certain requirements.
- Long non-commercial positions represent the total long open position of non-commercial traders.
- Short non-commercial positions represent the total short open position of non-commercial traders.
- Total non-commercial net position is the difference between short and long positions of non-commercial traders.
Indicator analysis. Daily review for the EUR/USD currency pair on 17/12/2020 2020-12-17 Trend analysis (Figure 1). Today, from the level of 1.2198 (the closing of yesterday's daily candle), the market can continue to move up with the target of 1.2274 which is a pullback level of 85.4% (yellow dotted line). After testing this level, continue to work upwards with the target of 1.2342 which is the upper limit of the Bollinger Line Indicator (black dotted line). 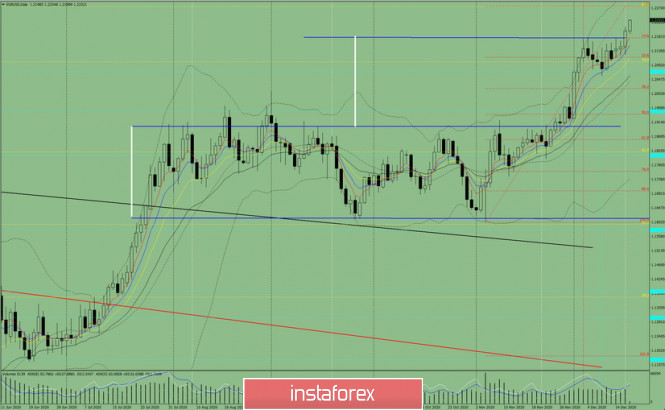 Figure 1 (daily chart). Comprehensive analysis: - Indicator Analysis – up
- Fibonacci Levels – up
- Volumes – up
- Technical Analysis – down
- Trend Analysis – up
- Bollinger Bands – up
- Weekly Chart – up
General conclusion: Today, from the level of 1.2198 (the closing of yesterday's daily candle), the market can continue to move up with the target of 1.2274 which is a pullback level of 85.4% (yellow dotted line). After testing this level, continue to work up with the target of 1.2342 which is the upper limit of the Bollinger Line Indicator (black dotted line). Alternative scenario: From the level of 1.2198 (the closing of yesterday's daily candle), the market may continue to move up with the target of 1.2274 which is a pullback level of 85.4% (yellow dotted line). After testing this level, it is possible to move downwards with a target of 1.2177 which is a pullback level of 14.6% (red dotted line). Technical Analysis of EUR/USD for December 17, 2020 2020-12-17 Technical Market Outlook: The EUR/USD pair has broken above the supply zone located between the levels of 1.2154 - 1.2177 and made a new swing high at the level of 1.2235 (at the time of writing the article). The market is still moving inside of the short-term ascending channel and the next target for bulls is seen at the level of 1.2411. The nearest technical support is seen at the level of 1.2211. The strong and positive momentum supports the short-term bullish outlook for Euro. The larger time frame trend remains up. Weekly Pivot Points: WR3 - 1.2281 WR2 - 1.2233 WR1 - 1.2171 Weekly Pivot - 1.2118 WS1 - 1.2069 WS2 - 1.2005 WS3 - 1.1960 Trading Recommendations: Since the middle of March 2020 the main trend is on EUR/USD pair has been up. This means any local corrections should be used to buy the dips until the key technical support is broken. The key long-term technical support is seen at the level of 1.1609. The key long-term technical resistance is seen at the level of 1.2555. 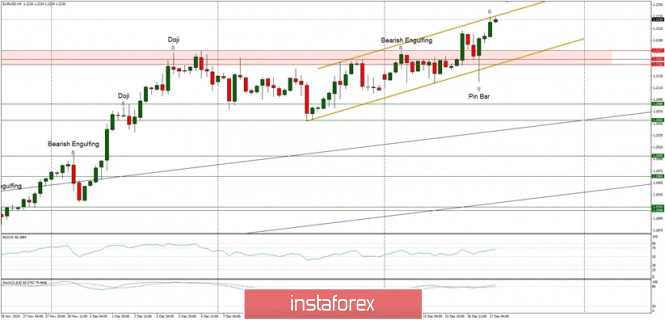
Technical Analysis of EUR/USD for December 17, 2020 2020-12-17 Technical Market Outlook: The EUR/USD pair has broken above the supply zone located between the levels of 1.2154 - 1.2177 and made a new swing high at the level of 1.2235 (at the time of writing the article). The market is still moving inside of the short-term ascending channel and the next target for bulls is seen at the level of 1.2411. The nearest technical support is seen at the level of 1.2211. The strong and positive momentum supports the short-term bullish outlook for Euro. The larger time frame trend remains up. Weekly Pivot Points: WR3 - 1.2281 WR2 - 1.2233 WR1 - 1.2171 Weekly Pivot - 1.2118 WS1 - 1.2069 WS2 - 1.2005 WS3 - 1.1960 Trading Recommendations: Since the middle of March 2020 the main trend is on EUR/USD pair has been up. This means any local corrections should be used to buy the dips until the key technical support is broken. The key long-term technical support is seen at the level of 1.1609. The key long-term technical resistance is seen at the level of 1.2555.
Technical Analysis of GBP/USD for December 17, 2020 2020-12-17 Technical Market Outlook: The GBP/USD pair has made another swing high located at the level of 1.3570 (at the time of writing the article). The bulls are in control of the market, the momentum is now strong and positive and the market conditions are not overbought yet. The nearest technical support is seen at the level of 1.3538 and 1.3515. Please notice, the up trend at the daily time frame chart is still in progress and there is no indication of a trend change yet. Weekly Pivot Points: WR3 - 1.3813 WR2 - 1.3637 WR1 - 1.3455 Weekly Pivot - 1.3298 WS1 - 1.3125 WS2 - 1.2955 WS3 - 1.2786 Trading Recommendations: The GBP/USD pair might have started a long term up trend and the trigger for this trend was the breakout above the level or 1.3518 on the weekly time frame chart. All the local corrections should be used to enter a buy orders as long as the level of 1.2674 is not broken. The long-term target for bulls is seen at the level of 1.4370. 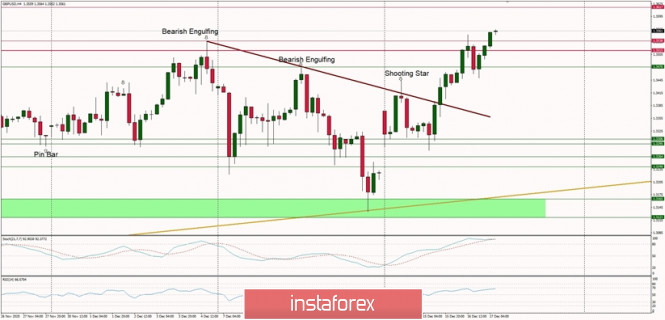
Elliott wave analysis of EUR/JPY for December 17, 2020 2020-12-17 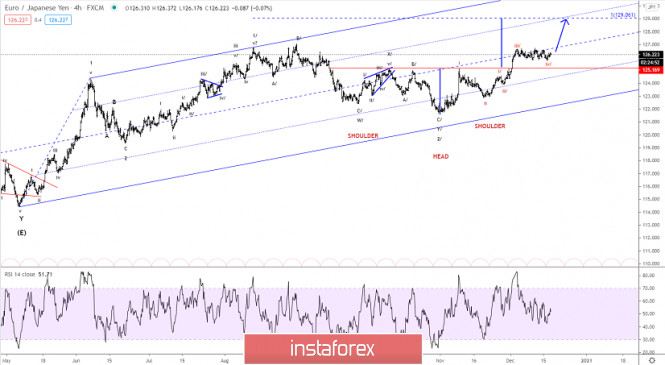
The sideways consolidation has extended and we have now seen a third dip to 125.71, which should be more than enough to complete this consolidation, but until short-term important resistance at 126.72 has been eclipsed more sideways consolidation can't be excluded. However, a break above 126.72 will confirm more upside progress towards 127.02 and ultimately closer to 129.06 as the next upside targets. R3: 127.27 R2: 127.30 R1: 126.78 Pivot: 126.26 S1: 126.00 S2: 125.71 S3: 125.50 Trading recommendation: We are long EUR from 126.25 with our stop placed at 125.70 Elliott wave analysis of GBP/JPY for December 17, 2020 2020-12-17 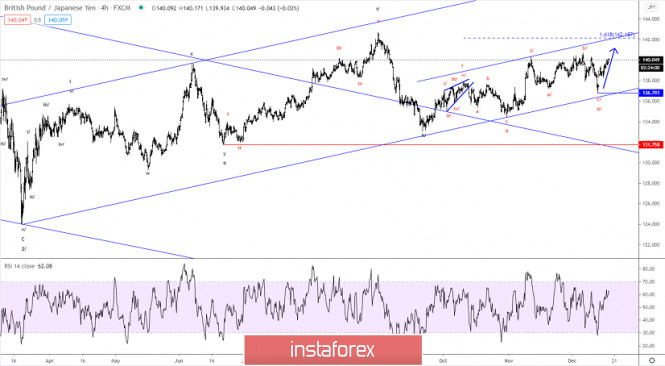
GBP/JPY has rallied nicely from the corrective low of 136.76and more upside progress towards 142.72 is expected in the days/weeks to come, but ultimately much higher levels remains expected. Short-term support is seen at 139.83 and then at 139.49. Ideally the later will be able to protect the downside for more upside pressure through140.33 towards 142.72. R3:141.00 R2: 140.71 R1:140.33 Pivot: 140.07 S1: 139.83 S2: 139.49 S3: 139.33 Trading recommendation: We are long GBP from 139.03 with our stop placed at 138.20 Indicator Analysis. Daily review for the GBP/USD currency pair 12/17/20 2020-12-17 Yesterday, the pair went up and tested the upper fractal of 1.3538 (daily candle from 12/04/20) and then rolled back down, closing the daily candle at 1.3504. Today, the price may continue to go up and according to the economic calendar news, it is expected at 12.00 UTC (pound), 13.30 UTC (dollar). Much will depend on how the market will perceive the news that will come out at 12.00 UTC. Trend Analysis (Figure 1). Today, the market will continue to go up from the level of 1.3504 (closing of yesterday's daily candle) with the target of 1.3676 at the pullback level of 76.4% (red dotted line). When testing this line, it is possible to continue going up with the target of 1.3943 at the pullback level of 85.4% (red dotted line). 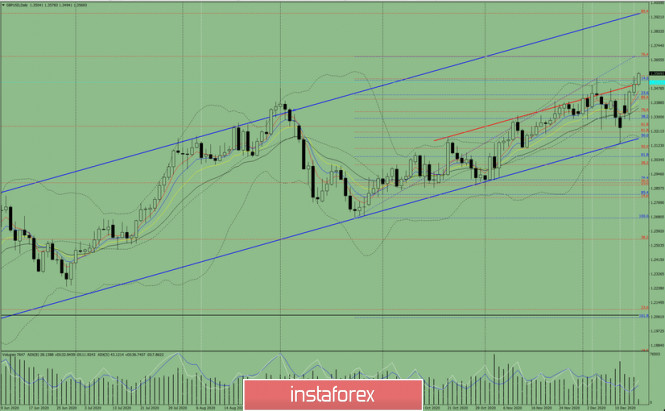
Figure 1 (daily chart). Comprehensive Analysis: General Conclusion: Today, the price will continue to go up from the level of 1.3504 (closing of yesterday's daily candle) with a target of 1.3676 at the pullback level of 76.4% (red dotted line). When testing this line, it is possible to continue going up with the target of 1.3943 at the pullback level of 85.4% (red dotted line). Alternative scenario: from the level of 1.3504 (closing of yesterday's daily candle), it will continue to go up with the target of 1.3676 at the pullback level of 76.4% (red dotted line). When testing this line, it is possible to go downwards with a target of 1.3527 at the pullback level of 14.6% (blue dotted line). Technical recommendations for EUR/USD and GBP/USD on 12/17/20 2020-12-17 EUR/USD 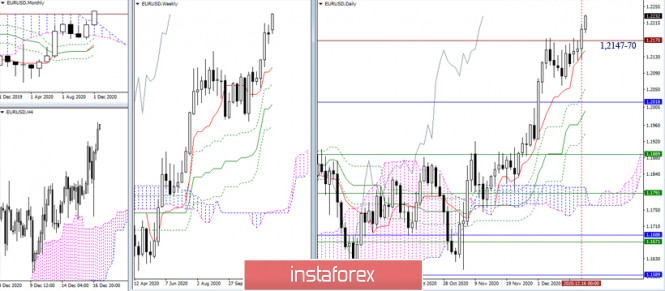 The bulls successfully rose above the resistance limits (1.2170-77) and closed yesterday's trading above it. Their main task for the remaining two days of the current week is to maintain their positions and confirm the close above the level of 1.2177 in the weekly time frame. Consequently, new upward prospects and plans are likely to be considered. On the other hand, returning below the level of 1.2170 and losing the daily short-term trend (1.2147) may lead to the formation of a rebound, with the possibility of its further development to support the monthly cloud (1.2019). 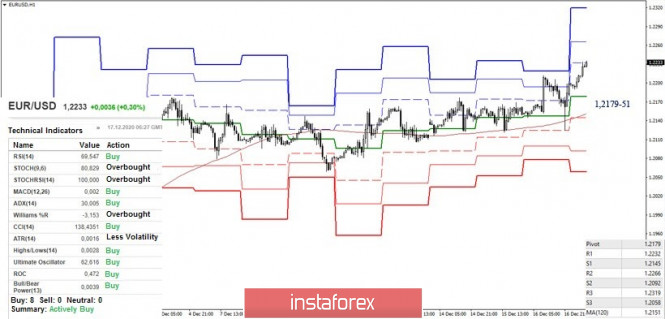 The upward trend is currently in its active phase in the hourly time frame. All analyzed technical instruments supported the bullish traders, so now, they are testing the first resistance of the classic pivot levels R1 (1.2232). Other pivot points within the day can be noted at 1.2266 (R2) and 1.2319 (R3). Today, the key levels of the smaller time frame are joining forces, forming a support zone at 1.2179-51 (central pivot level + weekly long-term trend). These levels are strengthened by the support of the higher TF, so settling below will significantly affect the current balance of power and will require a new assessment of the situation. The support levels today are 1.2092 (S2) and 1.2058 (S3). GBP/USD 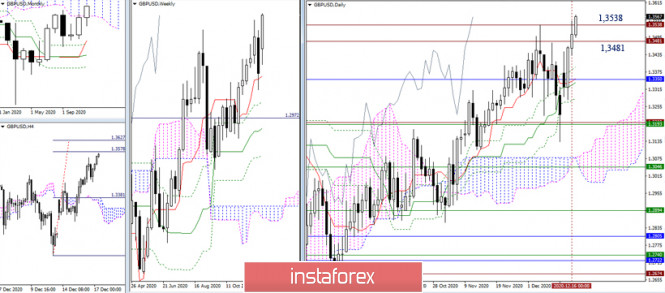 The pair continues to move upwards. Although it failed to close above 1.3538, the bulls still tried to rise. As a result, a new current high is indicated today. The target in the current conditions can now serve as an upward target for the breakdown of the four-hour cloud (1.3578-1.3627). If the bulls take a break in the near future and start losing positions, the loss of 1.3538 - 1.3481 may indicate the end of growth and the formation of a rebound. In this regard, a decline to the lower limit of the monthly cloud (1.3350) will be considered. 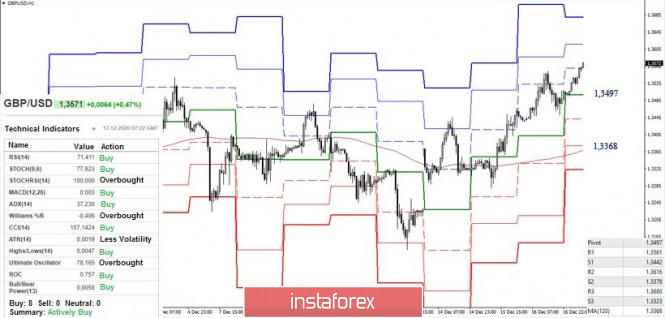 The development of the upward trend remains. The bulls rose above the initial resistance of the classic pivot levels R1 (1.3561), and as a result, the resistances R2 (1.3616) and R3 (1.3680) serve as bullish targets within the day. For today, the key levels are forming support in a quite wide range at 1.3497 (central pivot level) and 1.3368 (weekly long-term trend). The nearest support at 1.3442 (S1) can be noted. Ichimoku Kinko Hyo (9.26.52), Pivot Points (classical), Moving Average (120) Forex forecast 12/17/2020 on EUR/GBP, USD/CHF, NZD/USD and Bitcoin from Sebastian Seliga 2020-12-17 Let's take a look at the NZD/USD, USD/CHF and EUR/GBP technical picture before the interest rate decision event. Moreover, we will take a look at the Bitcoin as it trades at all time highs.
Author's today's articles: l Kolesnikova  text text Irina Manzenko  Irina Manzenko Irina Manzenko Maxim Magdalinin  In 2005 graduated from the Academy of the Ministry of Internal Affairs of the Republic of Belarus, law faculty. Worked as a lawyer for three years in one of the biggest country's company. Besides the trading, he develops trading systems, writes articles and analytical reviews. Works at stock and commodity markets explorations. On Forex since 2006. In 2005 graduated from the Academy of the Ministry of Internal Affairs of the Republic of Belarus, law faculty. Worked as a lawyer for three years in one of the biggest country's company. Besides the trading, he develops trading systems, writes articles and analytical reviews. Works at stock and commodity markets explorations. On Forex since 2006. Sergey Belyaev  Born December 1, 1955. In 1993 graduated from Air Force Engineering Academy. In September 1999 started to study Forex markets. Since 2002 has been reading lectures on the technical analysis . Is fond of research work. Created a personal trading system based on the indicator analysis. Authored the book on technical analysis "Calculation of the next candlestick". At present the next book is being prepared for publishing "Indicator Analysis of Forex Market. Trading System Encyclopedia". Has created eleven courses on indicator analysis. Uses classical indicators. Works as a public lecturer. Held numerous seminars and workshops presented at international exhibitions of financial markets industry. Is known as one of the best specialists in the Russian Federation researching indicator analysis. Born December 1, 1955. In 1993 graduated from Air Force Engineering Academy. In September 1999 started to study Forex markets. Since 2002 has been reading lectures on the technical analysis . Is fond of research work. Created a personal trading system based on the indicator analysis. Authored the book on technical analysis "Calculation of the next candlestick". At present the next book is being prepared for publishing "Indicator Analysis of Forex Market. Trading System Encyclopedia". Has created eleven courses on indicator analysis. Uses classical indicators. Works as a public lecturer. Held numerous seminars and workshops presented at international exhibitions of financial markets industry. Is known as one of the best specialists in the Russian Federation researching indicator analysis. Sebastian Seliga  Sebastian Seliga was born on 13th Oсtober 1978 in Poland. He graduated in 2005 with MA in Social Psychology. He has worked for leading financial companies in Poland where he actively traded on NYSE, AMEX and NASDAQ exchanges. Sebastian started Forex trading in 2009 and mastered Elliott Wave Principle approach to the markets by developing and implementing his own trading strategies of Forex analysis. Since 2012, he has been writing analitical reviews based on EWP for blogs and for Forex websites and forums. He has developed several on-line projects devoted to Forex trading and investments. He is interested in slow cooking, stand-up comedy, guitar playing, reading and swimming. "Every battle is won before it is ever fought", Sun Tzu Sebastian Seliga was born on 13th Oсtober 1978 in Poland. He graduated in 2005 with MA in Social Psychology. He has worked for leading financial companies in Poland where he actively traded on NYSE, AMEX and NASDAQ exchanges. Sebastian started Forex trading in 2009 and mastered Elliott Wave Principle approach to the markets by developing and implementing his own trading strategies of Forex analysis. Since 2012, he has been writing analitical reviews based on EWP for blogs and for Forex websites and forums. He has developed several on-line projects devoted to Forex trading and investments. He is interested in slow cooking, stand-up comedy, guitar playing, reading and swimming. "Every battle is won before it is ever fought", Sun Tzu Torben Melsted  Born in November 1962. Graduated from CBS, got Diploma in Finance. Began trading on Forex in 1986 and since that time held various positions such as advising clients, hedging client flows on FX and commodity markets. Also worked for major corporations as Financial Risk Manager. Uses Elliott wave analysis in combination with classic technical analysis, and has been using a Calmar Ratio of 5.0 for over 3 years. Has his own blog, where he uses Elliott wave and technical analysis on all financial markets. Born in November 1962. Graduated from CBS, got Diploma in Finance. Began trading on Forex in 1986 and since that time held various positions such as advising clients, hedging client flows on FX and commodity markets. Also worked for major corporations as Financial Risk Manager. Uses Elliott wave analysis in combination with classic technical analysis, and has been using a Calmar Ratio of 5.0 for over 3 years. Has his own blog, where he uses Elliott wave and technical analysis on all financial markets. Zhizhko Nadezhda  Graduated from Irkutsk State University. Having acquainted with Forex market in 2008, followed the courses in the International Academy of Stock Exchange Trading. The agenda was so exiting that she moved to St. Petersburg in order to get professional education. Obtained a diploma of the retraining course on the discipline Exchange market and stock market issues, defended the graduation paper with distinction on the subject "Modern technical indicators as the basis of the trading system". At the moment obtains a master degree in International Banking Institute on specialty Financial markets and investments. Apart from trading is occupied with development of trading systems and formalization of the working strategies using Ichimoku indicator. At the moment is working on the book dedicated to the peculiarities of Ichimoku indicator and its operating methods. Interests: yoga, literature, travelling and photograph. "You can only get smarter by playing a smarter opponent" Basics of Chess play, 1883 "Successful people change by themselves, the others are changed by life" Jim Rohn Graduated from Irkutsk State University. Having acquainted with Forex market in 2008, followed the courses in the International Academy of Stock Exchange Trading. The agenda was so exiting that she moved to St. Petersburg in order to get professional education. Obtained a diploma of the retraining course on the discipline Exchange market and stock market issues, defended the graduation paper with distinction on the subject "Modern technical indicators as the basis of the trading system". At the moment obtains a master degree in International Banking Institute on specialty Financial markets and investments. Apart from trading is occupied with development of trading systems and formalization of the working strategies using Ichimoku indicator. At the moment is working on the book dedicated to the peculiarities of Ichimoku indicator and its operating methods. Interests: yoga, literature, travelling and photograph. "You can only get smarter by playing a smarter opponent" Basics of Chess play, 1883 "Successful people change by themselves, the others are changed by life" Jim Rohn
Subscription's options management Theme's:
Fundamental analysis, Fractal analysis, Wave analysis, Technical analysis, Stock Markets
Author's :
A Zotova, Aleksey Almazov, Alexander Dneprovskiy, Alexandr Davidov, Alexandros Yfantis, Andrey Shevchenko, Arief Makmur, Dean Leo, Evgeny Klimov, Fedor Pavlov, Grigory Sokolov, I Belozerov, Igor Kovalyov, Irina Manzenko, Ivan Aleksandrov, l Kolesnikova, Maxim Magdalinin, Mihail Makarov, Mohamed Samy, Mourad El Keddani, Oleg Khmelevskiy, Oscar Ton, Pavel Vlasov, Petar Jacimovic, R Agafonov, S Doronina, Sebastian Seliga, Sergey Belyaev, Sergey Mityukov, Stanislav Polyanskiy, T Strelkova, Torben Melsted, V Isakov, Viktor Vasilevsky, Vladislav Tukhmenev, Vyacheslav Ognev, Yuriy Zaycev, Zhizhko Nadezhda
Edit data of subscription settings
Unsubscribe from the mailing list Sincerely,
Analysts Service | If you have any questions, you can make a phone call using one of the
InstaForex Toll free numbers right now:
|  | InstaForex Group is an international brand providing online trading services to the clients all over the world. InstaForex Group members include regulated companies in Europe, Russia and British Virgin Islands. This letter may contain personal information for access to your InstaForex trading account, so for the purpose of safety it is recommended to delete this data from the history. If you have received this letter by mistake, please contact InstaForex Customer Relations Department. |


No comments:
Post a Comment