| Cup and Handle Chart Pattern: What It Is and How to Trade It - Why you need to understand the Cup and Handle pattern…
- Examples of the Cup and Handle Pattern…
- And how the Cup and Handle acts differently on penny stocks…
Recommended Link

Dear Penny Stock Millionaire, The cup and handle is a technical chart pattern. It was first defined by William O’Neil in his classic book “How to Make Money in Stocks.” O’Neil called it a “cup with handle” pattern. He had clear criteria defining the cup and handle. I’ll cover that in this post. But fair warning... I get a lot of questions about chart patterns. It’s important to know the classic chart patterns — and recognize them. But understand this is about giving you a broad education. It’s like stock trading 101. What Is a Cup and Handle? The cup and handle is a continuation pattern. It’s pretty simple: the pattern looks like a cup with a handle from the side. Here’s an example from 2019... Cup and Handle Chart Example: Rare Element Resources Ltd. (OTCQB: REEMF) 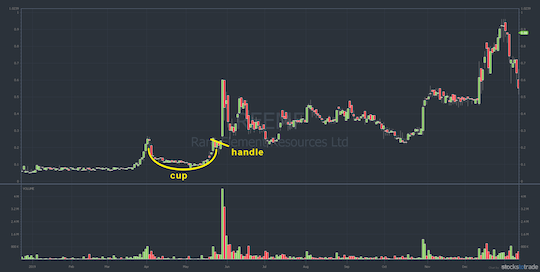
REEMF chart: 2019 1-year, cup and handle — courtesy of StocksToTrade.com Before I go any further ... Some people will look at the chart and say, “Tim, that doesn’t fit William O’Neil’s perfect cup and handle description.” Right. Neither did any of the chart examples in his book. Remember, trading is not an exact science. Let’s get into the cup and handle pattern as defined by William O’Neil. Cup and Handle Chart Pattern Here’s the basic definition of a “cup with handle” according to O’Neil in “How to Make Money in Stocks.” “Cup patterns can last from 7 weeks to as long as 65 weeks, but most of them last for three to six months. The usual correction from the absolute peak (the top of the cup) to the low point (the bottom of the cup) of this price pattern varies from around the 12% to 15% range to upwards of 33%. A strong price pattern of any type should always have a clear and definite price uptrend prior to the beginning of its base pattern.” — William J. O'Neil, “How to Make Money in Stocks: A Winning System in Good Times and Bad,” Fourth Edition (p. 88). McGraw-Hill Education. Kindle Edition. O’Neil then goes on to say that sometimes the cups are deeper — even 50% to 75%. He also talks about cups without handles and cups with uptrending handles. I mention this for three reasons… What You Need to Understand About the Cup and Handle Chart Pattern First, many online surces give preocise definitions of the cup and handle. “For it to be a cup and handle, the stock has to do this, then this.” Blah, blah, blah. That’s a bunch of blowhards trying to get you to follow them. They probably haven’t even read the book. Second, O’Neil basically says it’s not an exact science. He observed hundreds of variations — both successful and failed cup and handle patterns. Third, in the book, O’Neil talks about other important indicators when you spot a potential trade. And not just in other parts of the book. It’s right there on the same page with the cup and handle pattern (emphasis mine): “You should look for at least a 30% increase in price in the prior uptrend, together with improving relative strength and a very substantial increase in trading volume at some points in the prior uptrend.” Here’s another example. It’s not textbook cup and handle, but the pattern is still obvious. Plug Power Inc. (NASDAQ: PLUG) 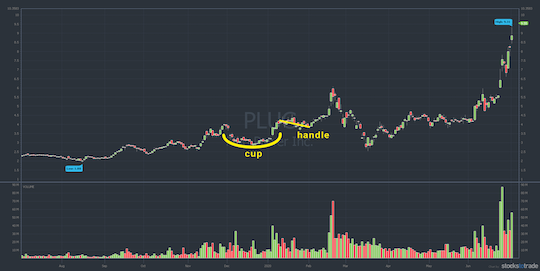
PLUG chart: 1-year to July 2020, cup and handle pattern — courtesy of StockToTrade.com I can’t emphasize enough that pattern/price action is only ONE of my seven indicators. Example of How to Use the Cup and Handle Chart Pattern Again, I have my favorite patterns to trade. So I don’t go on the hunt for the cup and handle pattern. But — and this is super important — a lot of traders do. And that means it can be a self-fulfilling prophecy. In other words, if enough traders see the cup shape, they can get interested. Then they see the pullback handle. And then it can turn into a breakout just because so many people believe it will happen. They all buy together and drive up the price. Cup With Handle Signal The cup with handle signal is another way of saying the cup and handle pattern is a bullish chart pattern. The pattern signals technical traders about a potential breakout. Technical traders often buy right when the stock climbs back to the pivot price. (The pivot is the top of the handle. Keep reading to see what I mean.) In the case of an inverse cup and handle, it’s bearish. It signals a potential breakdown. Cup and Handle Pattern Failure Again, it’s not an exact science. Patterns fail all the time and for a variety of reasons. That’s why it’s essential to plan your trades and follow rule #1: cut losses quickly. Let’s take a look at a chart with several cup and handle examples. Interestingly, this chart shows both successful and failed cup and handle patterns. Failed Cup and Handle Example: ElectraMeccanica Vehicles Corp. (NASDAQ: SOLO) 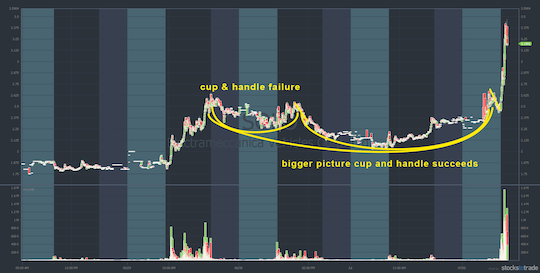
SOLO chart: June 29-July 2, cup and handle — courtesy of StocksToTrade.com First things first … This doesn’t fit the “7 to 65 weeks” cup definition I quoted from O’Neil’s book above. The cup and handle pattern can happen in shorter time frames, too. In the penny stock niche, it’s important you don’t get too attached to traditional or long-term patterns. That’s not to say they don’t happen. It’s just that my seven-step framework is more accurate for this niche. On the chart above, I’ve drawn three arcs to represent cups. The small cup on the left is a messy cup and handle. And it’s a good example of a cup and handle pattern failure. The bounce out of the handle was very small before continuing downward. Then the stock formed a nice cup from the high of day on June 30 through July 1. Looking at the chart, you could argue the pullback at the end of the day on July 1 is a handle... But look at the bigger arc. That shows the entire pattern more clearly. It’s a kind of double cup, a clear handle, and a clean breakout. Recommended Link
110 Pages Reveal Biden's Left-Wing Secret 
You may not want to listen to what this government insider says right here about the 2020 election. But if what he predicts could happen in November turns out to be true… Then millions of American families could see their lives change as they know it. Click below for this former government insider's take and how you can protect yourself and your family. | |
Structure of the Cup and Handle Technical Pattern The structure of the cup and handle technical pattern looks like this... Cup and Handle Structure Example: Night Food Holdings (OTCQB: NGTF) 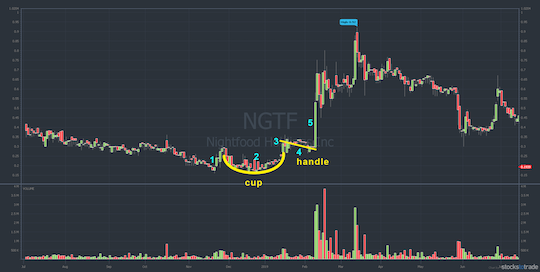
NGTF chart: 1-year to July 2019, structure of cup and handle technical pattern — courtesy of StocksToTrade.com The following details refer to the numbers on the NGTF chart above: - Upward momentum. O’Neil said to look for a 30% upward move to the rim of the cup.
- A pullback forming an arc or U shape. The base length can vary — and does. Pure long-term technical traders tend to follow the seven weeks or more rule. You won’t always have that luxury with penny stocks.
- Ramping up to the rim on the right. The great Jesse Livermore called this the high pivot.
- A pullback to form the handle. O’Neil liked a downward handle as opposed to an uptrending handle. His backtesting showed uptrending handles often lead to cup and handle pattern failure.
- Strong upward momentum to breakout above the high-pivot (i.e., the breakout).
Bullish Cup and Handle Pattern A bullish cup and handle pattern is what most people are talking about when they say cup and handle. Again, it’s considered a bullish signal for a potential breakout. Bearish Cup and Handle Pattern Almost every pattern has its opposite. The cup and handle is no different. The easiest way to describe the bearish cup and handle pattern is that it looks like a teacup turned upside down. In other words, look for a roughly 30% downward move, an inverted U-shaped correction, a bounce handle, and breakdown. For me, I look for big panics to dip buy. Sometimes they look like a bearish cup and handle breakdown. But that’s not my focus. Cup and Handle Formation in Penny Stocks Penny stocks are beautiful because they’re so volatile. This means the big moves usually happen much faster than expensive stocks like blue-chips. One consequence is that patterns tend to speed up, too. Three of the example charts you’ve looked at so far fit the traditional time frame. REEMF, PLUG, and NGTF formed a cup over roughly seven weeks. But SOLO formed a messy cup and handle over only three days. Now take a look at an intraday cup and handle… Intraday Cup and Handle Example: Polymet Mining Corporation (AMEX: PLM) 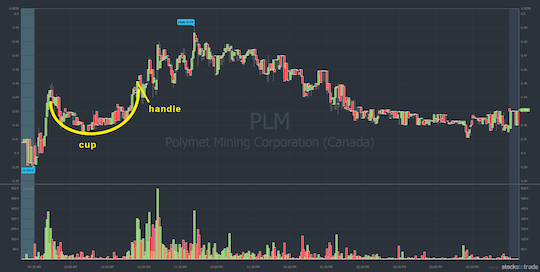
PLM chart: intraday cup and handle, July 1 2020 — courtesy of StocksToTrade.com PLM didn’t have a strong breakout from the handle. It was choppy. Again, there are other indicators to consider. For example, the big increase in trading volume. I don’t like choppy stocks — I’m too impatient. But the chart shows how a cup and handle can form intraday. Take a look at another example of a recent runner. This time the cup and handle pattern formed over one day. One-Day Cup and Handle Example: Ideanomics, Inc (NASDAQ: IDEX) 
IDEX chart: 10-day, June 21–July 2, 2020, 1-day cup and handle — courtesy of StocksToTrade.com Again, this isn’t an exact science. IDEX formed a decent looking cup and handle over one day from premarket trading on June 21. Then it had a clean breakout at the market open on June 22. Here’s one final example of a penny stock cup and handle for your knowledge account… Penny Stock Cup and Handle Example: American Bio Medica Corp. (OTCPK: ABMC) 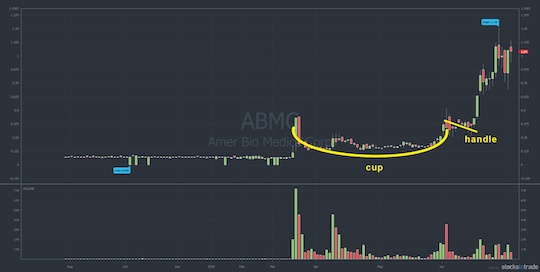
ABMC chart: 1-year, messy cup and handle pattern — courtesy of StocksToTrade.com The ABMC chart is an ugly cup and handle. The handle on the chart is also a good example of a bull pennant pattern. Recommended Link
Conclusion The cup and handle pattern is one of the classics every trader should know. While I don’t actively search for it, I do think you need to recognize it. Why? Cup and handle pattern recognition can signal a potential trade. Remember, there are a lot of traders who focus on technical patterns. The more you know about how they think, the smarter you can start to trade. Trading is a battlefield — know your opponent. Also, remember smart trading requires more than just knowing a pattern. I’ve given you hints in this post about how to trade the cup and handle pattern. But if I gave you only “buy here, sell here” I’d be doing you a great disservice. Why? Because the perfect pattern is rare. You MUST understand the other indicators. You have to be meticulous. Otherwise the market will determine the cost of your education. Here’s an example… The SOLO chart in this post showed a pretty clean breakout. But do you know why the stock broke out? The catalyst is another important indicator. In the case of SOLO, it was all about sector momentum. The entire electric vehicle sector was going crazy that week. Self-sufficient traders know and use ALL the information at their disposal. What do you think of the cup and handle pattern? Tim Sykes
Editor, Penny Stock Millionaires P.S. In case you missed it yesterday... Government advisor Jim Rickards made a shocking election prediction. 
One that’s going to blow your mind! During the event Jim also reveals his top investment pick to take advantage of the upcoming volatility… And Nomi Prins reveals an exciting opportunity. One that could hand you 3X your money over the next three months. But you must hurry, time is running out… Because the rebroadcast is coming down Tuesday at midnight. Click here to watch the video before it comes down. | 


Post a Comment
0Comments