How to Pick Up Stocks on the Dip  | | Shah Gilani
Chief Investment Strategist | This week's volatility has me eager to put together my stock shopping list. And like a good bargain shopper who does their price research before buying... I'm turning to my version of price research by breaking out some of my favorite technical tools. Technical analysis is key in volatile markets. It gives you a visual representation of market sentiment... fear and greed... and supply and demand. Here's how to use them to pick up good bargain stocks... | SPONSORED | | The Final Piece of Nvidia's AI Puzzle Nvidia's Blackwell chip is set to redefine artificial intelligence, but it can't reach its full potential without one crucial component. That's where this secretive startup comes in. Their technology is the backbone of Blackwell's success, and as Nvidia aims for global AI dominance, this little-known company could be the key to unlocking untold riches. Discover the hidden link in the AI supply chain.  | | | Support These Stocks One of the most important ideas in technical analysis is support. Support levels are the price points at which a falling stock or an index is expected to find buying interest strong enough to keep prices from dropping further. At these levels, the stock looks undervalued or cheap, attracting buyers off the sidelines... or buyers who want to add to positions they expect to run higher. The simplest way to find support levels is by looking at historical price charts. Previous lows often act as support. Investors remember these levels as being good buying opportunities and are likely to buy again when prices hit these points again. By drawing a line to connect the lows on a price charts, you can visualize potential support levels. These trend lines show where buyers have stepped in, and they can project future support levels as long as the trend remains intact. Here's an example of support levels on Microsoft (MSFT)... 
View larger image Moving averages are another strong indicator. They smooth out price data to create a single flowing line, which makes it easier to identify the overall direction of the market. Common moving averages used to find support include the 50-day and 200-day moving averages. Prices often find support at these levels during pullbacks in a bull market. You can see how Microsoft found support above its 50-day at multiple points in the past year. 
View larger image Tools like the Relative Strength Index (RSI) can also help identify potential support levels. For instance, an RSI reading below 30 typically indicates that a stock or index is oversold and may be nearing a support level. Again, we'll use Microsoft as an example. The stock's RSI has fallen close to 30... and the 200-day MA is acting as support. 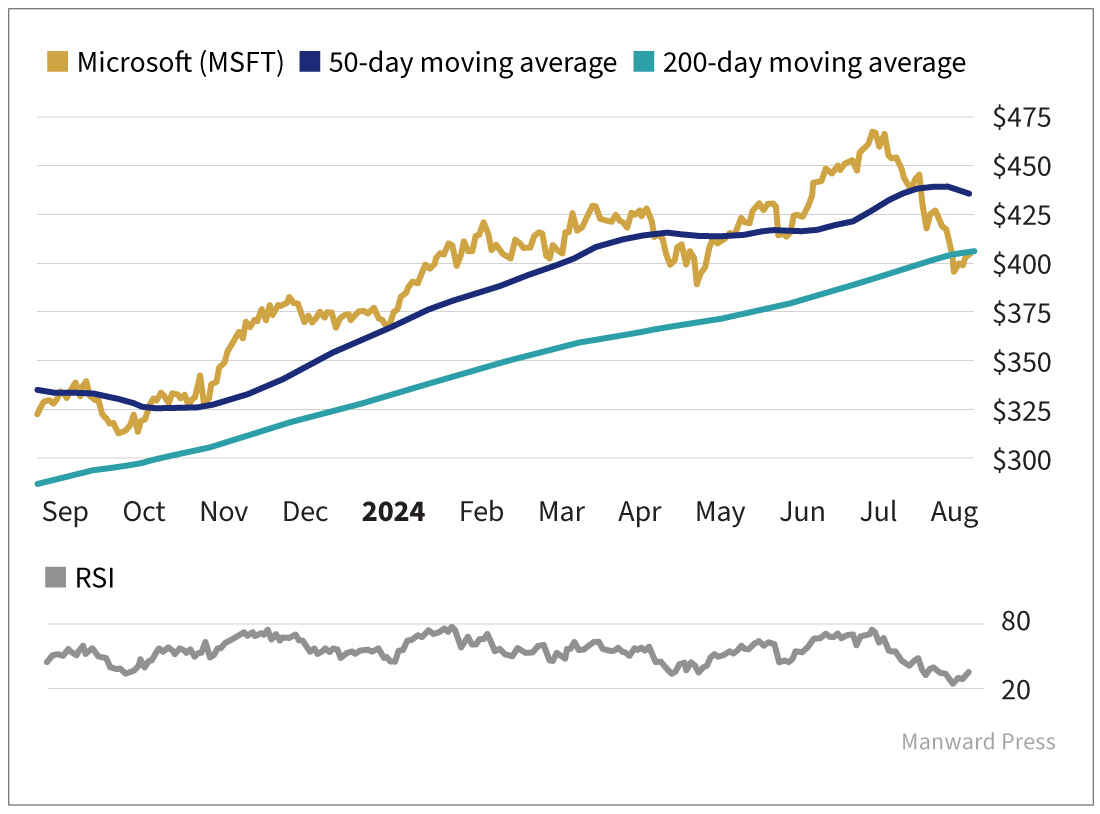
View larger image Now that we've looked at how technical analysis can help us find good price points... let's talk strategy. Safety First First, we must focus on stocks or indexes that have shown historical resilience and leadership within their sectors. These blue chip or benchmark stocks are often the first to rebound because they are perceived as stable investments by long-term bargain hunters. For the past decade, that tried and true group has been the megacap tech stocks with their huge capitalization weights and their concentration in investor portfolios. Next, buying the dip also works with an averaging down strategy. This means buying more of the stock at a lower price to reduce the average cost per share. This works only if the fundamentals of the stock remain strong, and, more importantly, the trend of the market remains bullish. Finally, you should always know your end game and set both target prices and stop loss levels. This helps in managing risk, particularly in these volatile markets. If a stock falls below a major support level, it might be time to cut your losses rather than wait for a rebound. Technical analysis is not just about charts and numbers. It's about understanding the psychology of the market and using that understanding to make informed decisions. By identifying support levels, buying on dips, and focusing on quality stocks, investors can enhance their chances of success in the stock market. We're not just trying to survive market dips... we're also thriving in them and using them to our advantage. That's why I get excited for volatility... and you should too. Cheers, Shah P.S. I plan on turning this buying opportunity into a windfall. And I want to help you do the same. On Monday, I'm revealing my personal playbook for the rest of 2024... with my strategies for making more profits... with fewer trades... so you can live the life you want NOW. Click here to set a reminder so you don't miss the big reveal. Want more content like this? | | | | | | 


No comments:
Post a Comment