| EUR/USD: plan for the European session on December 9. COT reports. Market froze in anticipation of Brexit news and ECB meeting 2020-12-09 To open long positions on EUR/USD, you need: In general, nothing interesting happened yesterday. The lack of important fundamental reports did not make it possible for large players to rock the market, which kept volatility low. If you look at the 5-minute chart, you will see how the bears tried to form a signal to sell the euro and they succeeded. However, this did not lead to a significant downward movement, but only made it necessary to reconsider the nearest support and resistance levels. Let's figure out what to do next. 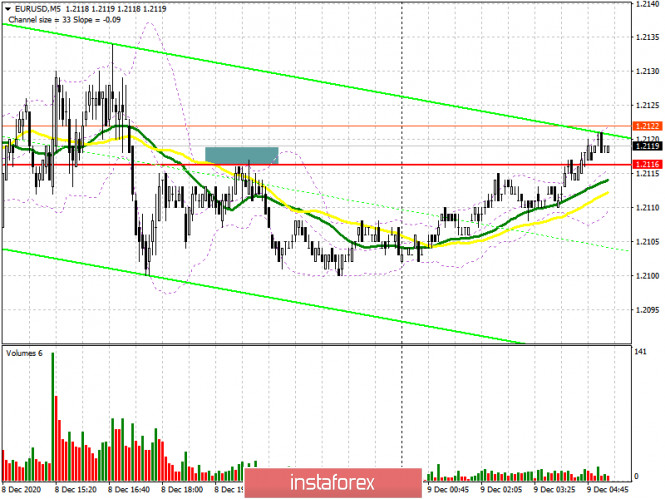
Buyers of the euro should do their best in going beyond yesterday's resistance at 1.2135. Testing this level from top to bottom after the breakout produces a good signal to open long positions in hopes to sustain the upward trend, which is currently present in the market. The main goal is to return to last week's highs in the 1.2177 area, which has already been tested for strength twice. The fact that the bulls failed to update this level yesterday threatens the upward trend. Therefore, testing 1.2177 for the third time will lead to its breakout and EUR/USD can rise to the highs of 1.2255 and 1.2339, where I recommend taking profit. If bulls are not active in the 1.2135 area, it is best not to rush into buying, since it will really depend on the final Brexit talks, which will be held in Brussels today between British Prime Minister Boris Johnson and European Commission President Ursula von der Leyen. Forming a false breakout in the support area of 1.2099 will be a signal to open long positions. I recommend buying the pair immediately on a rebound from the 1.2046 level, counting on a correction of 20-25 points within the day. A larger support level is seen around 1.1986. Testing this low will revert the upward trend in the short term. To open short positions on EUR/USD, you need: Pound sellers are currently focused on the 1.2135 level, which they need to protect. Forming a false breakout there in the first half of the day will be a signal to open short positions in order to continue the downward correction so it can reach the low of 1.2099, since it was not possible to break through the area below it yesterday. Getting the pair to settle below this range and testing it from the bottom up will be a good signal to sell EUR/USD to the area of a large low at 1.2046, and the bears' next target will be to close the day in the support area at 1.1986, which will seriously affect the upward trend. If EUR/USD rises above the resistance level of 1.2135, it is better not to rush to sell. In this scenario, you can only rely on short positions from the resistance of 1.2175, or sell EUR/USD from a new high of 1.2255, counting on a downward correction of 15-20 points within the day. Do not forget about placing stop orders since we expect high volatility and sharp movements today, which will help you avoid losses in case of an incorrect market entry. 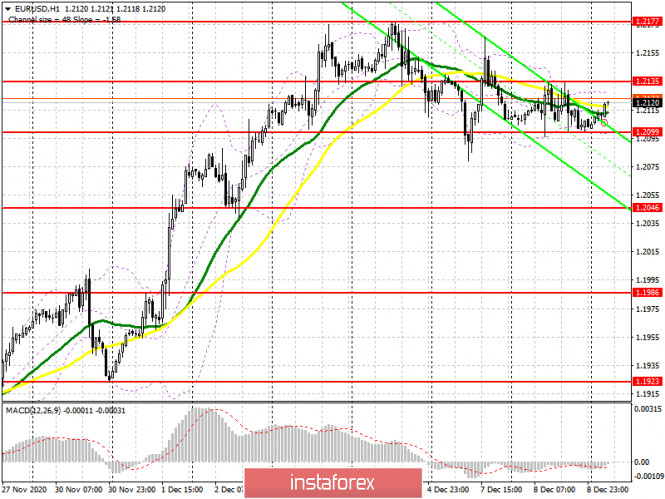
The Commitment of Traders (COT) report for December 1 showed an increase in long positions and a reduction in short positions. Buyers of risky assets believe that the bull market will continue and they also anticipate the euro's growth, after going beyond the psychological mark in the area of the 20th figure. Thus, long non-commercial positions rose from 206,354 to 207,302, while short non-commercial positions fell to 67,407 from 68,104. The total non-commercial net position rose to 139,894 from 138,250 a week earlier. Take note of the delta's growth after its 8-week decline, which indicates a clear advantage of buyers and a possible resumption of the medium-term upward trend for the euro. We can only talk about an even bigger recovery when European leaders have negotiated a new trade deal with Britain. However, we did not receive good news last week, and we have an EU summit ahead of us, which could put the final point in this story. News that restrictive measures will be lifted for the Christmas holidays can provide support to the euro, as well as the absence of major changes in the ECB's monetary policy. Indicator signals: Moving averages Trading is carried out in the area of 30 and 50 moving averages, which indicates the sideways nature of the market ahead of important news on Brexit. Note: The period and prices of moving averages are considered by the author on the H1 hourly chart and differs from the general definition of the classic daily moving averages on the daily D1 chart. Bollinger Bands Volatility is low, which does not provide signals to enter the market. Description of indicators - Moving average (moving average, determines the current trend by smoothing out volatility and noise). Period 50. It is marked in yellow on the chart.
- Moving average (moving average, determines the current trend by smoothing out volatility and noise). Period 30. It is marked in green on the chart.
- MACD indicator (Moving Average Convergence/Divergence — convergence/divergence of moving averages) Quick EMA period 12. Slow EMA period to 26. SMA period 9
- Bollinger Bands (Bollinger Bands). Period 20
- Non-commercial speculative traders, such as individual traders, hedge funds, and large institutions that use the futures market for speculative purposes and meet certain requirements.
- Long non-commercial positions represent the total long open position of non-commercial traders.
- Short non-commercial positions represent the total short open position of non-commercial traders.
- Total non-commercial net position is the difference between short and long positions of non-commercial traders.
GBP/USD: plan for the European session on December 9. COT reports. X-day for Brexit trade deal. Hope for Boris Johnson and Ursula von der Leyen 2020-12-09 To open long positions on GBP/USD, you need: Yesterday afternoon, there were a huge number of signals to enter the market. There were both profitable and unprofitable trades. Let's quickly go over them. If you recall yesterday's afternoon forecast and look at the 5-minute chart, you will see that testing the 1.3290 level caused the pound to rise to the resistance area of 1.3381. The movement was over 90 points. Then the bears managed to defend the 1.3381 area, but I failed to wait for a good sell signal from there. But after returning to the support area of 1.3340, I did buy, but they brought losses, and then this level was overcome and the pound fell. After that, it was necessary to sell the pound, which happened. Testing the 1.3340 area from the bottom up produced an excellent entry point for short positions, which caused the pound to fall to the 1.3290 support area. By the end of the US session, the bulls managed to form a signal to buy the pound from the 1.3340 level (a similar entry that brought losses). This signal turned out to be more profitable, resulting in an increase of about 35 points. 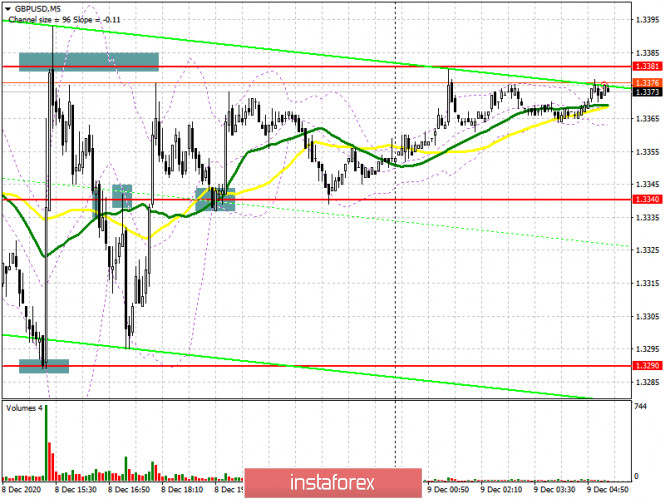
The technical picture has not changed at the moment, buyers must maintain control over the 1.3340 level. Forming a false breakout there in the first half of the day will be an excellent signal to open long positions in hopes for the pound to rise in the short term. The main goal is for a breakout and getting the pair to settle above the resistance of 1.3381, testing it from top to bottom, similar to yesterday's purchases, produces a convenient entry point for sustaining the pound's growth, while also expecting it to reach a high of 1.3433, where I recommend taking profits. The next targets are resistances 1.3483 and 1.3534, but they will be available only if we receive good news about the outcome of the Brexit negotiations. In case bulls are not active in the support area of 1.3340, it is best not to rush to buy, but wait for a downward correction to the area of a low of 1.3290, where you can try to catch hold of the market, counting on a 20-30 point correction within the day. A larger support level remains at 1.3246, where you can also buy GBP/USD immediately on a rebound, counting on a correction of 20-30 points. To open short positions on GBP/USD, you need: Pound sellers retreated from the market yesterday after news broke that British Prime Minister Boris Johnson had canceled the Internal Market Bill that violated earlier agreements with the EU. This caused the pound to rise and it returned to the resistance area of 1.3381 in the afternoon. The initial goal is to protect this range, where forming a false breakout will bring pressure back on the pair and lead to a renewal of the 1.3340 low. The next goal will be a breakout and getting the pair to settle below 1.3340. Testing this level from the bottom up produces a good signal to sell the pound in hopes for it to fall to the 1.3290 and 1.3246 areas, where I recommend taking profits. Bad news on the trade deal can pull down GBP/USD around lows of 1.3194 and 1.3114. If the bulls manage to regain the 1.3381 level, then it is better not to rush with short positions. The optimal scenario for selling the pound is when it fails to settle above 1.3433. I recommend opening short positions immediately on a rebound from a high in the 1.3483 area, counting on a downward correction of 25-30 points within the day. Since we will not receive any news regarding the UK economy today, focus will shift to Brexit. 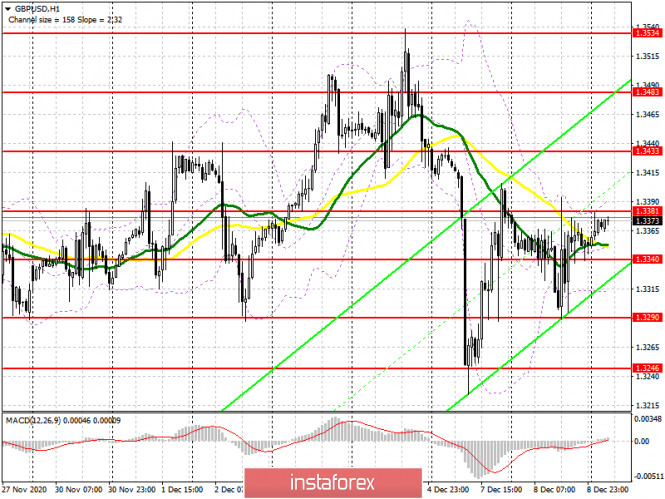
The Commitment of Traders (COT) reports for November 24 indicates significant interest in the pound, as many traders hoped that the Brexit deal would be finalized. Long non-commercial positions rose from 30,838 to 37,087. At the same time, short non-commercial positions decreased from 47,968 to 44,986. As a result, the negative non-commercial net position was -7,899 against -17,130 a week earlier. This indicates that sellers of the British pound retain control and it also shows their slight advantage in the current situation, but the market is beginning to gradually come back to risks, and reaching a trade deal will help it in this. Indicator signals: Moving averages Trading is carried out just above 30 and 50 moving averages, which indicates the bulls' attempt to restore the pound's growth. Note: The period and prices of moving averages are considered by the author on the H1 hourly chart and differs from the general definition of the classic daily moving averages on the daily D1 chart. Bollinger Bands A breakout of the upper border of the indicator around 1.3390 will cause the pound to rise. In the event of a decline, support will be provided by the lower border of the indicator at 1.3315. Description of indicators - Moving average (moving average, determines the current trend by smoothing out volatility and noise). Period 50. It is marked in yellow on the chart.
- Moving average (moving average, determines the current trend by smoothing out volatility and noise). Period 30. It is marked in green on the chart.
- MACD indicator (Moving Average Convergence/Divergence — convergence/divergence of moving averages) Quick EMA period 12. Slow EMA period to 26. SMA period 9
- Bollinger Bands (Bollinger Bands). Period 20
- Non-commercial speculative traders, such as individual traders, hedge funds, and large institutions that use the futures market for speculative purposes and meet certain requirements.
- Long non-commercial positions represent the total long open position of non-commercial traders.
- Short non-commercial positions represent the total short open position of non-commercial traders.
- Total non-commercial net position is the difference between short and long positions of non-commercial traders.
Indicator analysis. Daily review on the EUR/USD currency pair for December 9, 2020 2020-12-09 Trend analysis (Fig. 1). Today, the market from the level of 1.2103 (closing of yesterday's daily candlestick) will try to continue moving up in order to reach the upper fractal of 1.2177 (red dotted line), the daily candlestick from 12/04/2020. After reaching this level, further upward movement with the target of 1.2262 - the target level of 161.8% (blue dotted line) is possible. 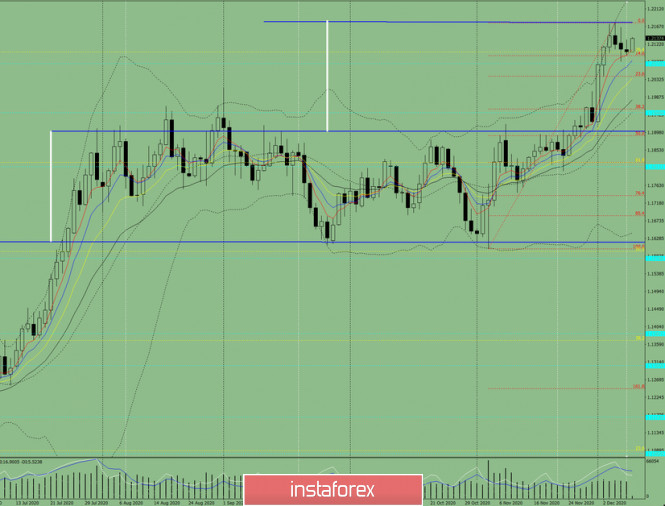
Figure 1 (Daily Chart). Comprehensive analysis: - Indicator analysis - up
- Fibonacci levels - up
- Volumes - up
- Candlestick analysis - up
- Trend analysis - up
- Bollinger bands - up
- Weekly chart - up
General conclusion: Today, the price may continue to move up in order to reach the upper fractal of 1.2177 (red dotted line), the daily candlestick from 12/04/2020. After reaching this level, further upward movement with the target of 1.2262 - the target level of 161.8% (blue dotted line) is possible. Alternative scenario: when moving up and reaching the upper fractal of 1.2177 (red dotted line), the daily candlestick from 12/04/2020, the price may start moving down to the pullback level of 14.6%, 1.2093 (red dotted line). Indicator analysis. Daily review for the GBP/USD currency pair 09/12/2020 2020-12-09 Trend analysis (Fig. 1). Today, the market will try to start moving up from the level of 1.3352 (closing of yesterday's daily candle) in order to reach the resistance line of 1.3510 (red bold line). If this level is tested, further move up with the target of 1.3538 which is the upper fractal (blue dotted line). 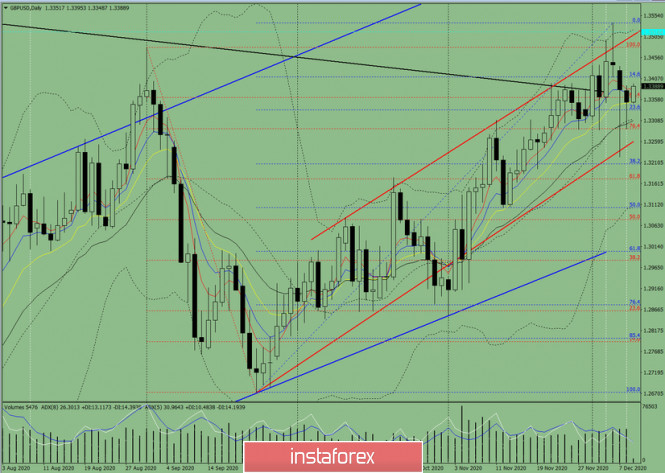 Figure 1 (daily chart). Complex analysis: - Indicator Analysis – up
- Fibonacci Levels – up
- Volumes – up
- Candle Analysis – up
- Trend Analysis – up
- Bollinger Bands – up
- Weekly Chart – up
General conclusion: Today, from the level of 1.3352 (closing of yesterday's daily candle), the price will try to start moving up to reach the resistance line of 1.3510 (red bold line). If this level is tested, further work up with the target of 1.3538 which is the upper fractal (blue dotted line). Alternative scenario: From the level of 1.3414 (closing of yesterday's daily candle), the price will try to continue moving up to reach the resistance line of 1.3510 (red bold line). If this line is tested, further work down with the target of 1.3411 which is the pullback level of 14.6% (blue dotted line). Technical Analysis of GBP/USD for December 9, 2020 2020-12-09 Technical Market Outlook: The GBP/USD pair has dropped towards the key technical support located at the level of 1.3240 and bounced 50% towards the level of 1.3395. If the bulls will not break through 61% Fibonacci retracement of the last wave down located at the level of 1.3417, then the correction will deepen. Nevertheless, this situation is only temporary and there is no indication of the up trend termination yet. The nearest technical support is located at 1.3240 and 1.3264. The strong and positive momentum supports the short-term bullish outlook, so only if the demand zone located between the levels of 1.3264 - 1.3240 is clearly violated, then the outlook will change to bearish. Weekly Pivot Points: WR3 - 1.3800 WR2 - 1.3667 WR1 - 1.3552 Weekly Pivot - 1.3410 WS1 - 1.3307 WS2 - 1.3172 WS3 - 1.3057 Trading Recommendations: The GBP/USD pair is in the down trend on the monthly time frame, but the recent bounce from the low at 1.1411 made in the middle of March 2020 looks very strong and might be a reversal swing. In order to confirm the trend change, the bulls have to break through the technical resistance seen at the level of 1.3518. All the local corrections should be used to enter a buy orders as long as the level of 1.2674 is not broken. 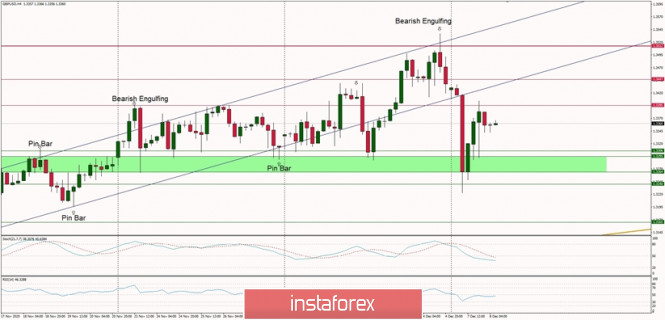
Technical Analysis of EUR/USD for December 9, 2020 2020-12-09 Technical Market Outlook: After the EUR/USD pair had made a Shooting Star candlestick pattern around the level of 1.2163 the volatility has significantly decreased. The local low was made at the level of 1.2078, just below the intraday technical support seen at 1.2088 and since then not much changed and no new developing occurred. Any violation of the lower acceleration channel line will be bearish, so the market participants should keep an eye on the level of 1.2000 again. Please notice, the momentum is now hovering around the neutral level of fifty and the market is coming of the overbought conditions. Weekly Pivot Points: WR3 - 1.2496 WR2 - 1.2335 WR1 - 1.2244 Weekly Pivot - 1.2088 WS1 - 1.1996 WS2 - 1.1828 WS3 - 1.1738 Trading Recommendations: Since the middle of March 2020 the main trend is on EUR/USD pair has been up. This means any local corrections should be used to buy the dips until the key technical support is broken. The key long-term technical support is seen at the level of 1.1609. The key long-term technical resistance is seen at the level of 1.2555. 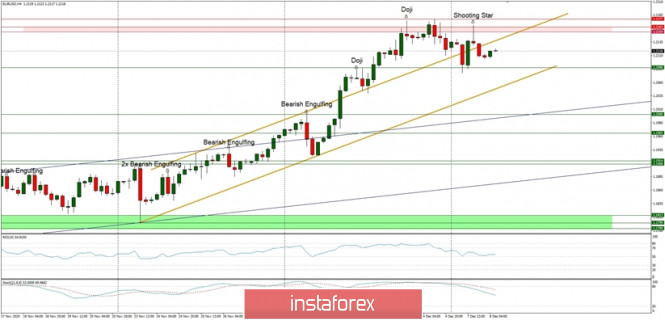
Elliott wave analysis of EUR/JPY for December 9, 2020 2020-12-09 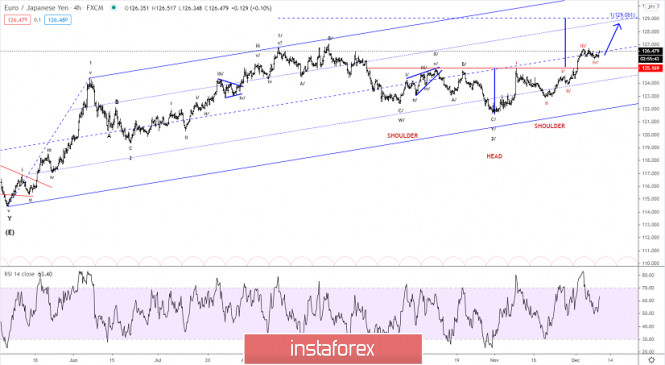
EUR/JPY has recovered nicely from the corrective low of 125.83 and is currently testing short-term key resistance at 126.49. A break above this resistance will confirm the completion of the correction and the on-set of the next impulsive rally higher to 129.06 which marks the S/H/S bottom target. Support is now seen at 126.27 and again at 125.83. R3: 127.75 R2: 127.30 R1: 126.66 Pivot: 126.49 S1: 126.27 S2: 125.83 S3: 125.61 Trading recommendation: We are long EUR from 123.43 with our stop placed at 125.50. Upon a break above 126.49 we will raise our stop to 125.80 EUR/USD. Conficiting fundamental background between COVID-19 and vaccine 2020-12-09 The US dollar index continues to slowly but surely decline, reflecting the ratio of the currency market to the US currency. If the indicator was at the level of 92.7 points a month ago, then currently, it has dropped to the level of 90.74 points. The downward movement is calm, not impulsive, and is accompanied by corrective pullbacks. However, the trend is still clearly visible: the currency market has stopped favoring the US dollar, and is now in demand only occasionally, when there is a surge of anti-risk sentiment among traders. Meanwhile, the overall fundamental background remains optimistic. First of all, this is due to the upcoming mass vaccination against coronavirus in the United States and Europe. This process has already started in the UK, while the EU countries and the States are on standby. Still, the emerging anticipation allows traders to show interest in risky assets, while the safe dollar has shifted from a recent favorite to an outsider. 
It should be noted that the COVID-19 situation continues to be difficult in Europe, and even more so in the United States. And although the European lockdowns helped slow down the spread of this virus, it is too early to speak of a stable downward trend. In this regard, key EU countries are extending quarantine restrictions until mid-January, and some of them (for example, Switzerland) are significantly tightening lockdown conditions. In turn, Germany, Italy and France lead the anti-records in terms of the number of new cases of COVID-19. As for the United States, the situation looks even more difficult. Yesterday, more than 192 thousand new COVID-19 cases were identified, and this is not unusual. All over the past week, US daily growth in the number of cases fluctuated in the region of 190-200 thousand. The governors of California and New York have already warned that hospitals in these regions will face a crisis soon, in the form of shortage of beds, ventilators, doctors and medical personnel. All the above information is remarkable in the currency market and does not provoke an increase in anti-risk sentiment. For example, in early autumn, at the start of the second wave of coronavirus globally, such news reports pushed the US currency up throughout the market. A similar trend was observed when European countries began to introduce quarantine. The US dollar proved to be useful as a protective instrument or as a kind of "safety island". However, we are seeing a different picture this time. COVID-19 continues to set anti-records and close countries to quarantine, but the USD no longer benefits from the current situation. The negative news flow regarding the spread of this virus is overlapped with news about the vaccine against it. Moreover, the largest pharmaceutical companies reached the final stage of their development almost simultaneously, so the information space is now filled with news about vaccines, their certification, effectiveness, supply plans, and so on. Such information contributes to the growth of risk sentiment in the currency market. Yesterday's news is an example of this. It became known that the US Sanitary Inspection Agency recognized the vaccine of the German pharmaceutical company BioNTech and the American Pfizer as safe. The regulator said the results of the clinical trials did not raise any safety concerns that could preclude an emergency product approval. Moreover, the FDA stressed that the vaccine provides significant protection after the first dose. This means that the US regulator has approved the vaccine, indicating that the process of mass vaccination in the States can start in the next few days. It also became known that the vaccine manufacturers (BioNTech and Pfizer) are working on a new version of the drug, which is not necessary to be stored at a temperature of -70 degrees – it is currently the main disadvantage of this vaccine. At the same time, today's news that the vaccination process has already started in Britain, and Europe is at the final stage of drug certification supported this. According to representatives of the European Commission, the first vaccines against coronavirus can be delivered to EU member states in three weeks. All countries that participate in the joint procurement of the European Union will also receive the vaccine at the same time. Thus, the general news flow is "black and white", which means it opposes each other. On one hand, the number of COVID-19 cases and lockdowns are rising, while on the other hand, the availability and the process of the vaccines against COVID-19 are starting. Judging by the dynamics of the dollar and risky currencies, traders remain optimistic, while ignoring the warning signals. 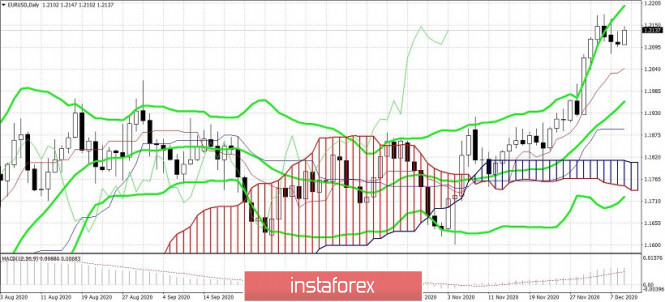
If we talk directly about the EUR/USD pair, the main upward target is still the level of 1.2200 (upper line of the BB indicator on the daily time frame). It is advisable to consider long positions by the end of tomorrow, since the ECB's meeting will be held and the data on the growth of US inflation will also be published. These fundamental factors can provoke a deeper corrective pullback (main risk in this context is associated with the ECB). But if we generally talk about medium-term and long-term prospects, then the upward trend remains in force. Therefore, opening longs with the above-mentioned target can be considered on price downturns. GBP/USD and EUR/USD: What prevents the UK and the EU from concluding a trade deal? FDA may approve the release of COVID-19 vaccine this weekend. 2020-12-09 The concessions on the part of the UK, on the one hand, is a step towards the EU, while on the other hand, does not, in any way, solve the disagreements that the two parties have on a number of key issues. 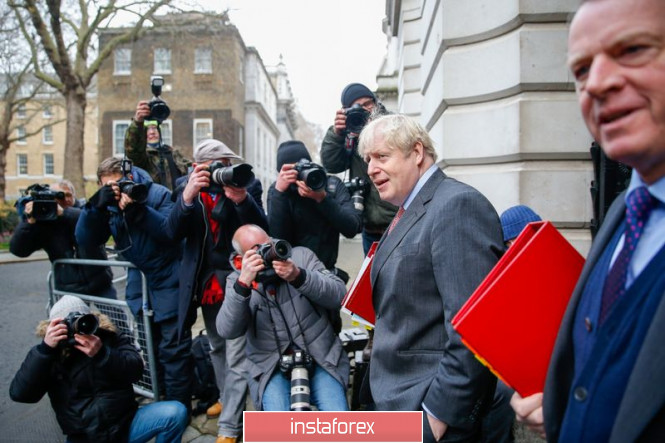
Yesterday, the UK announced that it is abandoning the most controversial provisions of the internal market bill. Earlier, the parliament has included a clause which stated that Northern Ireland will continue to follow the EU's custom's rules and its rule on product standards, which will make checks on goods traveling from Northern Ireland (a non-EU country) to the Republic of Ireland (an EU country) unnecessary. The cancellation of this law allows a return to the previous rules for regulating the supply of goods from and to the EU, with an undoubted plus that now, there is no need to create a physical border on Ireland. But even if the UK decided to drop this provision, there are still a number of key issues that prevent the UK and the EU from concluding a deal. - One of the pressing issues is that the parties differ significantly on access to fishing areas in the UK. Although some experts note that this issue does not have economic significance and is more political, the UK government does not agree on this and is not going to allow the EU into the waters of the UK.
- Another stumbling block is the principles of decision-making on the provision of state support. To put it simply, the EU wants an independent agency to be created in the UK, the purpose of which is to block government subsidies allocated to support businesses if necessary. The EU wants this so that money will not pour abundantly, as such would create problems on the development of European companies, which may have less funding. According to them, "independent guys" should control this issue.
- The legal regime imposed by the EU, according to which the UK will need to strengthen standards for labor protection, environment and social security, also raises many questions.
- The last point is the measures to which the parties can resort in case the other party violates a rule.
These issues are what politicians have been talking about over the past 8 months. Today, UK Prime Minister, Boris Johnson, met with European Commission President, Ursula von der Leyen, to try to resolve all these issues. But if both parties fail to make concessions, then starting from January 1, 2021, general rules will come into force, according to which part of the trade turnover between the UK and the EU will begin to be subject to duties. Therefore, today's meeting is very crucial, especially since the UK refuses to extend the transition period, and there is very little time left until the deadline of negotiations. In addition, a deal has to be concluded now since it will still have to go through the European Parliament and the British Parliament. As for the GBP / USD pair, the technical picture remained the same. The target of sellers is still the level of 1.3340, a breakout of which will immediately bring the pound to quotes 1.2390 and 1.3220. Meanwhile, the bull market will resume if the pound consolidates above 1.3380, and such will push the quote towards 1.3440 and 1.3490. EUR / USD Yesterday, US Treasury Secretary Steven Mnuchin proposed a $ 916 billion bailout bill to the US Congress. According to him, House Speaker Nancy Pelosi is not against this. He also assured that 140 billion of this amount will be taken from the unused funds of the wage support program, while another 429 billion will be raised from the funds of the Ministry of Finance. 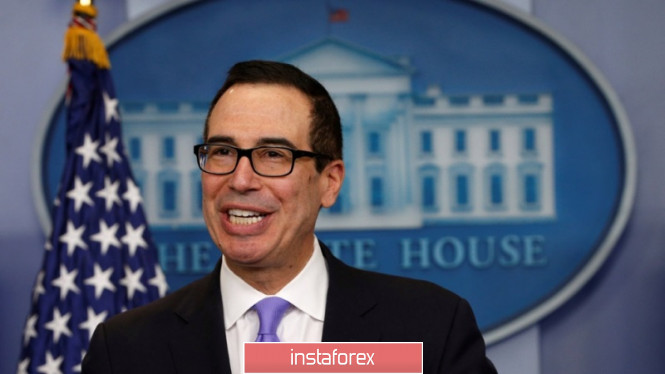
Meanwhile, incumbent US President, Donald Trump, made his own "adjustments" to the new aid package. He said that it is necessary to reduce the proposed amount of unemployment benefits, which are currently being discussed by both parties of the House of Representatives and the Senate, from $ 180 billion to $ 40 billion. This proposal drew criticism from the Democrats. Aside from that, the presidential administration has asked Republican senators to include in the package a $ 600 direct payments to citizens. The $ 908 billion stimulus package currently under discussion does not yet include such provisions. In any case, although adjustments and changes are being made, it is clear that the parties are moving in the right direction and, most likely, a common agreement will be reached in the near future. The International Monetary Fund is actively monitoring this, and yesterday, its chief economist, Gita Gopinath said a US aid package amid the coronavirus pandemic would be very useful. Clearly, the IMF sees the need for assistance to state and local governments in the United States. On the topic of COVID-19, the US Food and Drug Administration (FDA) said yesterday that Pfizer and BioNTech's vaccine is fully effective and could be approved as early as this weekend. Once permission is received, Pfizer can begin shipping it. With regards to the EURUSD pair, a lot will depend on the decisions that will be taken today on Brexit. The breakout of 1.2177 will lead to a new bull market capable of bringing the euro to 1.2260, 1.2340 and 1.2420. But if the pressure on risky assets returns, and this will be due to failed trade negotiations, the quote may move below 1.2080, which will lead to a further collapse towards 1.1990 and 1.1880. Forex forecast 12/09/2020 on USD/CAD, AUD/USD and Crude Oil from Sebastian Seliga 2020-12-09 Let's take a look at the AUD/USD and USD/CAD technical picture on the dialy time frame chart. Ahead of the scheduled data release, the Crude Oil analysis is included as well. Gold strives to reach new levels 2020-12-09  Gold is trying to break new records by the middle of this month, and its efforts did not end in nothing. Based on the observations of analysts, gold's quote is rising for the second session in a row, which is not the limit. Therefore, they expect this precious metal to further grow. Moreover, several experts believe that the decline in the yield of US government bonds and the prospects for a new stimulus package in the US primarily supports the yellow metal. Last night, its quotes soared near the previously reached two-week highs. The strong volatility of the US dollar and lower yields on Treasury bonds made the indicated metal more attractive. So today, gold tried to maintain its position, trading near $ 1861– $ 1862 per ounce. 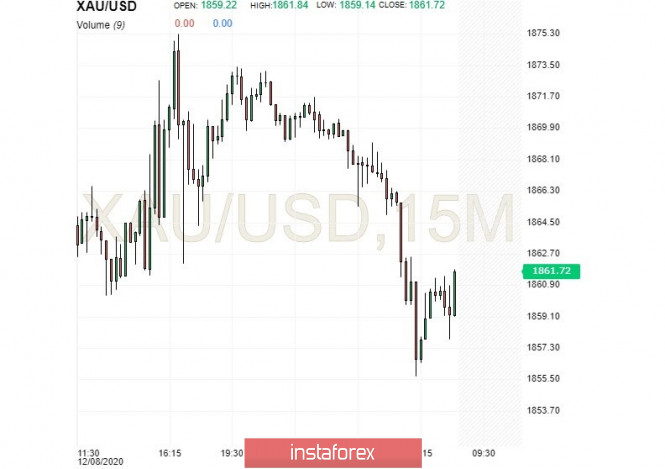 According to experts, the rally in gold prices reached its peak after the US labor market published its report. It should be recalled that the indicator for the third quarter of 2020, showing the level of labor productivity outside of US agriculture, was revised down (to +4.6%) from the previous +4.9%. Based on technical analysis, gold's quotes have broken through the key level of $ 1850 per ounce, which was recently considered the nearest support. This is the last time "gold" quotes surprised the market with a noticeable increase, quickly recovering from a short-term decline. The reduction in real interest rates and the total weakening of the US currency also contributed to this growth. However, experts were recently concerned about the precious metals market due to a particular matter – the recent massive capital outflow from the "gold" exchange-traded funds (ETF). This was facilitated by factors such as a surge of liquidity, expectations of additional stimulus from the ECB and the Fed, and hopes for the early introduction of effective vaccines against COVID-19. As a result of such a policy, gold unfortunately lost its advantages temporarily. Most analysts estimate that the monetary policy (MP) of the leading central banks will remain soft next year. Experts are sure that this situation is good for the gold, and it will try to reach new levels and conquer them. At the moment, the yellow metal is set to reach this target, aiming for its largest annual growth in a decade. An invaluable support is provided by massive monetary stimulus aimed at fighting the COVID-19 pandemic. Gold rallies as markets overestimate the level of risk in the system 2020-12-09 
Gold rallies amid hopes for additional US stimulus According to Rhona O'Connell, head of market analysis for EMEA and Asia at StoneX, the yellow metal is rising because markets are overestimating the level of risk in the system. As the week goes on, many will focus on the issue of stimulus, especially since US politicians continue to debate on the coronavirus relief package and $ 1.4 trillion spending bill, with Friday seen as the deadline. One way to postpone the deadline (by one week) would be a congressional vote on a temporary funding bill, which will allow more time to reach agreement on both costs and COVID-19 relief. Meanwhile, another reason that fueled the hopes for a new stimulus, and accordingly, the rise of gold, is fear of inflation. Fritsch said, "new economic aid, financed by debt, will lead to higher inflation expectations. Central banks have already pledged to continue their over-expansionary monetary policy, and real interest rates are moving deeper in the negative direction. These are key arguments in favor of rising gold prices. " In the meantime, strategists at TD Securities said, "beyond the fiscal stimulus, there is the Federal Reserve, which is meeting next week for the last time this year," They added that inflationary expectations will be one of the main drivers for gold in 2021. 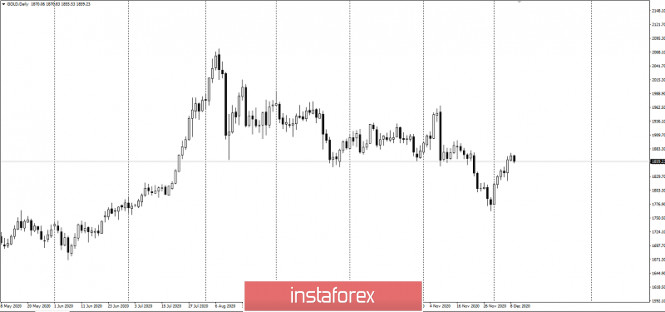
"The Fed is likely to extend the maturity of its Treasury purchases, thereby bolstering precious metals," they said. "The ongoing economic recovery will once again help increase the demand for gold. In fact, market expectations continue to point to rising inflationary expectations, which should eventually force capital to take refuge in gold, as nominal returns remain constrained. " Another major boost to monitor this month is the flows of gold-backed ETFs, which peaked in October and recorded an outflow in November.
Author's today's articles: Maxim Magdalinin  In 2005 graduated from the Academy of the Ministry of Internal Affairs of the Republic of Belarus, law faculty. Worked as a lawyer for three years in one of the biggest country's company. Besides the trading, he develops trading systems, writes articles and analytical reviews. Works at stock and commodity markets explorations. On Forex since 2006. In 2005 graduated from the Academy of the Ministry of Internal Affairs of the Republic of Belarus, law faculty. Worked as a lawyer for three years in one of the biggest country's company. Besides the trading, he develops trading systems, writes articles and analytical reviews. Works at stock and commodity markets explorations. On Forex since 2006. Sergey Belyaev  Born December 1, 1955. In 1993 graduated from Air Force Engineering Academy. In September 1999 started to study Forex markets. Since 2002 has been reading lectures on the technical analysis . Is fond of research work. Created a personal trading system based on the indicator analysis. Authored the book on technical analysis "Calculation of the next candlestick". At present the next book is being prepared for publishing "Indicator Analysis of Forex Market. Trading System Encyclopedia". Has created eleven courses on indicator analysis. Uses classical indicators. Works as a public lecturer. Held numerous seminars and workshops presented at international exhibitions of financial markets industry. Is known as one of the best specialists in the Russian Federation researching indicator analysis. Born December 1, 1955. In 1993 graduated from Air Force Engineering Academy. In September 1999 started to study Forex markets. Since 2002 has been reading lectures on the technical analysis . Is fond of research work. Created a personal trading system based on the indicator analysis. Authored the book on technical analysis "Calculation of the next candlestick". At present the next book is being prepared for publishing "Indicator Analysis of Forex Market. Trading System Encyclopedia". Has created eleven courses on indicator analysis. Uses classical indicators. Works as a public lecturer. Held numerous seminars and workshops presented at international exhibitions of financial markets industry. Is known as one of the best specialists in the Russian Federation researching indicator analysis. Sebastian Seliga  Sebastian Seliga was born on 13th Oсtober 1978 in Poland. He graduated in 2005 with MA in Social Psychology. He has worked for leading financial companies in Poland where he actively traded on NYSE, AMEX and NASDAQ exchanges. Sebastian started Forex trading in 2009 and mastered Elliott Wave Principle approach to the markets by developing and implementing his own trading strategies of Forex analysis. Since 2012, he has been writing analitical reviews based on EWP for blogs and for Forex websites and forums. He has developed several on-line projects devoted to Forex trading and investments. He is interested in slow cooking, stand-up comedy, guitar playing, reading and swimming. "Every battle is won before it is ever fought", Sun Tzu Sebastian Seliga was born on 13th Oсtober 1978 in Poland. He graduated in 2005 with MA in Social Psychology. He has worked for leading financial companies in Poland where he actively traded on NYSE, AMEX and NASDAQ exchanges. Sebastian started Forex trading in 2009 and mastered Elliott Wave Principle approach to the markets by developing and implementing his own trading strategies of Forex analysis. Since 2012, he has been writing analitical reviews based on EWP for blogs and for Forex websites and forums. He has developed several on-line projects devoted to Forex trading and investments. He is interested in slow cooking, stand-up comedy, guitar playing, reading and swimming. "Every battle is won before it is ever fought", Sun Tzu Torben Melsted  Born in November 1962. Graduated from CBS, got Diploma in Finance. Began trading on Forex in 1986 and since that time held various positions such as advising clients, hedging client flows on FX and commodity markets. Also worked for major corporations as Financial Risk Manager. Uses Elliott wave analysis in combination with classic technical analysis, and has been using a Calmar Ratio of 5.0 for over 3 years. Has his own blog, where he uses Elliott wave and technical analysis on all financial markets. Born in November 1962. Graduated from CBS, got Diploma in Finance. Began trading on Forex in 1986 and since that time held various positions such as advising clients, hedging client flows on FX and commodity markets. Also worked for major corporations as Financial Risk Manager. Uses Elliott wave analysis in combination with classic technical analysis, and has been using a Calmar Ratio of 5.0 for over 3 years. Has his own blog, where he uses Elliott wave and technical analysis on all financial markets. Irina Manzenko  Irina Manzenko Irina Manzenko Pavel Vlasov  No data No data l Kolesnikova  text text Andrey Shevchenko  Andrey Shevchenko Andrey Shevchenko
Subscription's options management Theme's:
Fundamental analysis, Fractal analysis, Wave analysis, Technical analysis, Stock Markets
Author's :
A Zotova, Aleksey Almazov, Alexander Dneprovskiy, Alexandr Davidov, Alexandros Yfantis, Andrey Shevchenko, Arief Makmur, Dean Leo, Evgeny Klimov, Fedor Pavlov, Grigory Sokolov, I Belozerov, Igor Kovalyov, Irina Manzenko, Ivan Aleksandrov, l Kolesnikova, Maxim Magdalinin, Mihail Makarov, Mohamed Samy, Mourad El Keddani, Oleg Khmelevskiy, Oscar Ton, Pavel Vlasov, Petar Jacimovic, R Agafonov, S Doronina, Sebastian Seliga, Sergey Belyaev, Sergey Mityukov, Stanislav Polyanskiy, T Strelkova, Torben Melsted, V Isakov, Viktor Vasilevsky, Vladislav Tukhmenev, Vyacheslav Ognev, Yuriy Zaycev, Zhizhko Nadezhda
Edit data of subscription settings
Unsubscribe from the mailing list Sincerely,
Analysts Service | If you have any questions, you can make a phone call using one of the
InstaForex Toll free numbers right now:
|  |  InstaForex Group is an international brand providing online trading services to the clients all over the world. InstaForex Group members include regulated companies in Europe, Russia and British Virgin Islands. This letter may contain personal information for access to your InstaForex trading account, so for the purpose of safety it is recommended to delete this data from the history. If you have received this letter by mistake, please contact InstaForex Customer Relations Department. |


 In 2005 graduated from the Academy of the Ministry of Internal Affairs of the Republic of Belarus, law faculty. Worked as a lawyer for three years in one of the biggest country's company. Besides the trading, he develops trading systems, writes articles and analytical reviews. Works at stock and commodity markets explorations. On Forex since 2006.
  Born December 1, 1955. In 1993 graduated from Air Force Engineering Academy. In September 1999 started to study Forex markets. Since 2002 has been reading lectures on the technical analysis . Is fond of research work. Created a personal trading system based on the indicator analysis. Authored the book on technical analysis "Calculation of the next candlestick". At present the next book is being prepared for publishing "Indicator Analysis of Forex Market. Trading System Encyclopedia". Has created eleven courses on indicator analysis. Uses classical indicators. Works as a public lecturer. Held numerous seminars and workshops presented at international exhibitions of financial markets industry. Is known as one of the best specialists in the Russian Federation researching indicator analysis.
  Sebastian Seliga was born on 13th Oсtober 1978 in Poland. He graduated in 2005 with MA in Social Psychology. He has worked for leading financial companies in Poland where he actively traded on NYSE, AMEX and NASDAQ exchanges. Sebastian started Forex trading in 2009 and mastered Elliott Wave Principle approach to the markets by developing and implementing his own trading strategies of Forex analysis. Since 2012, he has been writing analitical reviews based on EWP for blogs and for Forex websites and forums. He has developed several on-line projects devoted to Forex trading and investments. He is interested in slow cooking, stand-up comedy, guitar playing, reading and swimming. "Every battle is won before it is ever fought", Sun Tzu
  Born in November 1962. Graduated from CBS, got Diploma in Finance. Began trading on Forex in 1986 and since that time held various positions such as advising clients, hedging client flows on FX and commodity markets. Also worked for major corporations as Financial Risk Manager. Uses Elliott wave analysis in combination with classic technical analysis, and has been using a Calmar Ratio of 5.0 for over 3 years. Has his own blog, where he uses Elliott wave and technical analysis on all financial markets.
  Irina Manzenko
  No data
  text
text  Andrey Shevchenko
No comments:
Post a Comment