| Trading plan for the EUR/USD pair on December 9. Euro forms a narrow consolidation ahead of ECB meeting tomorrow. 2020-12-09 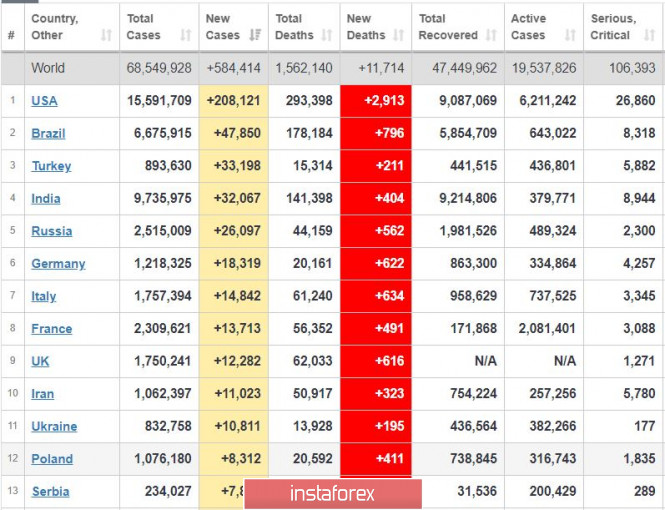
Global COVID-19 incidence increased again to 580,000 a day, but nonetheless is still below the peak which is 600,000. One of the reasons is the increased morbidity in the United States, up to 208,000 yesterday (below the peak). Deaths have also averaged around 3,000, but this is only due to the high number of patients a few days ago (280,000) caused by increased contact amid Thanksgiving Day. In Europe, authorities are acting more harshly and sensibly. Germany introduces tough quarantine measures which will begin on Christmas until January 3-10. The vacation of students will also be extended. Meanwhile, the UK has published a vaccination plan. People over 80 will be vaccinated first, followed by citizens over 65, and so on. This is logical since mortality from the coronavirus increases sharply with the age of patients. Obviously, the aim of this plan is to reduce mortality at a faster rate than the decline in morbidity. 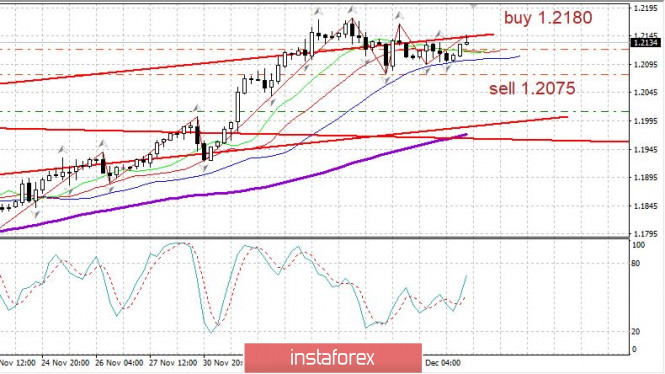
EUR/USD - euro continues to form a narrow consolidation ahead of the ECB meeting tomorrow (this, however, does not exclude the possibility that movement will start before the ECB's decision!). But since an upward trend remains, continue setting up long positions, even at a breakout of 1.2180. Meanwhile, open short positions from 1.2075 down. Still, please closely monitor the situation. Good luck! Trading recommendations for EUR/USD and GBP/USD pair on 12/09/20 2020-12-09 Past review of EUR/USD pair The Euro showed low activity yesterday, only earning 38 points, as the quotes stood in one place all day. What was published on the economic calendar? The third estimate of GDP for the third quarter, which came out slightly better than expected, was published in Europe. There was a slowdown in the rate of economic decline from -14.8 to -4.3% against the forecasted decline of -4.4%. However, the market did not react to this, probably due to high pressure from the informational background of Brexit – trade negotiations between England and Brussels, which were stopped and are awaiting further steps. US statistics were not released. What happened on the trading chart? There was literally nothing interesting. The quote focused on the range of 1.2095/1.2133, where it was impossible to trade due to extremely low activity. Experienced traders refer to this kind of stop as a process of accumulating trading power, which can eventually lead to an acceleration in the market activity. Past review of GBP/USD pair Yesterday, the pound managed to show local activity by about 100 points, but the overall dynamics remained within the limits of a sideways price fluctuation. What was published on the economic calendar? No significant statistics were published in Britain, similarly in the US. As before, the market was focused on Brexit's information flow. But since the bilateral negotiations were suspended, the attention shifted to British Prime Minister, Mr. Boris Johnson and his intention to change the crisis situation in the negotiations. What happened on the trading chart? The pound spent the previous day within the limits of 1.3300/1.3400, where there were occasional surges of activity - as for example, at 12:15 and 14:45 Universal Time. However, it is still related to the incoming Brexit information. 
Trading recommendation for EUR/USD on December 9 In terms of the economic calendar, US data on open vacancies is the only data that will be published today. Its value is expected to decline from 6 436 thousand to 6 400 thousand. But there may be no reaction to the statistics, due to the fact that US data are released during the closing period of the European session and the European Central Bank is expected to meet tomorrow. For the technical analysis, it can be seen that the limits of the previous day's stagnation 1.2095/1.2133 were broken in the upward direction, but there was no acceleration after that. It is assumed that the stagnation has only expanded its borders, and so, we paid special attention to two values: the low of the beginning of the week is 1.2078 and the local high is 1.2177. Trading recommendations can be made considering the available information: - Buying a currency pair at a price above 1.2180, with the prospect of moving to the level of 1.2250 is recommended. - Selling a currency pair at a price below 1.2070, with the prospect of moving to 1.2000 is recommended. 
Trading recommendation for GBP/USD on December 9 Statistics from the UK and the US are not expected today in regards to the economic calendar. Therefore, market participants will continue to track information on Brexit trade negotiations. We will pay special attention to the meeting between Britain's Prime Minister, Mr. Boris Johnson and the European Commission's head, Ms. Ursula von der Leyen. The market reaction to the Brexit information flow has an ordinary form. It was mentioned that positive information on trade negotiations leads to pound's strengthening, while negative news leads to its weakening. In terms of technical analysis, the quote remains within the range of 1.3300/1.3400, but as soon as there is information about the meeting of the British Prime Minister with the head of the European Commission, further impulses will appear, where one or another border of the range will be broken depending on the nature of the information. 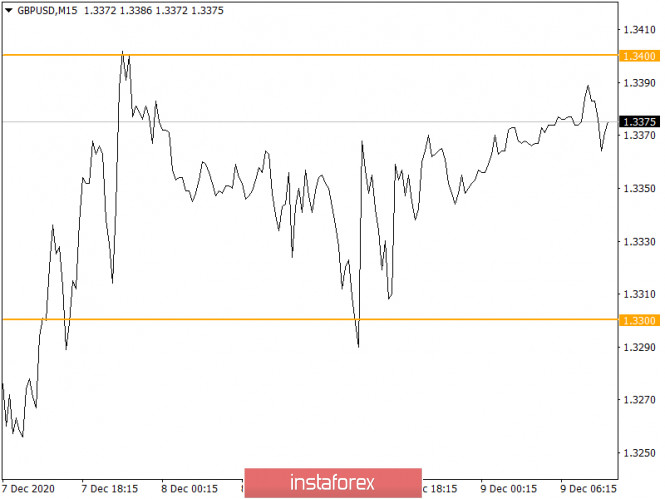
EUR/USD analysis for December 9, 2020. Poland and Hungary refuse to lift their veto 2020-12-09 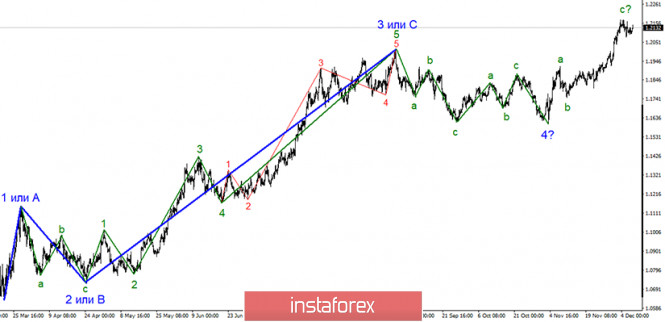
The wave pattern for the EUR/USD pair still indicates the formation of the upward trend. The upward wave C is still forming. It made a successful attempt to break through the high of the wave 3 or C. Thus, the formation of the next three ascending waves continues. Also, the current ascending section of the trend may turn into a five-wave structure. 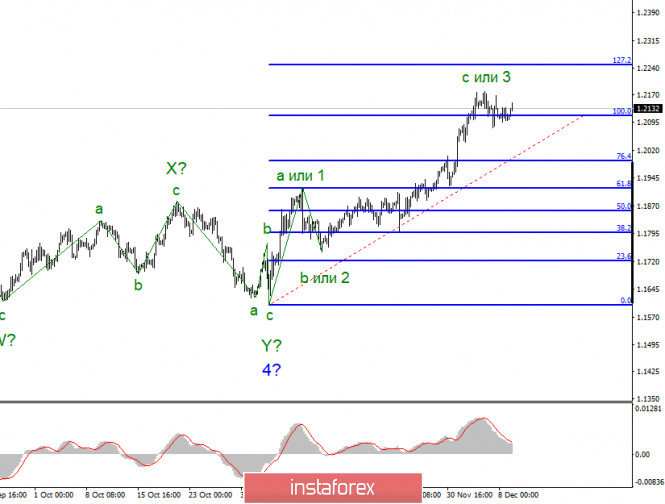
The wave pattern in a lower time frame also indicates that the formation of the next three-wave section of the trend continues. Alternatively, the wave pattern of the trend section that started on November 4, is transforming into a five-wave structure. A successful attempt to break through the high of the wave 3, or C, indicates the bullish movement. At the same time, the trend may be completed by the formation of the wave C, followed by the formation of new three descending waves. In yesterday's review, I mentioned two important events to take place in the eurozone this week that could have a strong influence on the EUR/USD pair. Firstly, it is the ECB meeting. During the course of the meeting, the regulator is expected to expand the stimulus package. Lastly, it is the EU summit. During the course of the summit, European partners should approve a coronavirus recovery fund and a long-term budget. Earlier, Poland and Hungary imposed a veto on both the budget and the fund. These countries managed to veto both projects at once since they had been discussed together. But if viewed separately, the fund and the budget can be adopted without the approval of Poland and Hungary. At least that's what European officials say. The European Union and Germany sent a formal request to Warsaw and Budapest demanding to overturn their veto. In addition, the EU threatened the two countries with a 'Plan B'. According to his plan, Poland and Hungary may be left without any money from the recovery fund. However, the leaders of Poland and Hungary responded with a definitive refusal. Consequently, the issue will be tackled tomorrow during the EU summit. Market participants can only guess how things might end. Some experts suggest that Poland and Hungary may be denied access to the recovery fund. Others claim that the two countries will be denied access to both the recovery fund and the 2021-2027 budget. Meanwhile some analysts argue that it will be impossible to adopt the budget and the fund without a unanimous approval of all 27 EU countries. By the end of this week, it should be clear whether the parties will be able to find a common solution. Currently, the situation looks similar to the one with the Brexit trade deal. The sides have completely different opinions on the issue. Hungary and Poland object to a clause that links funding with adherence to the rule of law. Meanwhile, the rest of the European Union members give their approval. General conclusion and recommendations: The euro/dollar pair is currently trading in a three-wave upward trend. However, it is also possible that the bullish movement has already come to an end. Thus, I recommend that you be extremely careful when buying the instrument and consider opening short positions. Despite the fact that the wave 5 is currently being formed, it will be completed soon. Nevertheless, it is still possible to buy the pair following each of the new MACD buy signals with the targets set near 1.2250, which corresponds to the 127.2% Fibonacci extension level. Technical recommendations for EUR/USD and GBP/USD pair on 12/09/20 2020-12-09 EUR / USD 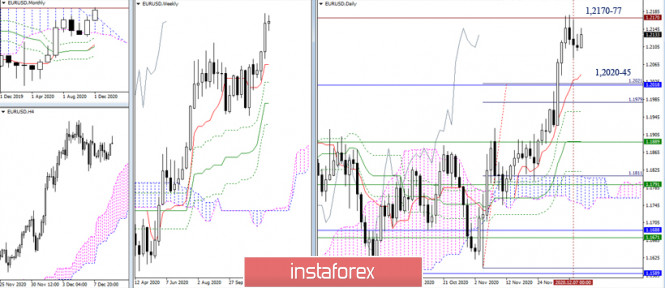 The pair is not in a rush to develop a corrective decline. The daily short-term trend has slightly moved forward today, so the support zone has been expanded to 1.2020-45 (daily Tenkan + monthly Senkou Span B + 100% of the daily target). If the bulls find the strength to complete the correction (highest extremum of the correction is 1.2177) and manage to securely consolidate above, continuing the upward trend, then new prospects will be considered. The nearest pivot point will be the level of 1.2555. 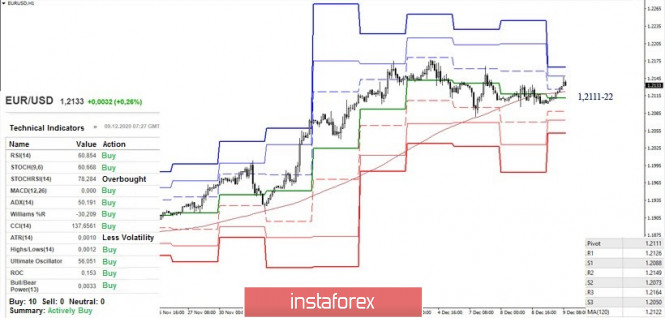 The uncertainty in the higher time frame has led to the fact that the pair works in the attraction zone of key levels in the smaller time frames, alternately moving away from them only for insignificant distances. The key levels in the smaller time frames are currently located in the area of 1.2111-22 (central pivot level + weekly long-term trend). The intervals of intraday support and resistance, formed by classic pivot levels, are narrowed today. The resistance levels can be noted at 1.2149 (R2) - 1.2164 (R3), while support levels are at 1.2088 (S1) - 1.2073 (S2) - 1.2050 (S3). GBP / USD 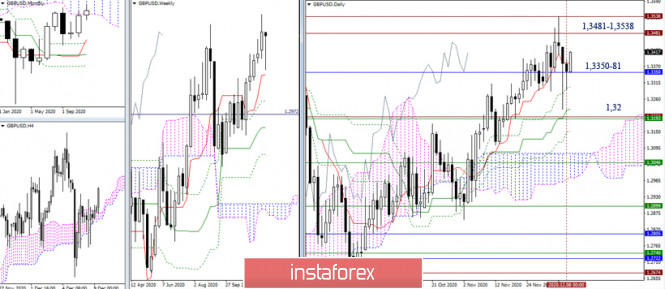 The attempt of the bears failed again and so they had to return to the monthly cloud (above 1.3350) by the close of the day. As a result, the situation has not changed dramatically. The main conclusions and expectations remain the same. On the other hand, the zone of 1.3381 - 1.3350 (daily Tenkan + monthly Senkou Span A) is now the center of attraction and influence. The nearest resistances are located within 1.3481 - 1.3538 (maximum extremes), while the most significant supports are combined around 1.32 (historical level + weekly Tenkan). Today's closest support levels are found at 1.3299 (daily Fibo Kijun) and 1.3225 (daily Kijun). 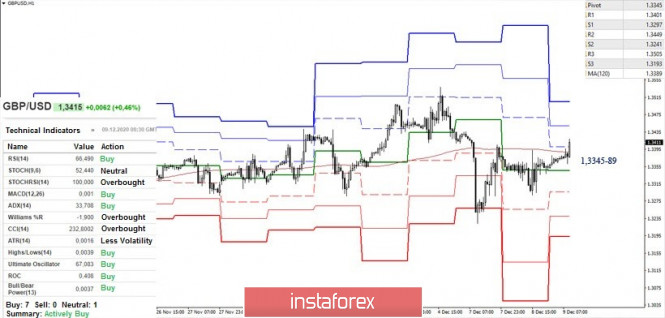 The pair spends most of its time near the key levels of the smaller time frame, which are joining forces today around 1.3345 -89 (central pivot level + weekly long-term trend) and have support from the larger time frames (1.3350-81). Moving above this attraction zone will lead to the strengthening of the bullish moods. In view of this, the resistance levels of 1.3449 (R2) - 1.3505 (R3) can serve as pivots within the day. On the contrary, a decline to the levels (1.3345-89) and a reliable consolidation below will give bears the advantage. Their supports, in the form of classic pivot levels, are located today at 1.3297 - 1.3241 - 1.3193. Ichimoku Kinko Hyo (9.26.52), Pivot Points (classical), Moving Average (120) Trading idea for the USD/CAD pair 2020-12-09  The decline of the USD / CAD pair to rather low prices gave impetus for new upward moves in the market. This means that bulls can get profit, especially if they open long positions from 1.27700 to 1.18300: 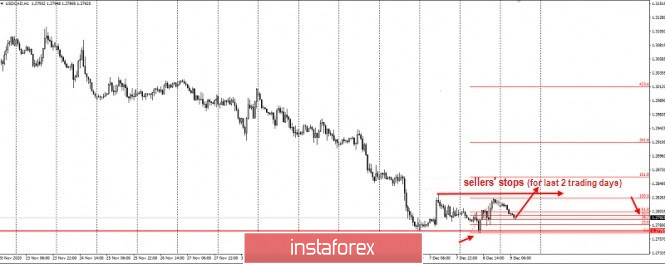 In fact, yesterday's movement can be taken as the primary initiative, while the sellers' stops for the last two trading days can be the target level. Such a transaction has a 1: 1 risk / profit ratio. Then, the stop-loss level will be yesterday's low, while the take profit level will be Monday's high. This is an example of Price Action and Stop Hunting strategies. Of course, traders still need to be careful since this financial market is very uncertain. But, it is also very profitable as long as the right approach is used. Good luck! GBP/USD analysis on December 9. Boris Johnson and Ursula von der Leyen will try to stop the dilemma in the negotiations 2020-12-09 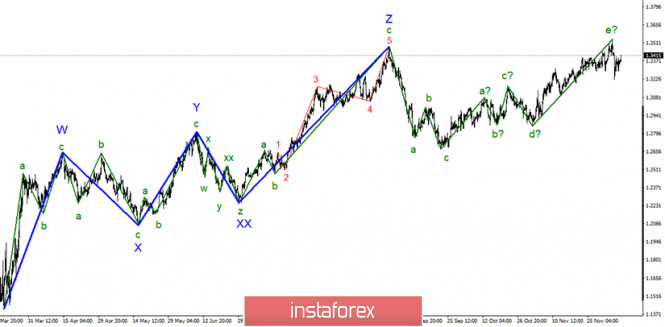
In the most global terms, the upward section of the trend continues to be formed, even despite the departure of quotes from the previously reached highs. Moreover, the wave pattern currently looks quite convincing to be considered complete. The upward wave 5 serves as part of the non-impulse trend section. On the other hand, there was a failed attempt to break through the high of the previous global wave Z. Thus, the markets can now begin selling the pound, which is prepared for a long time. 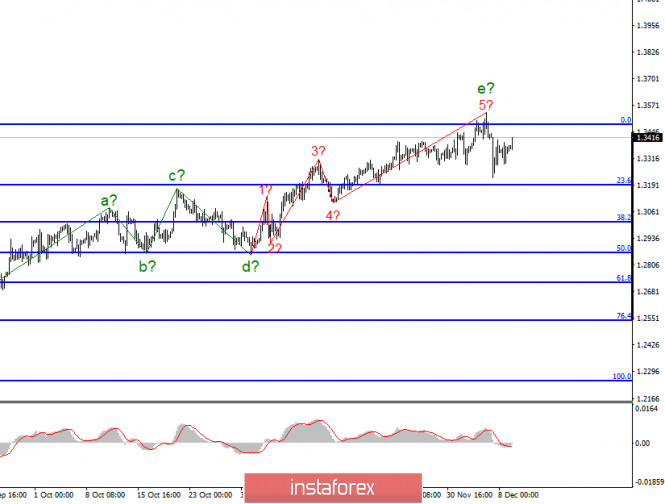
The quotes left the previously reached highs in the smaller time frame, however, the pound's demand is recently growing again, so the entire wave pattern of the upward trend section may become more complicated again and take on an even longer form. Despite the lack of positive news about Brexit, the markets are not in a rush to get rid of the British currency. This leads to more complications of the wave pattern. Today, the instrument has already added about 80 basis points. The negotiating teams of Michel Barnier and David Frost failed to agree on a trade deal. Mr. Barnier, head of the EU negotiating team, said yesterday that there are still significant differences between the parties on three key issues, and he personally believes that the likelihood of a deal is low. So, Prime Minister Boris Johnson personally went to Brussels to meet European Commission's head, Ursula von der Leyen, in order to break the dilemma in the negotiations. It should be recalled that this is not the first meeting of politicians in the context of the Brexit negotiations. Given that the previous meetings did not produce much results, we do not expect that the parties will agree this time. Boris Johnson and Ursula von der Leyen will have to sort out whether there are still opportunities to reach an agreement, or whether they are all completely exhausted. However, it is possible that there will be a conversation about the possible continuation of negotiations in 2021. The EU has repeatedly made it clear that it is ready to extend the terms of negotiations in order to finally conclude an agreement without hurry, but it was Boris Johnson who refused to extend the transition period. In any case, we must now wait for the results of these negotiations. It seems that the markets continue to hope for the best, as the pound is in demand again. All other news for the pound/dollar pair is not important now. In any case, there is no other news at the moment. No economic report was published in either the UK or the United States in the first three days of the week. Thus, the markets continue to trade exclusively on their own expectations of the negotiations' results. Tomorrow morning, several UK reports will be released. These include reports on GDP, industrial production, and trade balance. However, this is unlikely to attract markets' attention, since they will continue to focus on Brexit and trade negotiations. Recommendations and conclusions: Supposedly, the pound/dollar instrument has completed the upward trend. Thus, I recommend to closely monitor the sales of this instrument. The pound is likely to target the 29th mark, so I expect to build at least a three-wave form. At the moment, I suggest to sell the instrument for each MACD sell signals with targets set near the calculated levels of 1.3012 and 1.2866. A successful attempt to break through the 0.0% Fibonacci level will complicate the upward trend and will cancel the sell option. EUR/USD: plan for the American session on December 9 (analysis of morning deals) 2020-12-09 To open long positions on EURUSD, you need: In my morning forecast, I paid attention to the level of 1.2135 and recommended making a decision from it. If you look at the 5-minute chart, you will see that the unsuccessful attempt of the bulls to break above this range and return to this level formed a good sell signal, which is still working at the moment. Several tests of the level of 1.2135 from the bottom up were good points for opening short positions. So far, the movement has been no more than 15 points, however, this is enough to move stop orders to this level, especially considering how low volatility has been observed recently. The lack of important fundamental statistics on the Eurozone and important Brexit negotiations remain the main reason that the pair is in a narrow side channel. 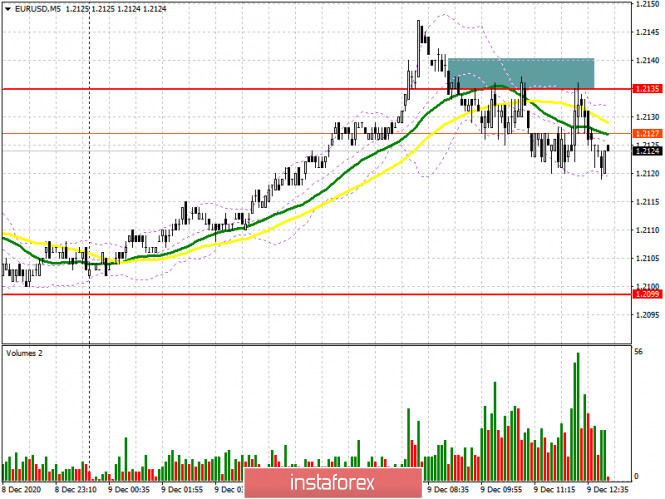
From a technical point of view, nothing has changed, and buyers of the European currency still need to try hard to break above yesterday's resistance of 1.2135. The first attempt was unsuccessful. Only a test of this level over and down after the breakdown forms a good signal to open long positions in the expectation of continuing the upward trend that is currently observed in the market. The main target will be to return to the highs of last week in the area of 1.2177, which has already been tested twice for strength. The fact that the bulls did not achieve an update to this level yesterday also threatens the continuation of the upward trend. Therefore, only a break of 1.2177 will lead to the continued growth of EUR/USD already in the area of highs of 1.2255 and 1.2339, where I recommend fixing the profits. However, this will only happen if there is good news about the final Brexit negotiations, which will be held today in Brussels between British Prime Minister Boris Johnson and European Commission President Ursula von der Leyen. If the euro declines in the second half of the day, only the formation of a false breakout in the support area of 1.2099 will be a signal to open long positions. I recommend buying the pair immediately for a rebound only from the level of 1.2046, based on a correction of 20-25 points within the day. A larger support level is seen around 1.1986. A test of this low will lead to a reversal of the upward trend in the short term. To open short positions on EURUSD, you need to: The sellers of the pound have already achieved the formation of a false breakout in the resistance area of 1.2135, and as long as trading is carried out below this range, we can expect a continuation of the downward correction to the area of the minimum at 1.2099, below which it was not possible to breakthrough yesterday. Only a consolidation below this range with a test from the bottom up will be a good signal to sell EUR / USD to the area of a large minimum at 1.2046, and a further target of the bears will be to close the day in the support area at 1.1986, which will seriously affect the upward trend. If EUR/USD rises above the resistance of 1.2135, it is better not to rush into sales. Good news on the trade agreement is sure to lead to a major increase in the pair. In this scenario, you can only count on short positions from the resistance of 1.2177, provided that a false breakout is formed. Larger highs are seen in the area of 1.2255, from where you can sell EUR/USD immediately for a rebound with the aim of a downward correction of 15-20 points within the day. Given that high volatility and sharp movements of the euro are expected today, do not forget about placing stop orders, which will allow you to avoid losses if you enter the market incorrectly. 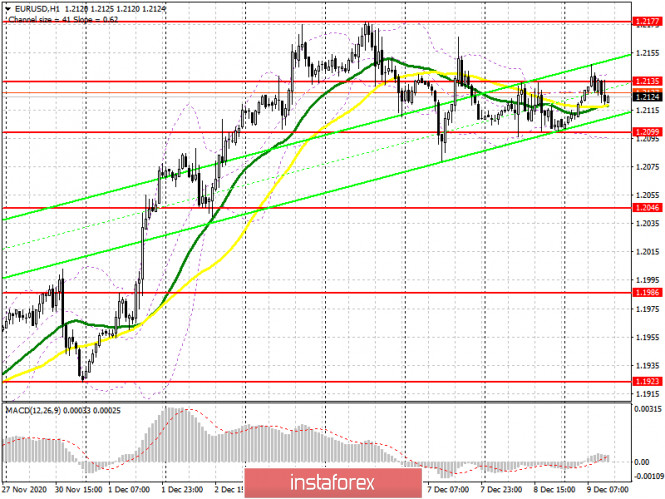
Let me remind you that the COT report (Commitment of Traders) for December 1 recorded an increase in long and a reduction in short positions. Buyers of risky assets believe in the continuation of the bull market, and in the further growth of the euro after breaking the psychological mark in the area of the 20th figure. For example, long non-profit positions rose from 206,354 to 207,302, while short non-profit positions fell to 67,407 from 68,104. the total non-profit net position rose to 139,894 from 138,250 a week earlier. It is worth paying attention to the growth of the delta, observed for the second week in a row, after its 8-week decline, which indicates a clear advantage for buyers and a possible resumption of the medium-term upward trend for the euro. It will be possible to talk about a larger recovery only after European leaders agree with the UK on a new trade agreement. However, we did not get any good news last week, and we have an EU summit ahead of us, which will put the final point in this story. The euro will be supported by news about the lifting of restrictive measures for the Christmas holidays, as well as the absence of major changes in the monetary policy of the European Central Bank. Signals of indicators: Moving averages Trading is conducted around 30 and 50 daily moving averages, which indicates the sideways nature of the market. Note: The period and prices of moving averages are considered by the author on the hourly chart H1 and differ from the general definition of classic daily moving averages on the daily chart D1. Bollinger Bands A break in the lower limit of the indicator around 1.2099 will lead to a larger decline in the pound. A break of the upper limit of the indicator in the area of 1.2135 will lead to an upward trend of the pair. Description of indicators - Moving average (moving average determines the current trend by smoothing out volatility and noise). Period 50. The graph is marked in yellow.
- Moving average (moving average determines the current trend by smoothing out volatility and noise). Period 30. The graph is marked in green.
- MACD indicator (Moving Average Convergence / Divergence - moving average convergence / divergence) Fast EMA period 12. Slow EMA period 26. SMA period 9
- Bollinger Bands (Bollinger Bands). Period 20
- Non-profit speculative traders, such as individual traders, hedge funds, and large institutions that use the futures market for speculative purposes and meet certain requirements.
- Long non-commercial positions represent the total long open position of non-commercial traders.
- Short non-commercial positions represent the total short open position of non-commercial traders.
- Total non-commercial net position is the difference between the short and long positions of non-commercial traders.
Technical analysis of GBP/USD for December 09, 2020 2020-12-09 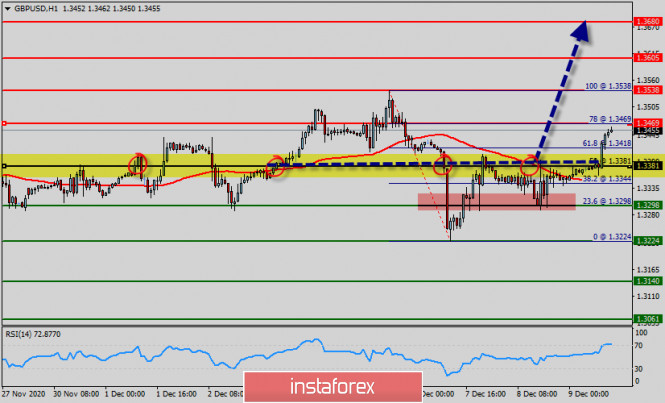 Overview : The Pound gains ground against U.S. Dollar since yesterday. The GBP/USD pair is trying to get to the test of the nearest resistance level at 1.3469 (1st resistance, 78% of Fibonacci retracement levels). The main trend is up according to the daily swing chart. Hence, momentum has been trending higher since Monday, following the formation of a closing price reversal top. A trade through 1.3469 will negate the closing price reversal top and signal a resumption of the uptrend. The Pound is trading higher against the U.S. Dollar on Wednesday, supported by optimistic economic sentiment data from UK. However, the threat of a no-deal Brexit has not deterred the Pound from taking advantage of the weaker US Dollar. A move above the resistance at 1.3469 will push the GBP/USD pair towards the next resistance level at 1.3538. There are no important levels between 1.3381 and 1.3538 so this move may be fast. The long-term 1.3538 resistance level is once again proving to be the undoing on GBP/USD's attempts to push higher. Today, the GBP/USD pair has broken resistance at the level of 1.3381 which acts as support now. The pair has already formed minor support at 1.3381.The strong support is seen at the level of 1.3298 because it represents the weekly support 1. Equally important, the RSI and the moving average (100) are still calling for an uptrend. Therefore, the market indicates a bullish opportunity at the level of 1.3381 in the H1 chart. Also, if the trend is buoyant, then the currency pair strength will be defined as following: GBP is in an uptrend and USD is in a downtrend. Buy above the minor support of 1.3381 with the first target at 1.3469, and continue towards 1.3538 (the weekly resistance 2, double top). On the support side, the nearest support level for the GBP/USD pair is located at 1.3381. If the GBP/USD pair declines below this level, it will move towards the next support at the 100 EMA at 1.3344. A move below the 100 EMA will open the way to the test of the support at 1.3298. On the other hand, if the price closes below the minor support, the best location for the stop loss order is seen below 1.3381; thus, the price will fall into the bearish market in order to go further towards the strong support at 1.3298 to test it again. Furthermore, the level of 1.3224 will form a double bottom. Technical analysis of EUR/USD for December 09, 2020 2020-12-09 Overview : The EUR/USD pair is moving towards the nearest resistance level at 1.2175 while the U.S. dollar is losing ground against a broad basket of currencies. Currently price sets at 1.2110. The EUR/USD pair is trying to get to the test of the nearest support level at 1.2080. If the EUR/USD pair manages to settle above this level (1.2080), it will head towards the next resistance at the recent highs at 1.2175 (double top, 100% of Fibonacci on H1 chart). The minor range is 1.2080 to 1.2175. Its 61.8% level at 1.2080 is controlling the price action today. The EUR/USD pair hit the daily pivot point and resistance at the levels of 1.2021 and 1.2080, because of the series of relatively equal highs and equal lows. But, the pair has dropped down in order to bottom at the point of 1.2109. According to the previous events, the EUR/USD pair is still moving between the levels of 1.2080 and 1.2175; for that we expect a range of 95 pips (1.2175 - 1.2080). If the EUR/USD pair fails to break through the resistance level of 1.2175, the market will decline further to 1.2080. Hence, the major support was already set at the level of 1.2109. Moreover, the double bottom is also coinciding with the major support this week. Additionally, the RSI is still calling for a strong bullish market as well as the current price is also above the moving average 100. Therefore, it will be advantageous to buy above the support area of 1.2080 with the first target at 1.2175. From this point, if the pair closes above the weekly pivot point of 1.2175, the EUR/USD pair may resume it movement to 1.2220 to test the weekly resistance 2. If the trend is able to breakout through the major resistance level of 1.2220. We should see the pair climbing towards the 3rd resistance (1.2262 ) to test it. It would also be wise to consider where to place a stop loss; this should be set below the second support of 1.2021. Forecast : The market is indicating a bearish opportunity below 1.2080; for that it will be good to sell at 1.2080 with the first target of 1.2175. It will also call for an upntrend in order to continue towards 1.2220, then 1.2262. The daily strong support is seen at 1.2021. However, the stop loss should always be taken into account, for that it will be reasonable to set your stop loss at the level of 1.2021. 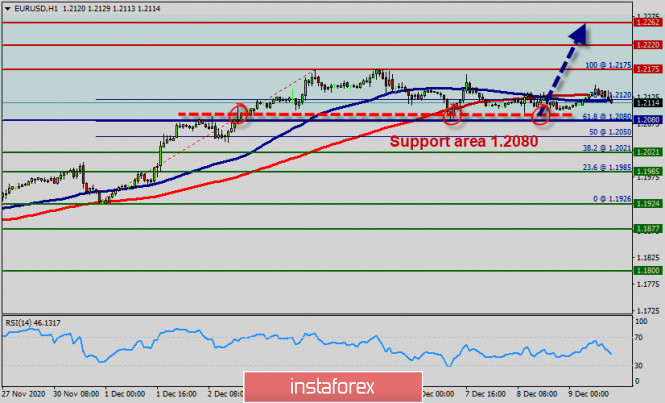 EUR/USD analysis for December 09 2020 - Potential for the upside rotation towards 1.2150 2020-12-09 US MBA mortgage applications w.e. 4 December -1.2% vs -0.6% prior Latest data from the Mortgage Bankers Association for the week ending 4 December 2020 Prior -0.6% - Market index 848.3 vs 858.2 prior
- Purchase index 325.7 vs 342.9 prior
- Refinancing index 3,959.2 vs 3,891.1 prior
- 30-year mortgage rate 2.90% vs 2.92% prior
The drop last week largely stems from a decline in purchase activity, despite the long-term mortgage rate falling by another 2 bps to a record survey low. The drop in purchases is a bit of a setback after a slight bounce in recent weeks but overall levels still suggest that the housing market is holding up well in spite of the virus crisis. Further Development 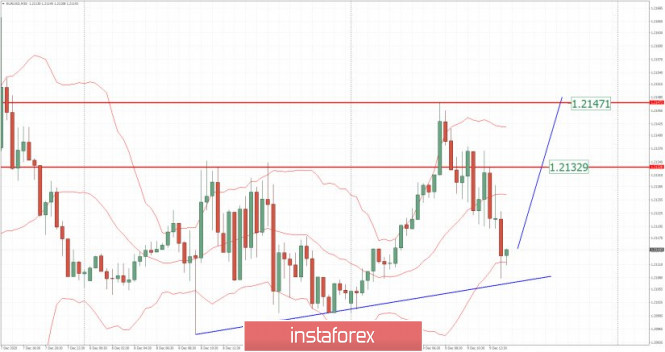
Analyzing the current trading chart of EUR/USD, I found that there is potential for the another upside movement due to exhaustion from sellers. Watch for buying opportunities with the targets at 1,2150 and 1,2200 There is rejection of the support trend line and bottom of the Bollinger band. 1-Day relative strength performance Finviz 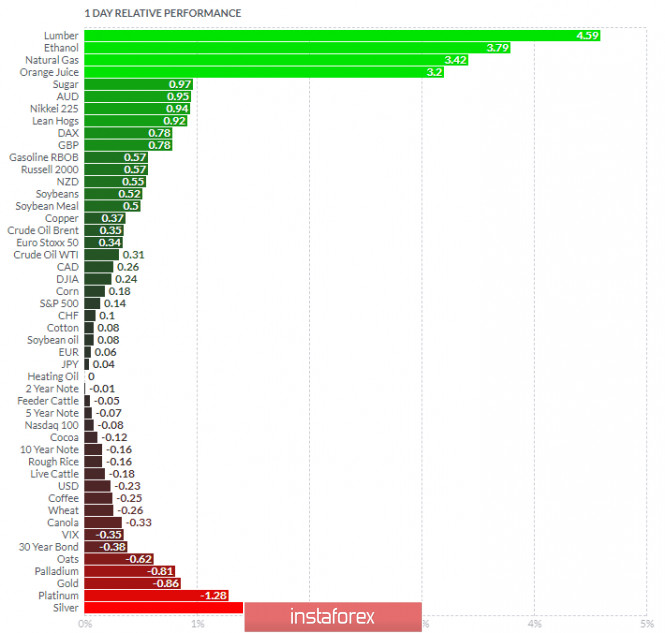
Based on the graph above I found that on the top of the list we got Lumber and Ethanol today and on the bottom Silver and Platinum. Key Levels: Resistance: 1,2145 Support level: 1,2100 Analysis of Gold for December 09,.2020 - Potential completion of the bull flag pattern. Upside opportunities in play.... 2020-12-09 UK PM Johnson: A good deal is still there to be done UK prime minister, Boris Johnson, remarks in parliament - Look forward to discussing Brexit with the EU
- EU wants to take away our control over our fishing waters
- No PM can accept that
- We will prosper with or without a deal
Just some token remarks from Johnson mostly. Again, be reminded that he is scheduled to head over to Brussels later today and meet with European Commission president, Ursula von der Leyen, at 1900 GMT. At this point, it isn't so much so as the technical nitty-gritty, instead it is all about the political compromise to try and nudge things in the right direction. Or at least the optics. 
Further Development 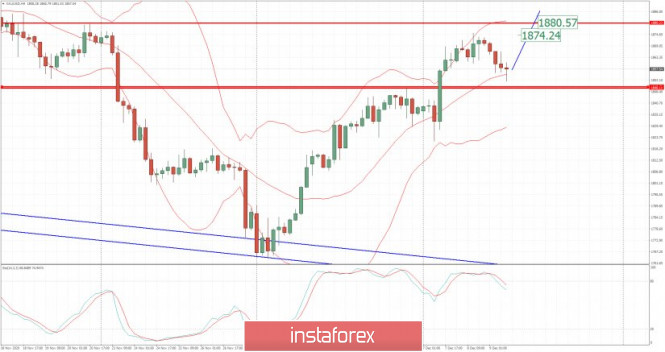
Analyzing the current trading chart of Gold, I found that there is potential for the another upside movement due to potential for the completion of the downside correction. Watch for buying opportunities with the targets at $1,875 and $1,880 Based on the 4H time-frame, I found that there is bull flag pattern in creation, which is good signal for further upside continuation. 1-Day relative strength performance Finviz Based on the graph above I found that on the top of the list we got Lumber and Ethanol today and on the bottom Silver and Platinum. Key Levels: Resistance: $1,874 Support level: $1,848
Author's today's articles: Mihail Makarov  - - Vladislav Tukhmenev  Vladislav graduated from Moscow State University of Technologiy and Management. He entered the forex market in early 2008. Vladislav is a professional trader, analyst, and manager. He applies a whole gamut of analysis – technical, graphical, mathematical, fundamental, and candlestick analysis. Moreover, he forecasts the market movements using his own methods based on the chaos theory. Vladimir took part in development of trading systems devoted to fractal analysis. In his free time, Vladimir blogs about exchange markets. Hobbies: active leisure, sporting shooting, cars, design, and marketing. "I do not dream only of becoming the best in my field. I also dream about those who I will take with me along the way up." Vladislav graduated from Moscow State University of Technologiy and Management. He entered the forex market in early 2008. Vladislav is a professional trader, analyst, and manager. He applies a whole gamut of analysis – technical, graphical, mathematical, fundamental, and candlestick analysis. Moreover, he forecasts the market movements using his own methods based on the chaos theory. Vladimir took part in development of trading systems devoted to fractal analysis. In his free time, Vladimir blogs about exchange markets. Hobbies: active leisure, sporting shooting, cars, design, and marketing. "I do not dream only of becoming the best in my field. I also dream about those who I will take with me along the way up." Alexander Dneprovskiy  Graduated from Kiev State University of Economics. On Forex market since 2007. Started his work at Forex as a trader. Since 2008 is working as a currency analyst. Graduated from Kiev State University of Economics. On Forex market since 2007. Started his work at Forex as a trader. Since 2008 is working as a currency analyst. Zhizhko Nadezhda  Graduated from Irkutsk State University. Having acquainted with Forex market in 2008, followed the courses in the International Academy of Stock Exchange Trading. The agenda was so exiting that she moved to St. Petersburg in order to get professional education. Obtained a diploma of the retraining course on the discipline Exchange market and stock market issues, defended the graduation paper with distinction on the subject "Modern technical indicators as the basis of the trading system". At the moment obtains a master degree in International Banking Institute on specialty Financial markets and investments. Apart from trading is occupied with development of trading systems and formalization of the working strategies using Ichimoku indicator. At the moment is working on the book dedicated to the peculiarities of Ichimoku indicator and its operating methods. Interests: yoga, literature, travelling and photograph. "You can only get smarter by playing a smarter opponent" Basics of Chess play, 1883 "Successful people change by themselves, the others are changed by life" Jim Rohn Graduated from Irkutsk State University. Having acquainted with Forex market in 2008, followed the courses in the International Academy of Stock Exchange Trading. The agenda was so exiting that she moved to St. Petersburg in order to get professional education. Obtained a diploma of the retraining course on the discipline Exchange market and stock market issues, defended the graduation paper with distinction on the subject "Modern technical indicators as the basis of the trading system". At the moment obtains a master degree in International Banking Institute on specialty Financial markets and investments. Apart from trading is occupied with development of trading systems and formalization of the working strategies using Ichimoku indicator. At the moment is working on the book dedicated to the peculiarities of Ichimoku indicator and its operating methods. Interests: yoga, literature, travelling and photograph. "You can only get smarter by playing a smarter opponent" Basics of Chess play, 1883 "Successful people change by themselves, the others are changed by life" Jim Rohn Andrey Shevchenko  Andrey Shevchenko Andrey Shevchenko Maxim Magdalinin  In 2005 graduated from the Academy of the Ministry of Internal Affairs of the Republic of Belarus, law faculty. Worked as a lawyer for three years in one of the biggest country's company. Besides the trading, he develops trading systems, writes articles and analytical reviews. Works at stock and commodity markets explorations. On Forex since 2006. In 2005 graduated from the Academy of the Ministry of Internal Affairs of the Republic of Belarus, law faculty. Worked as a lawyer for three years in one of the biggest country's company. Besides the trading, he develops trading systems, writes articles and analytical reviews. Works at stock and commodity markets explorations. On Forex since 2006. Mourad El Keddani  Was born in Oujda, Morocco. Currently lives in Belgium. In 2003 obtained B.S. in Experimental Sciences. In 2007 obtained a graduate diploma at Institut Marocain Specialise en Informatique Applique (IMSIA), specialty – Software Engineering Analyst. In 2007–2009 worked as teacher of computer services and trainer in a professional school specializing in computer technologies and accounting. In 2005 started Forex trading. Authored articles and analytical reviews on Forex market on Forex websites and forums. Since 2008 performs Forex market research, and develops and implements his own trading strategies of Forex analysis (especially in Forex Research & Analysis, Currency Forecast, and Recommendations and Analysis) that lies in: Numerical analysis: Probabilities, equations and techniques of applying Fibonacci levels. Classical analysis: Breakout strategy and trend indicators. Uses obtained skills to manage traders' accounts since 2009. In April 2009 was certified Financial Technician by the International Federation of Technical Analysts. Winner of several social work awards: Education Literacy and Non-Formal Education (in Literacy and Adult Education in The National Initiative for Human Development). Was born in Oujda, Morocco. Currently lives in Belgium. In 2003 obtained B.S. in Experimental Sciences. In 2007 obtained a graduate diploma at Institut Marocain Specialise en Informatique Applique (IMSIA), specialty – Software Engineering Analyst. In 2007–2009 worked as teacher of computer services and trainer in a professional school specializing in computer technologies and accounting. In 2005 started Forex trading. Authored articles and analytical reviews on Forex market on Forex websites and forums. Since 2008 performs Forex market research, and develops and implements his own trading strategies of Forex analysis (especially in Forex Research & Analysis, Currency Forecast, and Recommendations and Analysis) that lies in: Numerical analysis: Probabilities, equations and techniques of applying Fibonacci levels. Classical analysis: Breakout strategy and trend indicators. Uses obtained skills to manage traders' accounts since 2009. In April 2009 was certified Financial Technician by the International Federation of Technical Analysts. Winner of several social work awards: Education Literacy and Non-Formal Education (in Literacy and Adult Education in The National Initiative for Human Development).
Languages: Arabic, English, French and Dutch.
Interests: Algorithm, Graphics, Social work, Psychology and Philosophy. Petar Jacimovic  Petar was born on July 08, 1989 in Serbia. Graduated from Economy University and after has worked as a currency analyst for large private investors. Petar has been involved in the world of finance since 2007. In this trading he specializes in Volume Price Action (volume background, multi Fibonacci zones, trend channels, supply and demand). He also writes the market analytical reviews for Forex forums and websites. Moreover Petar is forex teacher and has wide experience in tutoring and conducting webinars. Interests : finance, travelling, sports, music "The key to success is hard work" Petar was born on July 08, 1989 in Serbia. Graduated from Economy University and after has worked as a currency analyst for large private investors. Petar has been involved in the world of finance since 2007. In this trading he specializes in Volume Price Action (volume background, multi Fibonacci zones, trend channels, supply and demand). He also writes the market analytical reviews for Forex forums and websites. Moreover Petar is forex teacher and has wide experience in tutoring and conducting webinars. Interests : finance, travelling, sports, music "The key to success is hard work"
Subscription's options management Theme's:
Fundamental analysis, Fractal analysis, Wave analysis, Technical analysis, Stock Markets
Author's :
A Zotova, Aleksey Almazov, Alexander Dneprovskiy, Alexandr Davidov, Alexandros Yfantis, Andrey Shevchenko, Arief Makmur, Dean Leo, Evgeny Klimov, Fedor Pavlov, Grigory Sokolov, I Belozerov, Igor Kovalyov, Irina Manzenko, Ivan Aleksandrov, l Kolesnikova, Maxim Magdalinin, Mihail Makarov, Mohamed Samy, Mourad El Keddani, Oleg Khmelevskiy, Oscar Ton, Pavel Vlasov, Petar Jacimovic, R Agafonov, S Doronina, Sebastian Seliga, Sergey Belyaev, Sergey Mityukov, Stanislav Polyanskiy, T Strelkova, Torben Melsted, V Isakov, Viktor Vasilevsky, Vladislav Tukhmenev, Vyacheslav Ognev, Yuriy Zaycev, Zhizhko Nadezhda
Edit data of subscription settings
Unsubscribe from the mailing list Sincerely,
Analysts Service | If you have any questions, you can make a phone call using one of the
InstaForex Toll free numbers right now:
|  | InstaForex Group is an international brand providing online trading services to the clients all over the world. InstaForex Group members include regulated companies in Europe, Russia and British Virgin Islands. This letter may contain personal information for access to your InstaForex trading account, so for the purpose of safety it is recommended to delete this data from the history. If you have received this letter by mistake, please contact InstaForex Customer Relations Department. |


No comments:
Post a Comment