| Analysis of the EUR/USD for December 15, 2020. Fed's meeting considered key event for USD this week 2020-12-15 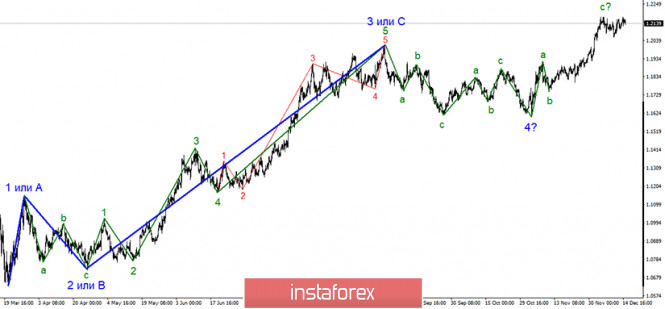 Wave marking of the euro/dollar pair is still pointing to the formation of an uptrend. The rising wave, which now is determined as c, is still under formation. It made an attempt to break the highest level of waves 3 and C. The current uptrend section may change into a five-wave structure. The fact is that three waves have been already formed. In this case, the wave marking could become a bit more complicated. However, it will still point to the upcoming reverse. 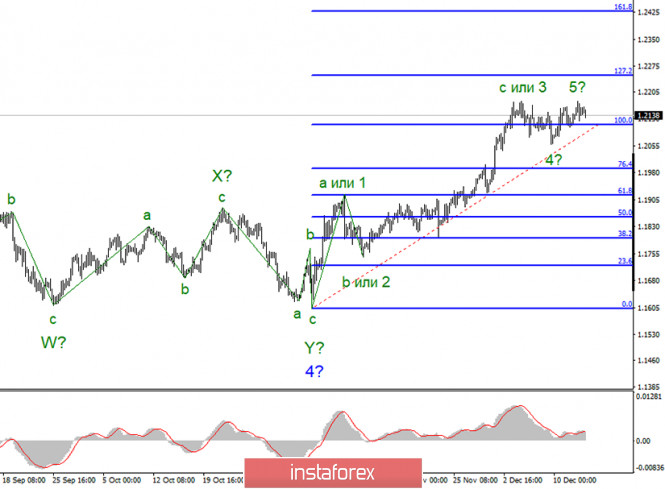 A smaller wave marking also points to the formation of the uptrend section. It is also possible that the wave marking of the trend section, which began on November 4, will turn into a five-wave structure. At the moment, a slight drop from the early highs and a further rise proves the readiness of market participants to continue buying the euro. Thus, I added waves 4 and 5. In recent weeks, the wave pattern has been quite clear. At the same time, the recent news has caused a lot of questions. Demand for the euro is very high. The currency is still trading near its 2.5-year highs. Consequently, in the eurozone, the overall situation is quite favorable whereas in the US, it is not that good. However, in fact, the eurozone and the US have almost the same problems. Economic reports do not reflect that European economy is recovering much faster than the US one. However, lockdowns in some European countries will have a negative effect on the eurozone's GDP in the fourth quarter. However, markets are ignoring these facts. It seems that market participants do not pay attention even to the most important events. This week, the US Fed's meeting will take place. It is a really significant event. Most analysts suppose that the regulator will hardly make any fateful decision. The key rates are already at the zero levels. The QE program has been largely extended. Thus, traders are likely to focus on the FOMC statement, as it will contain forecasts of GDP, inflation, and unemployment rate for the next few years. At the same time, Jerome Powell will provide speech. In recent months, his rhetoric has been dovish. The Fed's Chairman goes on insisting on additional stimulus measures and calling on the US Congress to agree on the aid package. He also emphasizes a possibility of a slower recovery in the fourth quarter. That is why he will hardly change his stance at the last meeting of the year. Conclusion and recommendations The euro/dollar pair continues forming its uptrend. This could be proved by a slight drop from the early highs. Thus, I recommend traders remain cautious buying this trading instrument. At the moment, there are no signals that the upward waves formation is complete. If the wave 5 is under formation, it will take little time to complete it. Nevertheless, it is still possible to buy the trading instrument for each new upward MACD signal with targets located near the level of 1.2250, which is equal to 127.2% of Fibonacci. Technical analysis of AUD/USD for December 15, 2020 2020-12-15 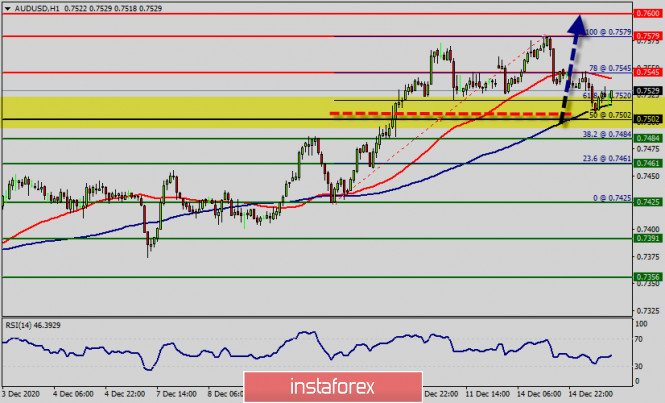 Overview : The dollar has been in retreat mode against many of the major currencies, but hasn't lost much against the AUD, as investor appetite for risk has been strong, at the expenditure of the safe-haven dollar and AUD. The USD/AUD pair touched the upwards range's support line at 0.7502 and bounced upwards clearly from there, to head towards potential test to this range's resistance at 0.7545 in the upcoming sessions, to keep the upwards range dominant on the intraday trades until the price manages to surpass one of the mentioned levels. Price is seeing strong support above 0.7502 (50% of Fibonacci retracement, horizontal overlap support) and we expect to see a strong bounce above this level to push price up to at least 0.7545, then 0.7579 resistance (top point, horizontal swing high resistance). We have to watch out for the descending line which would pose as intermediate resistance to this move. The US dollar has rallied a bit during the week to reach towards the 1.7525 level. Moreover, the market has went forward significantly from there, which makes quite a bit of sense considering that we have been in a strong uptrend. The USD/AUD pair broke resistance which turned to strong support at the level of 0.7502 this week. The level of 0.7502 coincides with 50% of Fibonacci, which is expected to act as major support today. Also, it should be noticed that, the level of 0.7502 represents the daily pivot point. Since the trend is above the 50% Fibonacci level, the market is still in an uptrend. From this point, the USD/AUD pair is continuing in a bullish trend from the new support of 0.7502. Currently, the price is in a bullish channel. According to the previous events, we expect the 0.7502 pair to move between 0.7502 and 0.7579. On the H1 chart, resistance is seen at the levels of 0.7545, 0.7579 and 0.7600. Therefore, strong support will be formed at the level of 0.7502 providing a clear signal to buy with the targets seen at 0.7545. If the trend breaks the reisstance at 0.7545 (first resistance) the pair will move upwards continuing the development of the bullish trend to the level 0.7579 in order to test the daily resistance 2. then the trend will continue towards the third resistance of 0.7600. However, the stop loss should always be taken into account, for that it will be reasonable to set your stop loss at the level of 0.7461. Conclusion: It should be noted that the support is established at the level of 0.7502. The price is likely to form a double bottom in the same time frame. Accordingly, the USD/AUD pair is showing signs of strength following a breakout of the highest level of 0.7502. So, buy above the level of 0.7502 with the first target at 0.7545 in order to test the daily resistance 1 and further to 0.7579. Also, it might be noted that the level of 0.7579 is a good place to take profit because it will form a double top. If the pair succeeds to pass through the level of 0.7579, the market will indicate a bullish opportunity above the level of 0.7579 - next target 0.7600. Trading plan for the EUR/USD pair on December 15. COVID-19 retreated a bit. Vaccination has begun in the US. 2020-12-15 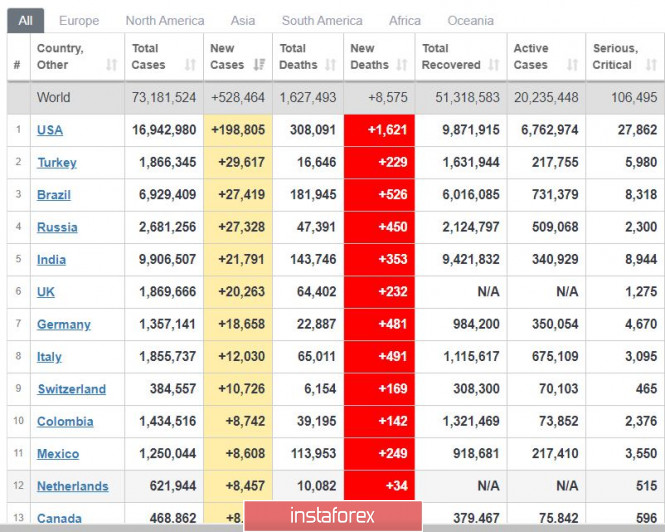
The latest data suggests that COVID-19 has retreated a bit. Yesterday, global incidence dropped below 550,000, with the United States only recording less than 200,000 new cases. Deaths have also decreased to 8.6 thousand. Another good news is that vaccination has already begun both in the UK and the US. Europe, meanwhile, is soon to follow. In the US, the electoral college has also officially elected Joe Biden as the President of the United States. In turn, Biden called for reconciliation between his supporters and those of Donald Trump's. 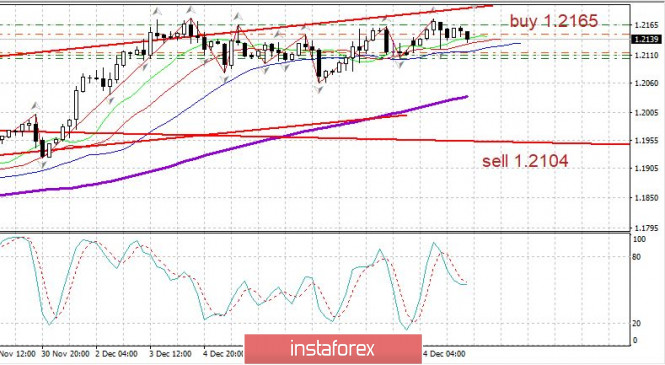
EUR / USD- euro rally halted in anticipation of Fed decisions on Wednesday. The document of the Fed's meeting, as well as the central bank's economic forecasts are very important. Open long positions from 1.2175. Open short positions from 1.2104. Technical recommendations for EUR/USD and GBP/USD on 12/15/20 2020-12-15 EUR/USD 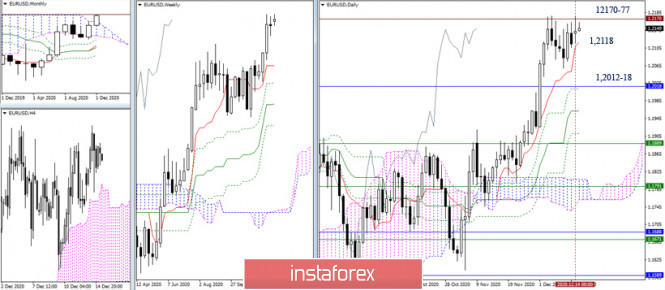 The pair tested the previous high (1.2177) at the beginning of a new trading week, however, even a good upward gap at the opening did not help to reach a successful result. Now, the upward trend can continue if the high will be updated and there will be a reliable consolidation above. On the other hand, a downward correction will develop in case of failure, loss of the daily short-term trend (1.2118) and a decline below last week's low (1.2059). The next support for strengthening the bearish mood is now located at 1.2012-18 (daily Fibo Kijun + monthly Senkou Span B). 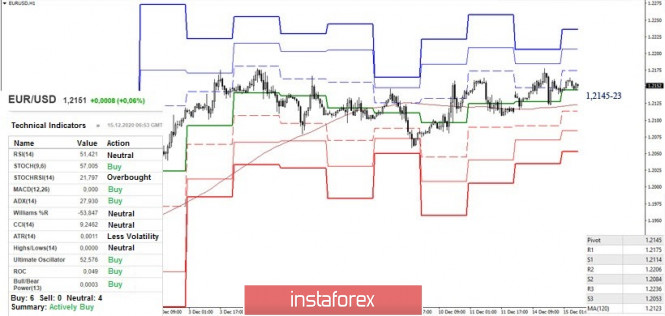 In turn, the bulls retain the key levels in the smaller time frames, which are currently located at 1.2145 (central pivot level) and 1.2123 (weekly long-term trend). At the same time, the support of the analyzed technical indicators also belongs to bullish players at this stage. Their main task is to update the high (1.2177) then R2 (1.2206) and R3 (1.2236) will act as targets within the day. However, losing the key levels (1.2145-23) and consolidating below will switch the favor towards the bears' side. It will be important for them to leave the previous daily consolidation and correction (low 1.2059) zone. GBP/USD 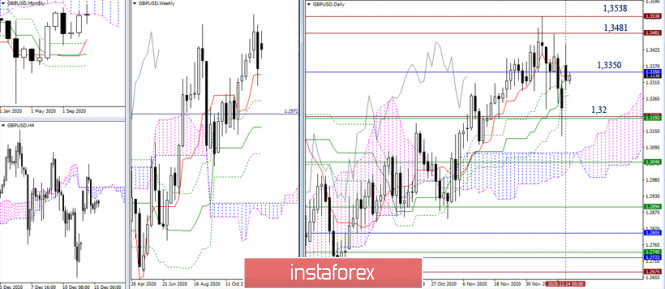 The previously indicated time frames still determine the pair's movement. Rivals are alternately testing the resistance levels (1.3481 - 1.3538) and support (1.32), returning to the middle ground – 1.3350 (lower limit of the monthly cloud). In case of new scenarios and prospects, the pound must leave the existing borders, move beyond them and securely consolidate. 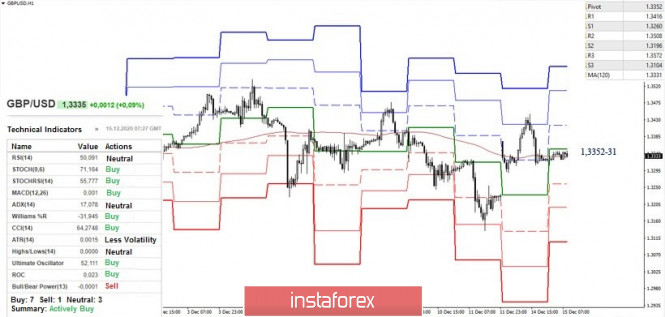 The pair is currently in the attraction zone for the key levels 1.3352-31 (central pivot level + weekly long-term trend) in the smaller time frames. An important level (1.3350) in the higher time frame strengthened this zone, so it is difficult to talk about long-term benefits. Currently, uncertainty dominates. Nevertheless, the pair's movement below the levels (1.3351-31) on one-hour chart gives bears an advantage. They will be guided by the support of classic pivot levels (1.3260 - 1.3196 - 1.3104) for the intraday. Bullish traders, in turn, will be strengthened by the location and pair's movement above the key levels (1.3351-31). The pivot points for this growth are located today at 1.3416 (S1) - 1.3508 (S2) - 1.3572 (S3). Ichimoku Kinko Hyo (9.26.52), Pivot Points (classical), Moving Average (120) Trading idea for the GBP/USD pair 2020-12-15  The lack of progress in the Brexit negotiations are starting to worry pound bulls. In fact, many are already expecting that in 2021, the UK will leave the EU without a trade deal. The media is also already spreading panic, as a result, people are now buying goods, expecting a shortage. In terms of the GBP / USD pair, the recent news have resulted in a gap, which is a sharp break in price with no trading occurring in between. Usually, this only happens during the weekend, as it is the only time the market closes. But this gap in GBP / USD appeared on Monday, during the opening of the market. 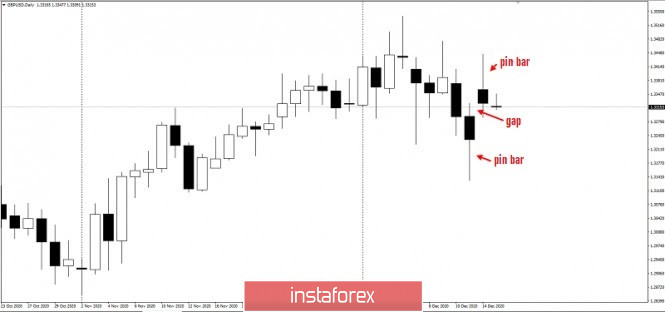 Although this usually means that trades should be canceled to avoid losing profit, there are cases that gaps could result in corrections. In other words, after a gap occurs, price could reverse to "cover" or "fill" the gap. And since a pin bar has formed in the pair yesterday, this scenario is especially relevant. Thus, we could trade short positions in the GBP / USD pair and gain profit from it. 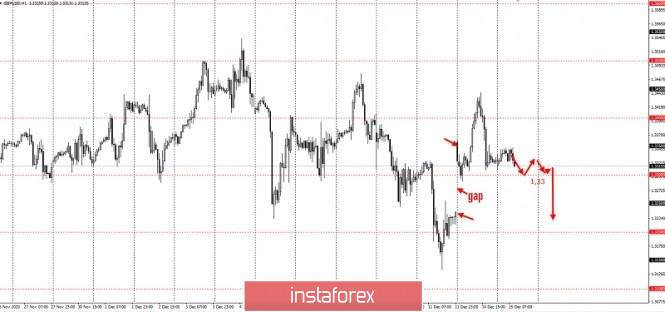 But the catch is that the positions should be closed once the quote reaches 1.32. This tactic is an example of Price Action and Stop Hunting strategies. Of course, traders still need to be careful since this financial market is very precarious. But, as mentioned before, it will give plenty of profit as long as you use the right approach. Good luck! Trading idea for gold 2020-12-15  Congratulations to those who followed our earlier trading recommendation , which was to sell gold. Today, the situation is absolutely the same, especially since there is another trap for gold, but this time it's at the level of 1850. 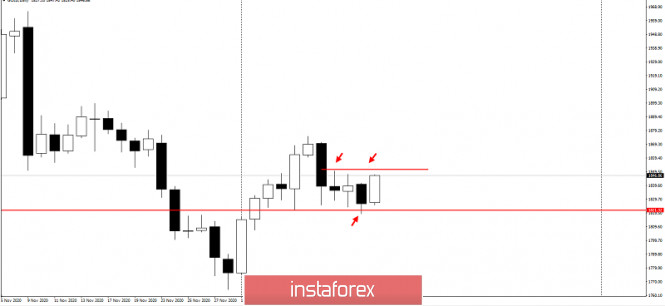 The situation looks like this: H1 chart 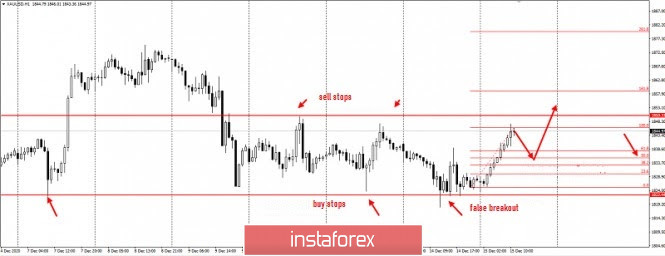 The best tactic is to work for a 50% retracement, from the current price to 1850. Such a transaction has a 1: 1 risk / profit ratio, and will be relevant until the quote breaks out of 1850. But if the target level breaks down before the pullback, cancel the transaction. Remember, we have to be careful when trading because the market is very precarious. But, it will give plenty of profit provided that you use the right approach. Good luck! EUR/USD: trading plan for North American session on December 15, 2020 (analysis of morning deals) 2020-12-15 In order to open long positions on EUR/USD, you should: Nothing important happened in the first half of the day. A similar situation was observed yesterday. According to the M5 chart, bulls managed to return the price to the area of the resistance level of 1.2164. The lack of important fundamental statistics at the beginning of this trading week is affecting market volatility. 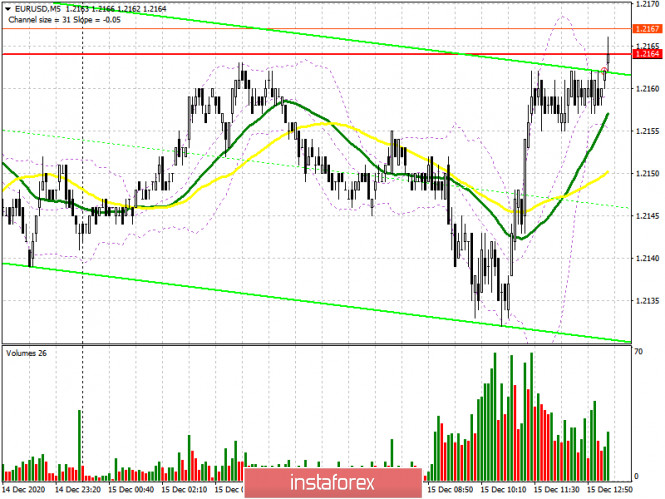
In the second half of the day, bulls' task is to break through the level of 1.2164 and consolidate above it. So far, their attempts to do so have failed. Only a test of this area from above can give a buy signal. In this case, the target is seen in the region of the high of 1.2211. This is the level where traders should take profit. Other targets are seen at 1.2255 and 1.2339. If the pair manages to reach 1.2339, the bullish trend will continue. Otherwise, if bulls fail to complete the task for the second half of the day and the US industrial production report turns out to be positive, exerting pressure on the currency pair, one should refrain from entering long. The best thing to do is to wait for the price to fall to the morning support of 1.2110. A false breakout at this level may give a buy signal. I recommend that you buy the euro immediately on a rebound from the low of 1.2060 given that an upward correction of 15-20 pips can occur within the day. In order to open short positions on EUR/USD you should: Currently, bulls are trying to protect the level of 1.2164. Trading is likely to take place below this range at the moment,. The pressure on the euro could return any time soon. A false breakout near 1.2164 may give an additional sell signal. In such a case, the nearest target is seen at the morning support of 1.2110, where it is best to take profit. A breakout at this point is likely to only increase pressure on EUR/USD. Consequently, the pair may reach the weekly lows of 1.2060 and 1.1986. As a result, the hopes of bears for the continuation of the upward trend may be destroyed. Thus, if EUR/USD is above the resistance of 1.2164 in the second half of the day and bulls are inactive, one should refrain from selling the instrument. In this case, one should enter short only from 1.2211 or sell EUR/USD already from the new high in the area of 1.2255 given that a downward correction of 15-20 pips can occur within the day. 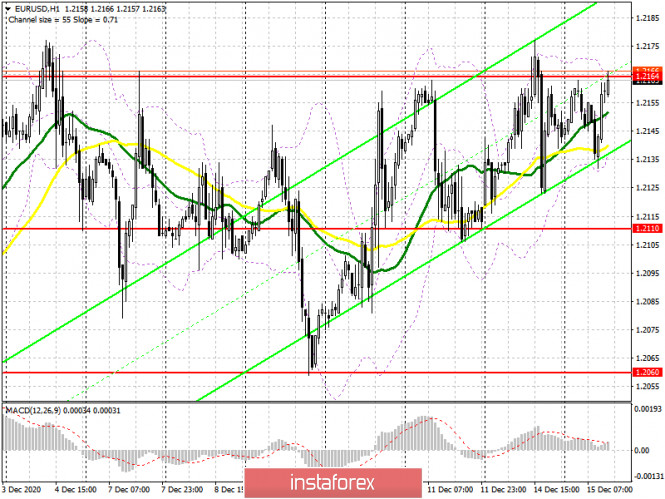
As for the Commitment of Traders (COT) report presented on December 8, the number of long positions increased, while the number of short positions decreased. The buyers of risky assets believe in the continuation of the bullish trend and further growth in the price of the euro. Thus, the number of long non-commercial positions advanced to 222,521 from 207,302, while the number of short non-commercial net positions jumped to 156,429 from 139,894 recorded last week. Notably, delta has been rising for the third week in a row, which completely cancels the bearish trend observed at the beginning of autumn. A more significant recovery will be possible only if European leaders reach a new trade agreement with the United Kingdom. 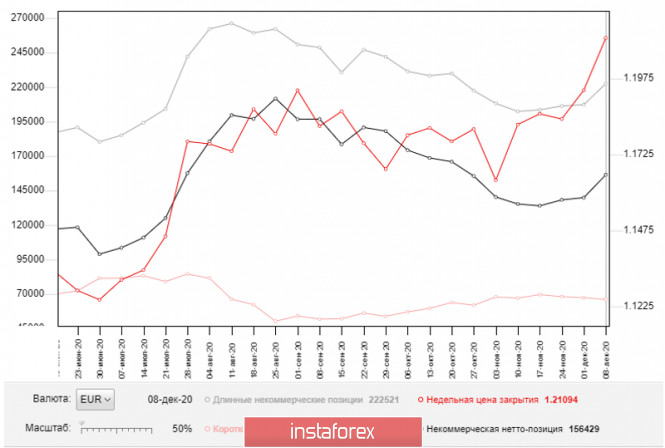
Indicator signals: Moving averages Trading takes place slightly above the 30 and 50 day moving averages, indicating a sideways trend. Note: The period and prices of moving averages are considered by the author of the article on the hourly chart and differ from the general definition of the classic daily moving averages on the daily chart. Bollinger Bands The volatility is on a very low level, which does not give signals to enter the market. Description of indicators • Moving average (determines the current trend by smoothing volatility and noise). Period 50. Marked in yellow on the chart. • Moving average (determines the current trend by smoothing volatility and noise). Period 30. Marked in green on the chart. • MACD indicator (Moving Average Convergence/Divergence) Fast EMA period 12. Slow EMA period 26. SMA period 9 • Bollinger Bands. Period 20 • Nonprofit traders are speculators such as individual traders, hedge funds, and large institutions that use the futures market for speculative purposes and meet certain requirements. • Long non-commercial positions represent the total long open position of non-commercial traders. • Non-commercial short positions represent the total short open position of non-commercial traders. • The total non-commercial net position is the difference between short and long positions of non-commercial traders. EUR/USD: trading plan for North American session on December 15, 2020 (analysis of morning deals) 2020-12-15 In order to open long positions on EUR/USD, you should: Nothing important happened in the first half of the day. A similar situation was observed yesterday. According to the M5 chart, bulls managed to return the price to the area of the resistance level of 1.2164. The lack of important fundamental statistics at the beginning of this trading week is affecting market volatility.
In the second half of the day, bulls' task is to break through the level of 1.2164 and consolidate above it. So far, their attempts to do so have failed. Only a test of this area from above can give a buy signal. In this case, the target is seen in the region of the high of 1.2211. This is the level where traders should take profit. Other targets are seen at 1.2255 and 1.2339. If the pair manages to reach 1.2339, the bullish trend will continue. Otherwise, if bulls fail to complete the task for the second half of the day and the US industrial production report turns out to be positive, exerting pressure on the currency pair, one should refrain from entering long. The best thing to do is to wait for the price to fall to the morning support of 1.2110. A false breakout at this level may give a buy signal. I recommend that you buy the euro immediately on a rebound from the low of 1.2060 given that an upward correction of 15-20 pips can occur within the day. In order to open short positions on EUR/USD you should: Currently, bulls are trying to protect the level of 1.2164. Trading is likely to take place below this range at the moment,. The pressure on the euro could return any time soon. A false breakout near 1.2164 may give an additional sell signal. In such a case, the nearest target is seen at the morning support of 1.2110, where it is best to take profit. A breakout at this point is likely to only increase pressure on EUR/USD. Consequently, the pair may reach the weekly lows of 1.2060 and 1.1986. As a result, the hopes of bears for the continuation of the upward trend may be destroyed. Thus, if EUR/USD is above the resistance of 1.2164 in the second half of the day and bulls are inactive, one should refrain from selling the instrument. In this case, one should enter short only from 1.2211 or sell EUR/USD already from the new high in the area of 1.2255 given that a downward correction of 15-20 pips can occur within the day.
As for the Commitment of Traders (COT) report presented on December 8, the number of long positions increased, while the number of short positions decreased. The buyers of risky assets believe in the continuation of the bullish trend and further growth in the price of the euro. Thus, the number of long non-commercial positions advanced to 222,521 from 207,302, while the number of short non-commercial net positions jumped to 156,429 from 139,894 recorded last week. Notably, delta has been rising for the third week in a row, which completely cancels the bearish trend observed at the beginning of autumn. A more significant recovery will be possible only if European leaders reach a new trade agreement with the United Kingdom.
Indicator signals: Moving averages Trading takes place slightly above the 30 and 50 day moving averages, indicating a sideways trend. Note: The period and prices of moving averages are considered by the author of the article on the hourly chart and differ from the general definition of the classic daily moving averages on the daily chart. Bollinger Bands The volatility is on a very low level, which does not give signals to enter the market. Description of indicators • Moving average (determines the current trend by smoothing volatility and noise). Period 50. Marked in yellow on the chart. • Moving average (determines the current trend by smoothing volatility and noise). Period 30. Marked in green on the chart. • MACD indicator (Moving Average Convergence/Divergence) Fast EMA period 12. Slow EMA period 26. SMA period 9 • Bollinger Bands. Period 20 • Nonprofit traders are speculators such as individual traders, hedge funds, and large institutions that use the futures market for speculative purposes and meet certain requirements. • Long non-commercial positions represent the total long open position of non-commercial traders. • Non-commercial short positions represent the total short open position of non-commercial traders. • The total non-commercial net position is the difference between short and long positions of non-commercial traders. EUR/USD analysis for December 15 2020 - First target reached at 1.2170 and potential for bigger rise towards 1.2400 2020-12-15 French November EU normal CPI +0.2m/m vs +0.2% m/m expected prior +0.2% - y/y +0.2% vs 0.2% expected
- y/y prior +0.2%
French inflation remains flat. Deflationary pressure continue to dog the eurozone and this is a concern noted by the ECB. For now there is nothing to warrant any moves in the markets as focus is elsewhere - vaccine news, lockdowns, and Brexit. Further Development 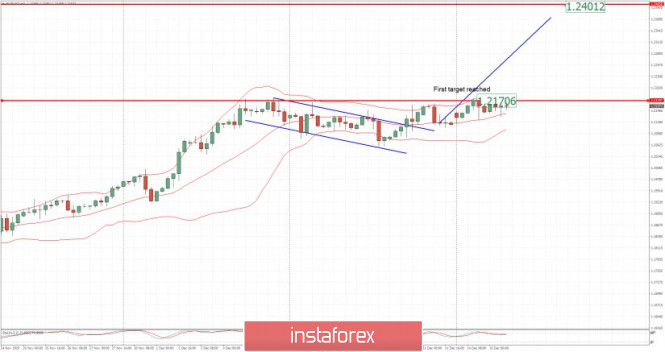
Analyzing the current trading chart of EUR/USD, I found that EUR/USD tested my first upside target at the price of 1,2170 and that is heading for the bigger upside breakout. 1-Day relative strength performance Finviz 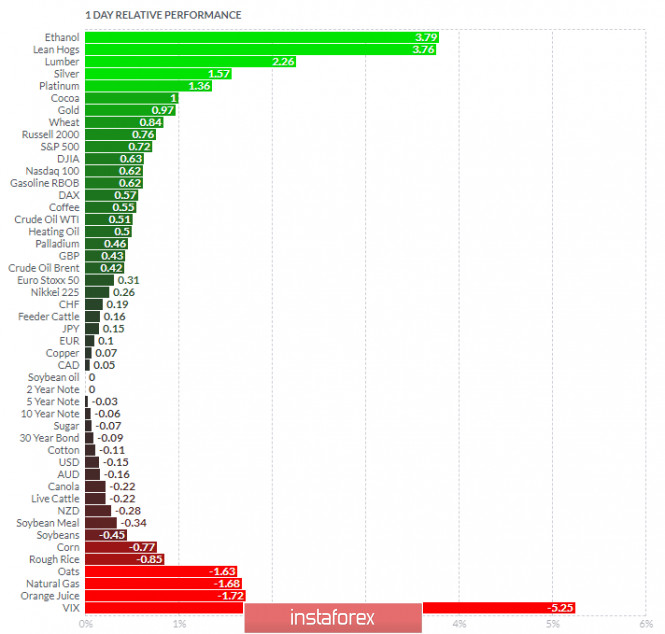
Based on the graph above I found that on the top of the list we got Ethanol and Lean Hogs today and on the bottom VIX and Orange Juice. Key Levels: Resistance: 1,2170 and 1,2400 Support levels: 1,2125 Analysis of Gold for December 15,.2020 - First target at the price of $1.846 has been reached. Next upside target set at $1.864 2020-12-15 In the latest Bank of Canada statement they kept interest rates unchanged at 0.25% and their QE program unaltered too at $4 billion per week. The Bank of Canada recognised that the recovery was well underway and will adjust its QE purchases as required to help bring inflation back on target. Future projections In terms of future projections the Bank of Canada is following the Federal Reserve and the Reserve Bank of Australia with no interest rates hikes seen until 2023. The Bank of Canada recognized that economic momentum heading into the fourth quarter appears to be stronger than was expected in October but, in recent weeks, record high cases of COVID-19 in many parts of Canada are forcing re-impositions of restrictions. The Bank of Canada is expecting that to drag growth lower for the first quarter of 2021. The Bank of Canada is expecting a delay in the recovery as the vaccine takes time to roll out. All in all it was a holding statement and there was nothing obviously actionable from it. 
Further Development 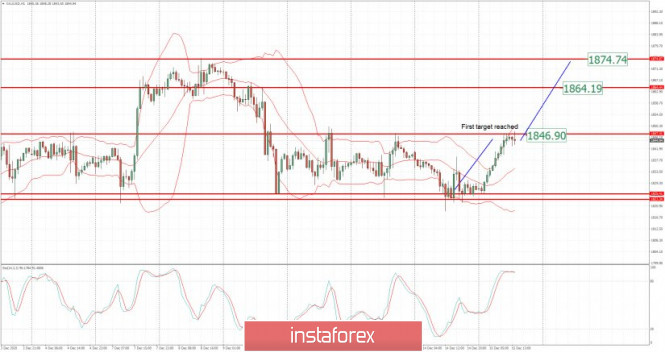
Analyzing the current trading chart of Goild, I found that Gold tested my first upside target at the price of $1846 and that is heading for the bigger upside breakout towards $1,864 and $1,875. My advice is to watch for potential buying opportunities due to strong ups cycle on the Gold. Next upward target is set at the price of $1,864. 1-Day relative strength performance Finviz 
Based on the graph above I found that on the top of the list we got Ethanol and Lean Hogs today and on the bottom VIX and Orange Juice. Key Levels: Resistance: $1,846, $1,864 and $1,875 Support level: $1,837
Author's today's articles: Alexander Dneprovskiy  Graduated from Kiev State University of Economics. On Forex market since 2007. Started his work at Forex as a trader. Since 2008 is working as a currency analyst. Graduated from Kiev State University of Economics. On Forex market since 2007. Started his work at Forex as a trader. Since 2008 is working as a currency analyst. Mourad El Keddani  Was born in Oujda, Morocco. Currently lives in Belgium. In 2003 obtained B.S. in Experimental Sciences. In 2007 obtained a graduate diploma at Institut Marocain Specialise en Informatique Applique (IMSIA), specialty – Software Engineering Analyst. In 2007–2009 worked as teacher of computer services and trainer in a professional school specializing in computer technologies and accounting. In 2005 started Forex trading. Authored articles and analytical reviews on Forex market on Forex websites and forums. Since 2008 performs Forex market research, and develops and implements his own trading strategies of Forex analysis (especially in Forex Research & Analysis, Currency Forecast, and Recommendations and Analysis) that lies in: Numerical analysis: Probabilities, equations and techniques of applying Fibonacci levels. Classical analysis: Breakout strategy and trend indicators. Uses obtained skills to manage traders' accounts since 2009. In April 2009 was certified Financial Technician by the International Federation of Technical Analysts. Winner of several social work awards: Education Literacy and Non-Formal Education (in Literacy and Adult Education in The National Initiative for Human Development). Was born in Oujda, Morocco. Currently lives in Belgium. In 2003 obtained B.S. in Experimental Sciences. In 2007 obtained a graduate diploma at Institut Marocain Specialise en Informatique Applique (IMSIA), specialty – Software Engineering Analyst. In 2007–2009 worked as teacher of computer services and trainer in a professional school specializing in computer technologies and accounting. In 2005 started Forex trading. Authored articles and analytical reviews on Forex market on Forex websites and forums. Since 2008 performs Forex market research, and develops and implements his own trading strategies of Forex analysis (especially in Forex Research & Analysis, Currency Forecast, and Recommendations and Analysis) that lies in: Numerical analysis: Probabilities, equations and techniques of applying Fibonacci levels. Classical analysis: Breakout strategy and trend indicators. Uses obtained skills to manage traders' accounts since 2009. In April 2009 was certified Financial Technician by the International Federation of Technical Analysts. Winner of several social work awards: Education Literacy and Non-Formal Education (in Literacy and Adult Education in The National Initiative for Human Development).
Languages: Arabic, English, French and Dutch.
Interests: Algorithm, Graphics, Social work, Psychology and Philosophy. Mihail Makarov  - - Zhizhko Nadezhda  Graduated from Irkutsk State University. Having acquainted with Forex market in 2008, followed the courses in the International Academy of Stock Exchange Trading. The agenda was so exiting that she moved to St. Petersburg in order to get professional education. Obtained a diploma of the retraining course on the discipline Exchange market and stock market issues, defended the graduation paper with distinction on the subject "Modern technical indicators as the basis of the trading system". At the moment obtains a master degree in International Banking Institute on specialty Financial markets and investments. Apart from trading is occupied with development of trading systems and formalization of the working strategies using Ichimoku indicator. At the moment is working on the book dedicated to the peculiarities of Ichimoku indicator and its operating methods. Interests: yoga, literature, travelling and photograph. "You can only get smarter by playing a smarter opponent" Basics of Chess play, 1883 "Successful people change by themselves, the others are changed by life" Jim Rohn Graduated from Irkutsk State University. Having acquainted with Forex market in 2008, followed the courses in the International Academy of Stock Exchange Trading. The agenda was so exiting that she moved to St. Petersburg in order to get professional education. Obtained a diploma of the retraining course on the discipline Exchange market and stock market issues, defended the graduation paper with distinction on the subject "Modern technical indicators as the basis of the trading system". At the moment obtains a master degree in International Banking Institute on specialty Financial markets and investments. Apart from trading is occupied with development of trading systems and formalization of the working strategies using Ichimoku indicator. At the moment is working on the book dedicated to the peculiarities of Ichimoku indicator and its operating methods. Interests: yoga, literature, travelling and photograph. "You can only get smarter by playing a smarter opponent" Basics of Chess play, 1883 "Successful people change by themselves, the others are changed by life" Jim Rohn Andrey Shevchenko  Andrey Shevchenko Andrey Shevchenko Maxim Magdalinin  In 2005 graduated from the Academy of the Ministry of Internal Affairs of the Republic of Belarus, law faculty. Worked as a lawyer for three years in one of the biggest country's company. Besides the trading, he develops trading systems, writes articles and analytical reviews. Works at stock and commodity markets explorations. On Forex since 2006. In 2005 graduated from the Academy of the Ministry of Internal Affairs of the Republic of Belarus, law faculty. Worked as a lawyer for three years in one of the biggest country's company. Besides the trading, he develops trading systems, writes articles and analytical reviews. Works at stock and commodity markets explorations. On Forex since 2006. Petar Jacimovic  Petar was born on July 08, 1989 in Serbia. Graduated from Economy University and after has worked as a currency analyst for large private investors. Petar has been involved in the world of finance since 2007. In this trading he specializes in Volume Price Action (volume background, multi Fibonacci zones, trend channels, supply and demand). He also writes the market analytical reviews for Forex forums and websites. Moreover Petar is forex teacher and has wide experience in tutoring and conducting webinars. Interests : finance, travelling, sports, music "The key to success is hard work" Petar was born on July 08, 1989 in Serbia. Graduated from Economy University and after has worked as a currency analyst for large private investors. Petar has been involved in the world of finance since 2007. In this trading he specializes in Volume Price Action (volume background, multi Fibonacci zones, trend channels, supply and demand). He also writes the market analytical reviews for Forex forums and websites. Moreover Petar is forex teacher and has wide experience in tutoring and conducting webinars. Interests : finance, travelling, sports, music "The key to success is hard work"
Subscription's options management Theme's:
Fundamental analysis, Fractal analysis, Wave analysis, Technical analysis, Stock Markets
Author's :
A Zotova, Aleksey Almazov, Alexander Dneprovskiy, Alexandr Davidov, Alexandros Yfantis, Andrey Shevchenko, Arief Makmur, Dean Leo, Evgeny Klimov, Fedor Pavlov, Grigory Sokolov, I Belozerov, Igor Kovalyov, Irina Manzenko, Ivan Aleksandrov, l Kolesnikova, Maxim Magdalinin, Mihail Makarov, Mohamed Samy, Mourad El Keddani, Oleg Khmelevskiy, Oscar Ton, Pavel Vlasov, Petar Jacimovic, R Agafonov, S Doronina, Sebastian Seliga, Sergey Belyaev, Sergey Mityukov, Stanislav Polyanskiy, T Strelkova, Torben Melsted, V Isakov, Viktor Vasilevsky, Vladislav Tukhmenev, Vyacheslav Ognev, Yuriy Zaycev, Zhizhko Nadezhda
Edit data of subscription settings
Unsubscribe from the mailing list Sincerely,
Analysts Service | If you have any questions, you can make a phone call using one of the
InstaForex Toll free numbers right now:
|  | InstaForex Group is an international brand providing online trading services to the clients all over the world. InstaForex Group members include regulated companies in Europe, Russia and British Virgin Islands. This letter may contain personal information for access to your InstaForex trading account, so for the purpose of safety it is recommended to delete this data from the history. If you have received this letter by mistake, please contact InstaForex Customer Relations Department. |


No comments:
Post a Comment