| EUR/USD: plan for the European session on December 15. COT reports. Euro buyers failed to cope with 1.2164. Focus shifts to resistance 2020-12-15 To open long positions on EUR/USD, you need: In yesterday's afternoon forecast, I pointed to short deals from the 1.2164 level and paid attention to forming a signal to enter the market. Let's take a look at the 5-minute chart and talk about what happened. Buyers' failure to surpass resistance at 1.2164 led to forming a false breakout in this range, and a reverse test of this level from the bottom up in the afternoon confirmed the presence of sellers in the market, which caused EUR/USD to fall by more than 40 points. From a technical point of view, nothing has changed, since there wasn't any important fundamental data in the afternoon. 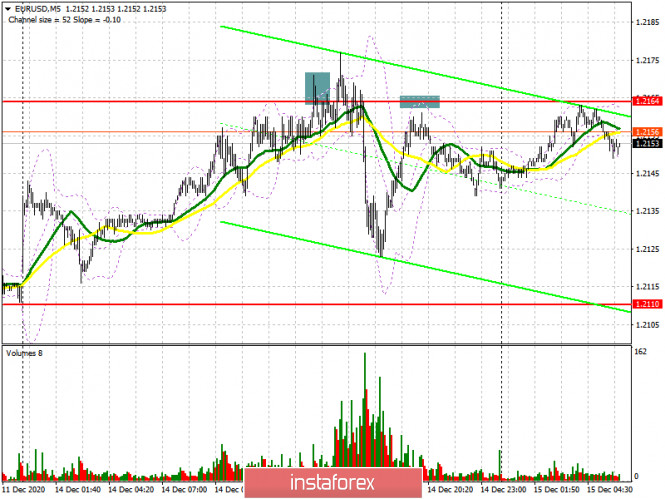
Buyers need to take control of resistance at 1.2164, as only this will lead to another upward wave and can sustain the bull market. A breakout and being able to settle above 1.2164 and testing it from top to bottom produces a good signal to buy EUR/USD in hopes of updating the next high at 1.2211, where I recommend taking profits. The next target will be the high of 1.2255, which buyers will be aiming for this week. Considering that important fundamental statistics on the eurozone economy will not be released today, it will hardly be possible to count on a breakout of 1.2255. However, if this happens, I recommend building up long positions to the highs of 1.2339 and 1.2417. In case the euro falls in the first half of the day and buyers are unable to go above 1.2164, it is best not to rush into long positions, but wait until a false breakout forms in the support area of 1.2110. I recommend buying EUR/USD immediately on a rebound from a low of 1.2060, counting on a correction by 20-25 points within the day. To open short positions on EUR/USD, you need: Sellers will actively defend resistance at 1.2164, just above which the annual highs pass. Forming a false breakout there ,similar to yesterday's deal, which I figured out a little higher, will lead to producing a new downward correction, which will be aimed at surpassing the 1.2110 low. Being able to settle below this range will open a direct road to the 1.2060 area, where I recommend taking profits. The next target will be the 1.1986 area, testing it will mean a reversal of the current upward trend. If the bulls find strength after receiving reports on inflation in Italy and France for November, and they also manage to surpass the resistance of 1.2164, I recommend not to rush to sell. The optimal scenario would be a test of the 1.2211 high, where a false breakout will be a signal to sell the euro. I recommend opening short positions immediately on a rebound from the 1.2255 level, counting on the pair's correction down by 15-20 points. 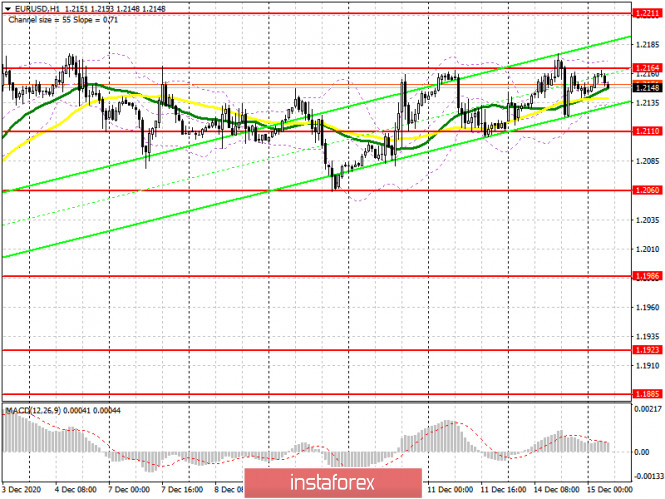
The Commitment of Traders (COT) report for December 8 recorded an increase in long positions and a reduction in short positions. Buyers of risky assets believe in sustaining the bull market and the euro's growth after surpassing the psychological mark in the area of the 20th figure. Thus, long non-commercial positions rose from 207,302 to 222,521, while short non-commercial positions fell from 67,407 to 66,092. The total non-commercial net position rose from 139,894 to 156,429 a week earlier. It is worth paying attention to the growth of the delta, observed for the third consecutive week, which completely negates the bearish trend observed at the beginning of this fall. We can only speak of a larger recovery after European leaders negotiate a new trade agreement with Britain. Indicator signals: Moving averages Trading is carried out in the area of 30 and 50 moving averages, which indicates the sideways nature of the market. Note: The period and prices of moving averages are considered by the author on the H1 hourly chart and differs from the general definition of the classic daily moving averages on the D1 daily chart. Bollinger Bands In case of a breakout of the upper border of the indicator in the 1.2168 area, we can expect an increase in demand for the euro. A breakout of the lower border of the indicator in the 1.2135 area will increase pressure on the euro. Description of indicators - Moving average (moving average, determines the current trend by smoothing out volatility and noise). Period 50. It is marked in yellow on the chart.
- Moving average (moving average, determines the current trend by smoothing out volatility and noise). Period 30. It is marked in green on the chart.
- MACD indicator (Moving Average Convergence/Divergence — convergence/divergence of moving averages) Quick EMA period 12. Slow EMA period to 26. SMA period 9
- Bollinger Bands (Bollinger Bands). Period 20
- Non-commercial speculative traders, such as individual traders, hedge funds, and large institutions that use the futures market for speculative purposes and meet certain requirements.
- Long non-commercial positions represent the total long open position of non-commercial traders.
- Short non-commercial positions represent the total short open position of non-commercial traders.
- Total non-commercial net position is the difference between short and long positions of non-commercial traders.
GBP/USD: plan for the European session on December 15. COT reports. Pound swings from side to side amid rumors. Bulls expect to return to 1.3340 2020-12-15 To open long positions on GBP/USD, you need: Quite a lot of profitable signals to enter the market appeared yesterday morning. The US session also went well enough, and it was possible to make money on the pound's decline. Yesterday I analyzed long deals in detail in my afternoon forecast. If you look at the 5-minute chart, you will see how the bulls surpassed the 1.3340 level, afterwards they returned to this range from the bottom up, which produced a good signal to open long positions. After that, it immediately rose to a high of 1.3388, where the first profit taking and a 25-point downward correction was observed. A repeated test of this level led to a breakout, afterwards a buy signal appeared, exactly like the first deal. The pound grew by another 50 points, which led to a renewal of the high of 1.3437, where I recommended selling the pound immediately on a rebound, and it happened. A downward correction from the 1.3437 level led to a renewal of support at 1.3388. Getting the pair to settle below this level and its renewal from the bottom up by the middle of the US session produced another entry point to short positions, which pushed GBP/USD to the 1.3340 area, from where growth was observed since the beginning of the European session. Thus, the technical picture has not changed in any way, and the goals and objectives, for both, remained the same. 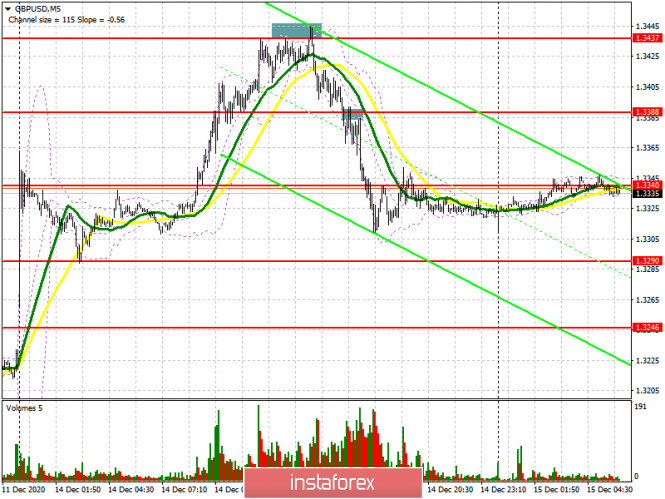
The buyers' task is to maintain control over the 1.3290 level. Forming a false breakout there in the first half of the day will be an excellent signal to open long positions in hopes for the pound to recover in the short term. The main target will be a breakout and surpassing resistance at 1.3340, testing it from top to bottom produces an additional entry point to long positions in hopes to reach a high of 1.3388, where I recommend taking profits. The next targets are still resistances 1.3437 and 1.3489, but they will be available only if we receive good data on the unemployment rate and the number of applications for unemployment benefits in the UK in November. Also, any good news on the Brexit agreement will affect the course of trading. In case bulls are not active in the 1.3290 support area, it is best not to rush into long deals, but to wait for an update of the 1.3246 low. However, I recommend opening long positions from this level only after forming a false breakout. A larger support level is seen in the 1.3193 area, where you can buy GBP/USD immediately on a rebound, counting on a correction of 20-30 points. To open short positions on GBP/USD, you need: Bears will be concentrated at 1.3340. Like yesterday, forming a false breakout there will return the pressure to the pair and lead to a test of support at 1.3290, where the moving averages pass, which are still playing on the side of the pound buyers. Surpassing this level and testing it from the bottom up, similar to yesterday's sales from the highs, which I analyzed above, produces a good signal to sell the pound in hopes to fall to the 1.3246 low. Bad news on the trade deal will sharply pull down GBP/USD towards the lows of 1.3193 and 1.3114, on which the succeeding bear market will depend. If the bulls manage to recapture the 1.3340 level, then it is better not to rush with short positions. The optimal scenario for selling the pound would be failure to settle above 1.3388. I recommend opening short positions immediately on a rebound from the high of 1.3437, counting on a downward correction of 25-30 points within the day. Let me remind you that the parties agreed to continue negotiations this week, which will further complicate the issue of ratifying the agreement if it is reached at the last moment. 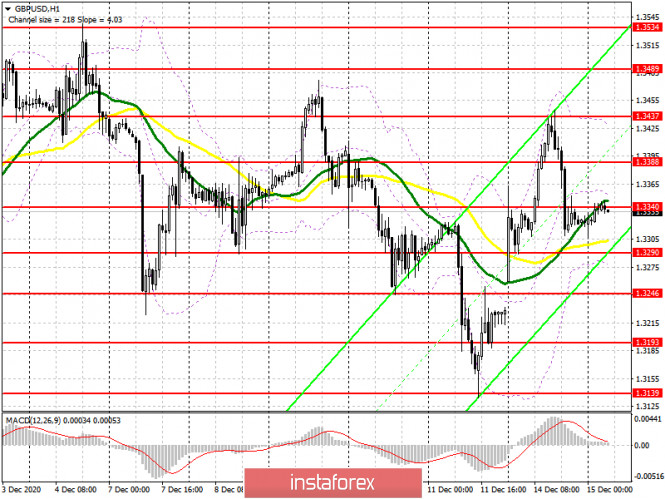
The Commitment of Traders (COT) reports for December 8 notes significant interest in the British pound. Long non-commercial positions rose from 37,087 to 39,344. At the same time, short non-commercial positions decreased from 44,986 to 33,634. As a result, the non-commercial net position became positive and jumped to 5,710 against a negative value of -7,899 a week earlier. All this suggests that traders are ready to bet on the pound's succeeding growth at the beginning of 2021 and on the buyers' advantage in the current situation even when there is no trade deal at the moment, and take note that there is just around two weeks left until the end of the year. Indicator signals: Moving averages Trading is carried out in the area of 30 and 50 moving averages, which indicates the sideways nature of the market, even with such strong volatility. Note: The period and prices of moving averages are considered by the author on the H1 hourly chart and differs from the general definition of the classic daily moving averages on the D1 daily chart. Bollinger Bands A break of the lower border of the indicator around 1.3290 will increase the pressure on the pound. A breakout of the average border of the indicator in the 1.3355 area will lead to a new wave of growth for the pair. Description of indicators - Moving average (moving average, determines the current trend by smoothing out volatility and noise). Period 50. It is marked in yellow on the chart.
- Moving average (moving average, determines the current trend by smoothing out volatility and noise). Period 30. It is marked in green on the chart.
- MACD indicator (Moving Average Convergence/Divergence — convergence/divergence of moving averages) Quick EMA period 12. Slow EMA period to 26. SMA period 9
- Bollinger Bands (Bollinger Bands). Period 20
- Non-commercial speculative traders, such as individual traders, hedge funds, and large institutions that use the futures market for speculative purposes and meet certain requirements.
- Long non-commercial positions represent the total long open position of non-commercial traders.
- Short non-commercial positions represent the total short open position of non-commercial traders.
- Total non-commercial net position is the difference between short and long positions of non-commercial traders.
Trading recommendations for GBP/USD and EUR/USD on 12/15/20 2020-12-15 
Past review of GBP/USD pair Traders were surprised with the pound's upward movement yesterday, whose scale was approximately 215 points. What was the impetus for the upward interest? As before, speculators move on a basis of the information flow associated with Brexit trade negotiations, where they actively discussed a possible positive result and the UK's concessions to Europe regarding the "equal playing field". What happened on the trading chart? The new trading week began with a huge price gap of about 145 pips, primarily due to the positive Brexit information noise flow over the weekend. European traders supported the upward trend, as a result of which the pound continued to strengthen up to the level of 1.3444. Such an impressive price change in the market led to the pound's local overbought, which corrected the rate towards the level of 1.3300. The British currency began to decline since the beginning of the European session, where the scale already reached 185 points by the American session, which is considered a very large price change. 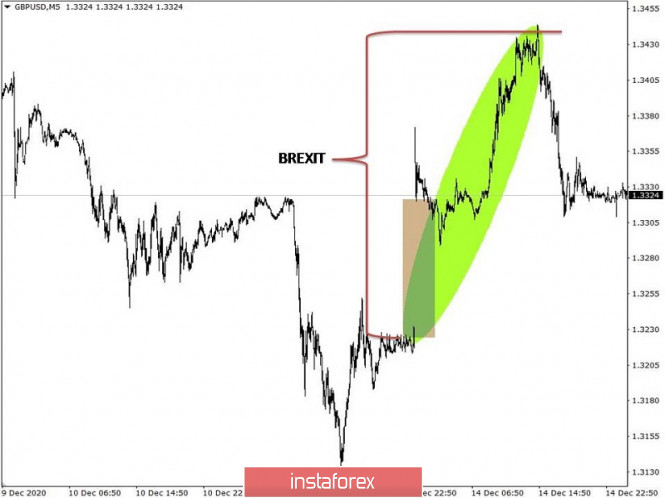
Past review of EUR/USD pair The Euro partially repeated the dynamics of the pound in relation to the upward interest, but the volatility was much less. What was published on the economic calendar? Europe's industrial production data was published, where they predicted a slowdown in the decline from -6.8% to -4.4%, but the result of the data came out better than expected -3.8%. However, there was no market reaction, since all traders were working on the Brexit information flow that time and the value of the euro and pound were strengthening. What happened on the trading chart? Initially, there was a price gap of 20 points, after which European traders picked up buy positions and pulled the euro towards the level of 1.2176, where last week's local high was updated. At the end of the day, the quote remained at the level of 1.3150. Trading recommendation for GBP/USD on December 15 We do not have the best data on the UK labor market for today. The unemployment rate is expected to rise from 4.8% to 5.1%, which may negatively affect the pound's exchange rate. At the same time, we should not forget about the Brexit information flow, where a group of British and European negotiators continue to work on a trade deal. Any information about this can affect the rate of the pound sterling. Positive Brexit news leads to a stronger pound, while negative Brexit news leads to a weaker pound. In terms of technical analysis, a significant range of 1.3310/1.3350 can be seen, wherein the quote develops. If the price stays in one place for too long, it can lead to local surge in activity, where the method of breaking a particular border of the range is considered as the best trading tactic. - Buying a currency pair at a price above the level of 1.3355, with the prospect of moving to 1.3400 is recommended. - Selling the currency pair at a price below the level of 1.3300, with the prospect of moving to 1.3265-1.3220 is recommended. 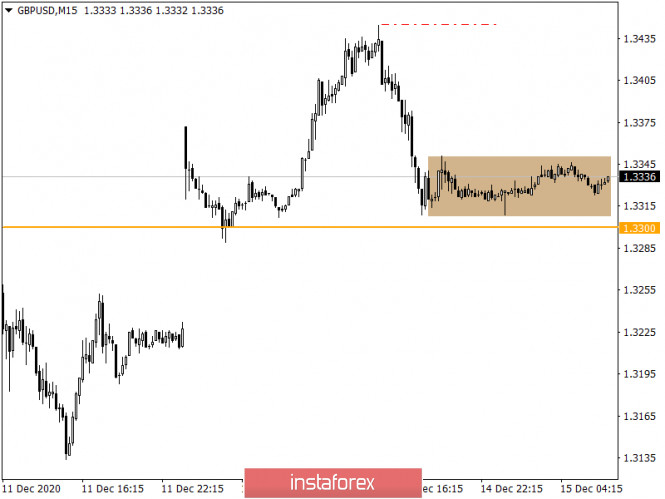
Trading recommendation for EUR/USD on December 15 Looking at today's economic calendar, there is only data on the volume of US industrial production, where the decline rate is expected to slow down from -5.3% to -5.0%. As for the market analysis, price fluctuations at the conditional peak of the medium-term upward trend can be seen. A price consolidation above 1.2180 in a four-hour time frame will lead to the euro's further strengthening towards 1.2250. The overbought factor of the Euro still remains in the market. Therefore, we should not exclude a possible correctional movement, if there will be no price consolidation above 1.2180. 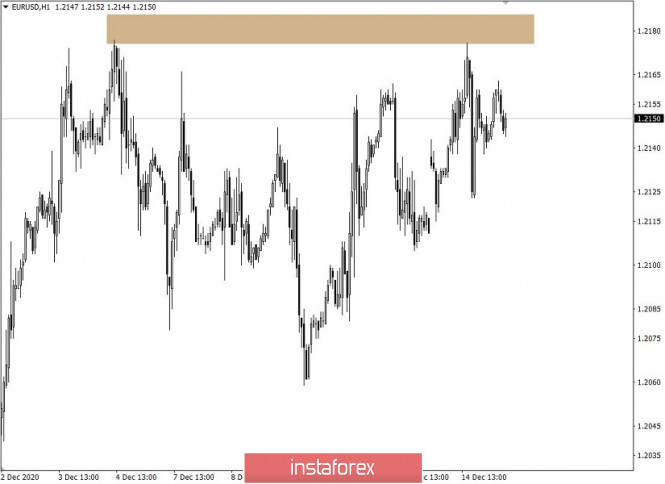
Technical Analysis of GBP/USD for December 15, 2020 2020-12-15 Technical Market Outlook: The bulls on GBP/USD pair are still trying to resume the up trend, but the recent attempt had been capped at the level of 1.3444 when a Shooting Star candlestick pattern was made at the H4 time frame chart. If the bulls will break through the trend line resistance seen around the level of 1.3440, then the next target is the local high at 1.3476. For now the local technical support is located at the level of 1.3306. Please notice, the up trend at the daily time frame chart is still in progress. Weekly Pivot Points: WR3 - 1.3813 WR2 - 1.3637 WR1 - 1.3455 Weekly Pivot - 1.3298 WS1 - 1.3125 WS2 - 1.2955 WS3 - 1.2786 Trading Recommendations: The GBP/USD pair is in the down trend on the monthly time frame, but the recent bounce from the low at 1.1411 made in the middle of March 2020 looks very strong and might be a reversal swing. In order to confirm the trend change, the bulls have to break through the technical resistance seen at the level of 1.3518. All the local corrections should be used to enter a buy orders as long as the level of 1.2674 is not broken. 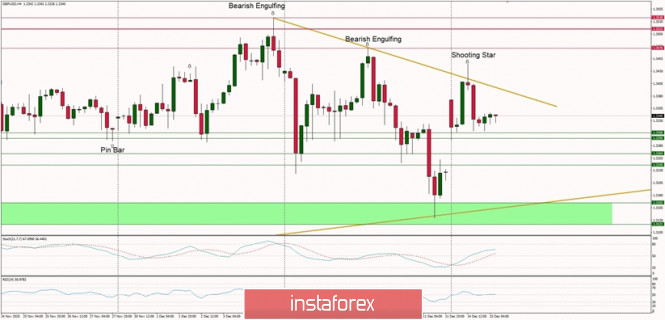
Technical Analysis of EUR/USD for December 15, 2020 2020-12-15 Technical Market Outlook: The EUR/USD pair has bounced from the short-term trend line support around the level of 1.2060, so the trend line is still being recognized by the market participants and still provides the support. The bulls are still trying to break higher above the level of 1.2177, the previous swing high, but the last attempt has ended with a Bearish Engulfing pattern at the H4 time frame chart. The momentum is now strong and positive, so if the technical resistance located at the level of 1.2154 and 1.2163 is broken, EUR could rally higher towards the level of 1.2411. The larger time frame trend remains up. Weekly Pivot Points: WR3 - 1.2281 WR2 - 1.2233 WR1 - 1.2171 Weekly Pivot - 1.2118 WS1 - 1.2069 WS2 - 1.2005 WS3 - 1.1960 Trading Recommendations: Since the middle of March 2020 the main trend is on EUR/USD pair has been up. This means any local corrections should be used to buy the dips until the key technical support is broken. The key long-term technical support is seen at the level of 1.1609. The key long-term technical resistance is seen at the level of 1.2555. 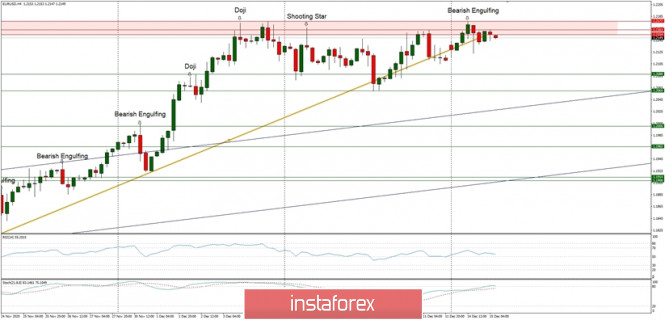
Indicator analysis. Daily review on the EUR/USD currency pair for December 15, 2020 2020-12-15 Trend analysis (Fig. 1). Today, the market from the level of 1.2142 (closing of yesterday's daily candlestick) may continue the upward movement with the target of 1.2177 resistance level (blue thick line). After testing this level, the price will continue to move up with the target of 1.2274 – the pullback level of 85.4% (yellow dotted line). 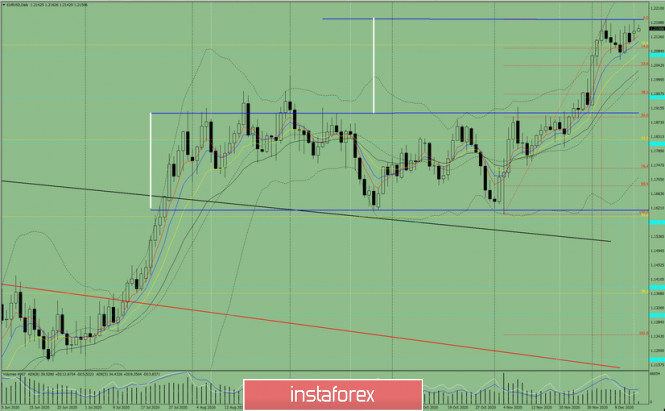
Figure 1 (Daily Chart). Comprehensive analysis: - Indicator analysis - up
- Fibonacci levels - up
- Volumes - up
- Candlestick analysis - up
- Trend analysis - up
- Bollinger bands - up
- Weekly chart - up
General conclusion: Today, the price from the level of 1.2142 (closing yesterday's daily candlestick) may continue to move up with the target of 1.2177 resistance level (blue thick line). After testing this level, the price will continue to move up with the target of 1.2274 – the pullback level of 85.4% (yellow dotted line). Unlikely scenario: when working up to reach the resistance level of 1.2177 (blue bold line), a downward movement is possible with the target of 1.2093 – a pullback level of 14.6% (red dotted line). Indicator analysis. Daily review for the GBP/USD currency pair on 15/12/2020 2020-12-15 Yesterday, the pair moved up and tested the pullback level of 76.4% at 1.3442 (yellow dotted line) and then went down quite strongly, closing the day at 1.3324. Today, the pair might continue to move up. News on the market is not expected today. Trend analysis (Fig. 1). Today, from the level of 1.3324 (the closing of yesterday's daily candle), the market will try to continue moving up with the target of 1.3382 which is a pullback level of 61.8% (yellow dotted line). If this level is reached, work up with the target of 1.3442 which is a pullback level of 76.4% (yellow dotted line). 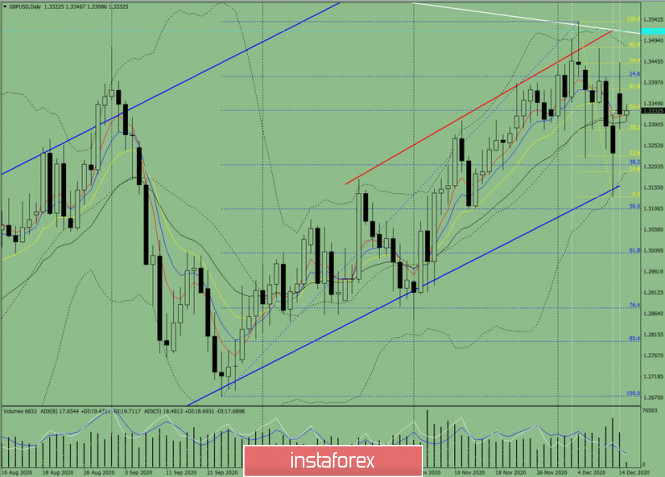 Figure 1 (daily chart). Comprehensive Analysis: - Indicator Analysis – up
- Fibonacci Levels – up
- Volumes – up
- Candle Analysis – up
- Trend Analysis – up
- Bollinger Bands – up
- Weekly Chart – up
General conclusion: Today, from the level of 1.3324 (the closing of yesterday's daily candle), the market will try to continue moving up with the goal of 1.3382 which is a pullback level of 61.8% (yellow dotted line). If this level is reached, work up with the target of 1.3442 which is a pullback level of 76.4% (yellow dotted line). Alternative scenario: The market will move up with a target of 1.3382 which is a pullback level of 61.8% (yellow dotted line). If this level is reached, work down with the target of 1.3207 which is a pullback level of 38.2% (blue dotted line). Elliott wave analysis of EUR/JPY for December 15, 2020 2020-12-15 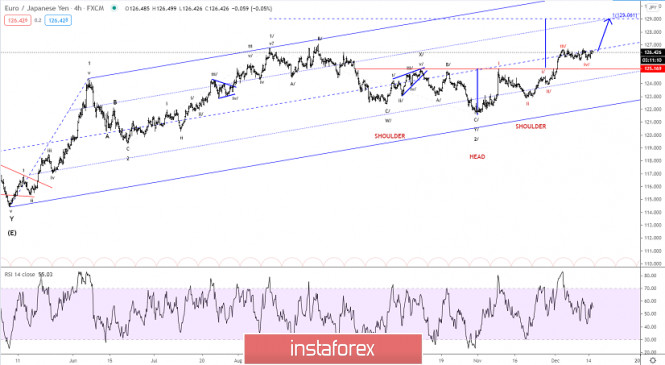
We continue to look for a break above minor resistance at 126.78 for a continuation higher towards 127.02 and ideally closer to 129.06 as the next upside targets. However, as long as minor resistance is able to cap the upside, we most accept more sideways consolidation within the 126.00 - 126.78 range, but ultimately a break higher is expected. Minor supports is seen at 126.26 and 126.00. R3: 127.75 R2: 127.30 R1: 126.78 Pivot: 126.26 S1: 126.00 S2: 125.75 S3: 125.50 Trading recommendation: We are long EUR from 126.25 with our stop placed at 125.70 Elliott wave analysis of NZD/USD for December 15, 2020 2020-12-15 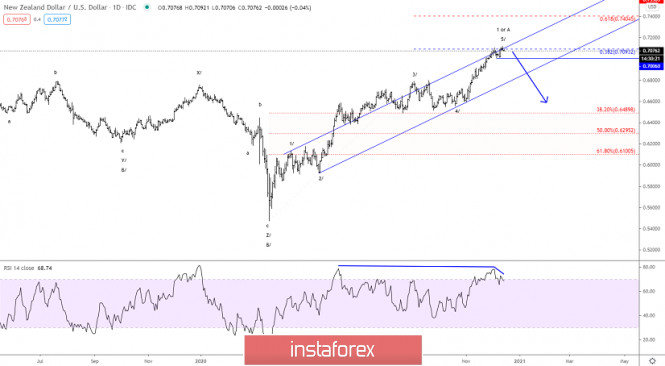
NZD/USD has staged a five-wave rally since the March 19 low at 0.5468. This means a top is nearby and a correction towards at least 0.6490 should be expected in the coming weeks. Short-term, a break below minor support at 0.7006 will confirm the top is in place and a correction is unfolding. The first target to look for is the 38.2% corrective target at 0.6490 but a deeper correction can't be excluded. To support our assessment that a top is nearby, we see negative divergence from the RSI pointing towards a loss of upside momentum. R3: 0.7200 R2: 0.7150 R1: 0.7105 Pivot: 0.7068 S1: 0.7044 S2: 0.7006 S3: 0.6960 Trading recommendation: Long positions should be protected by a stop and reverse to a short position upon a break below 0.7006. GBP/USD. December 15. COT report. New rumors about trade negotiations led to new growth in the British 2020-12-15 GBP/USD – 1H. 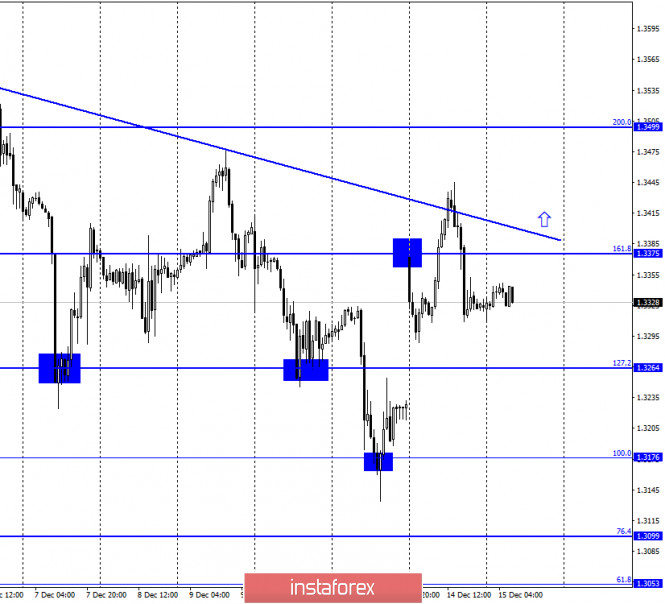
According to the hourly chart, the quotes of the GBP/USD pair performed an increase to the downward trend line and performed a very inaccurate rebound from this line, which at first could be taken as a consolidation above it. Nevertheless, as a result, there was a rebound, a reversal in favor of the US currency, and a new fall began in the direction of the corrective level of 127.2% (1.3264). Fixing the pair's rate above the trend line will work in favor of new growth in the direction of the Fibo level of 200.0% (1.3499). As long as the pound continues to fly, news continues to flow on the key topic of Brexit and trade negotiations, even when they are no longer expected. Yesterday, for example, the British newspaper The Financial Times said, citing its sources, that a deal will still be concluded at the last moment before December 31. Traders immediately reacted with strong purchases of the British dollar and did not even pay attention to the conditions for the UK in this proposed transaction. The Financial Times believes that it is London that will have to concede seriously. However, information from a British newspaper can not be taken seriously. First, there were a huge number of such articles, and "your sources" does not mean that the information is true. Secondly, it is difficult to imagine that Boris Johnson will eventually agree to an agreement not according to his own rules. This will mean that the British Prime Minister is backing down, as for a year he has been trumpeting in all directions that London will seek a "fair agreement" and will not accept the "barbaric" demands of Brussels, which contradict the position of the UK as a sovereign and independent state. GBP/USD – 4H. 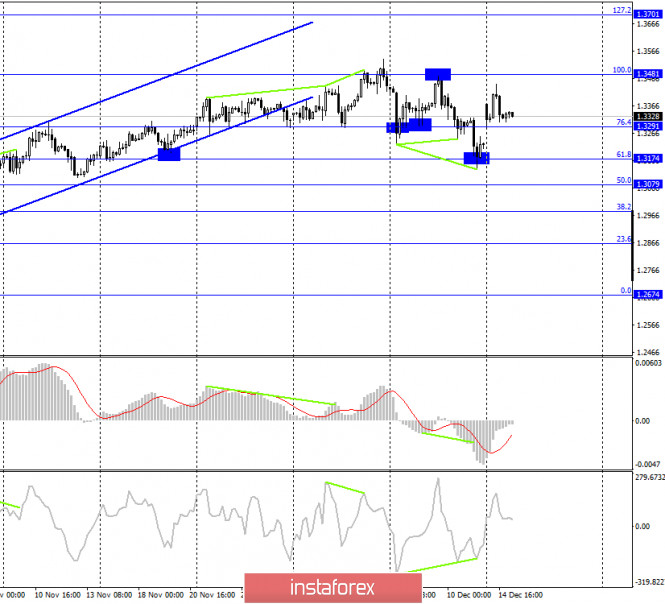
On the 4-hour chart, the GBP/USD pair performed a rebound from the corrective level of 61.8% (1.3174), a reversal in favor of the British, and a consolidation above the Fibo level of 76.4% (1.3291). Thus, the growth process can now be continued towards the next Fibo level of 100.0% (1.3481). The bullish divergence of the CCI indicator also worked in favor of the beginning of the pair's growth. However, the potential of bull traders is still limited by the descending trend line on the hourly chart. GBP/USD – Daily. 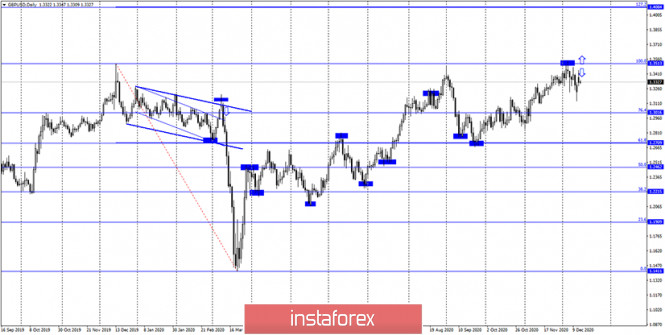
On the daily chart, the pair's quotes performed a rebound from the corrective level of 100.0% (1.3513). And this rebound remains the most important and clear signal on all charts. If the rebound is not false (and so far it does not look false), then the British pound is waiting for a significant drop. GBP/USD – Weekly. 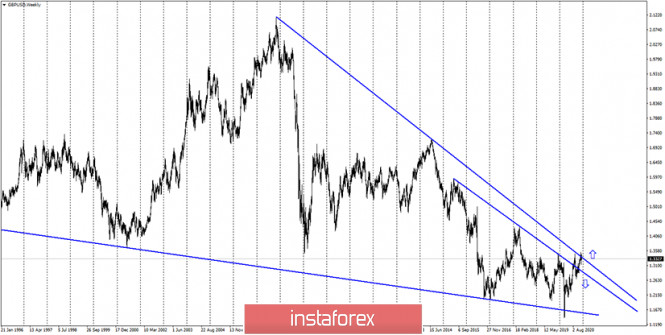
On the weekly chart, the pound/dollar pair performed an increase to the second downward trend line. A rebound from it in the long term will mean a reversal in favor of the US dollar and a long fall in the British dollar's quotes. Overview of fundamentals: There were no major reports in the UK and the US on Monday. Thus, there was no information background, which did not prevent traders from trading very actively. News calendar for the United States and the United Kingdom: UK- change in the number of applications for unemployment benefits (07:00 GMT). UK - unemployment rate (07:00 GMT). UK - change in average earnings (07:00 GMT). US - change in industrial production (14:15 GMT). On December 15, the UK has already released reports on the unemployment rate, applications for benefits, as well as on wages. The first two showed a deterioration in the situation, the third exceeded the expectations of traders. The Briton did not move at this time. COT (Commitments of Traders) report: 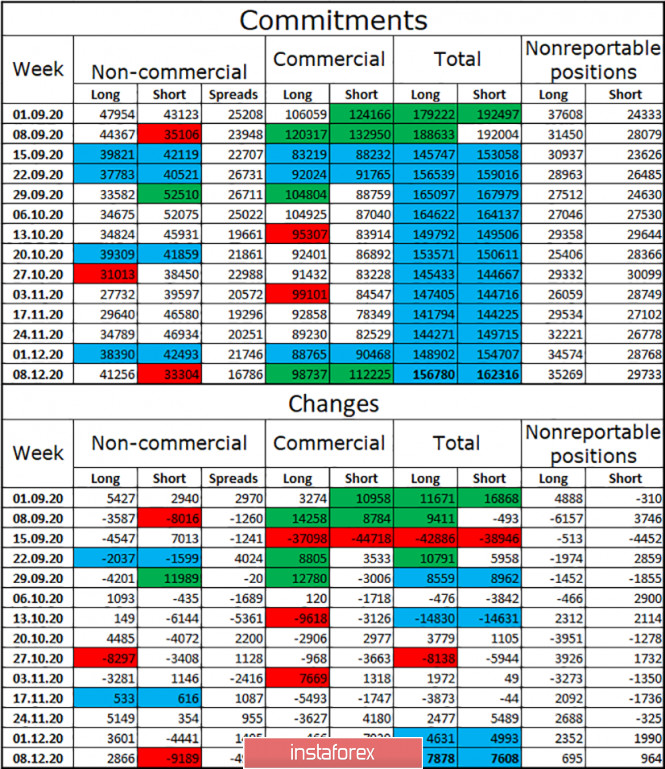
The latest COT report showed a new increase in the number of long contracts held by speculators. This time, the total number of contracts increased by 2,866, while the number of short-contracts decreased by 9,189. Thus, the mood of speculators has become much more "bullish" and is becoming so for the third week in a row. Given this fact, the growth of the British dollar is quite understandable, although the information background is not entirely on the side of the British currency. However, given that speculators have again taken up quite large purchases of the pound, we can assume its new growth. In this regard, I recommend that you carefully monitor the level of 1.3513 on the daily chart. Closing above it will confirm the intention of traders to re-open long contracts. The total number of open long and short contracts for all groups of traders remains approximately the same. GBP/USD forecast and recommendations for traders: At this time, I recommend that you be extremely careful with opening any deals on the British. The pair continues to move very raggedly and often changes direction. I recommend making new purchases of the British dollar if it is fixed above the trend line on the hourly chart with the target level of 200.0% (1.3499). The British dollar should have been sold with targets of 1.3264 and 1.3176, as it was rebounded from the trend line on the hourly chart. Terms: "Non-commercial" - major market players: banks, hedge funds, investment funds, private, large investors. "Commercial" - commercial enterprises, firms, banks, corporations, companies that buy currency, not for speculative profit, but to ensure current activities or export-import operations. "Non-reportable positions" - small traders who do not have a significant impact on the price. EUR/USD. December 15. COT report. Joe Biden's official victory. Donald Trump still doesn't recognize the results and is going to go all the way 2020-12-15 EUR/USD – 1H. 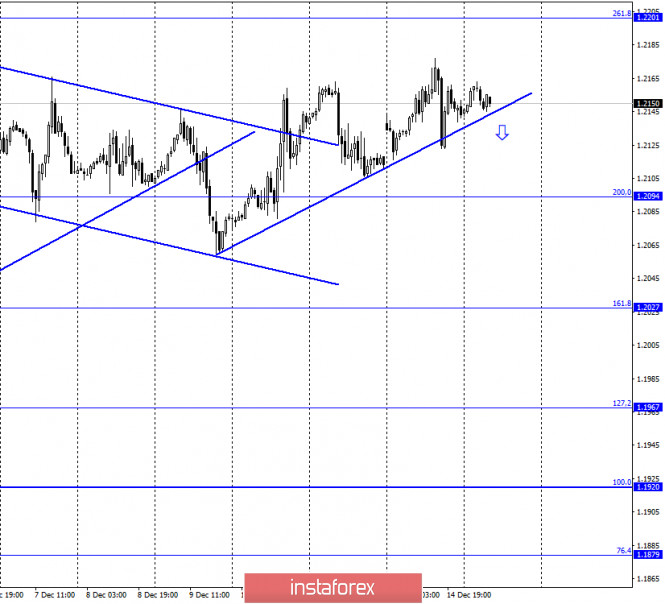
On December 14, the EUR/USD pair attempted to consolidate under the upward trend line, however, it failed. Thus, the "bullish" mood of most traders remains, and the process of growth of quotes can be continued in the direction of the corrective level of 261.8% (1.2201). Fixing the pair's rate under the trend line will work in favor of the US currency and some fall in the direction of the Fibo level of 200.0% (1.2094). Meanwhile, this night, the official results of the US presidential election 2020 became known. Let me remind you that the event that took place on November 3 was the will of the people. Further, on December 14, the so-called "electoral colleges" - specially authorized people from each state, whose votes are counted in the end. Usually, this procedure is purely a formality, since the electors almost always cast their votes for the candidate chosen by the majority in the state. However, there are surprises sometimes. This did not affect the election results. Yesterday, everything went without incident. No elector dared to go against the will of the people and Joe Biden eventually received 306 votes, and Donald Trump – 232. However, Donald Trump himself did not change his opinion: "I am concerned that there will be an illegitimate president in this country. There will be a president who lost, and lost very seriously." EUR/USD – 4H. 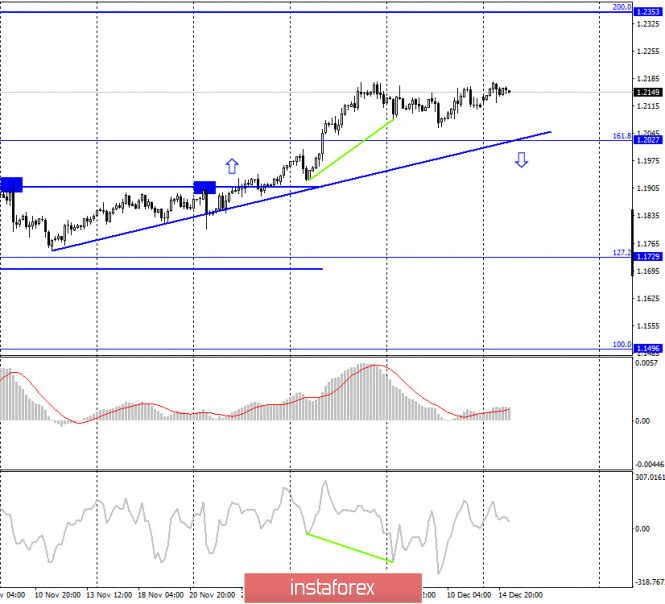
On the 4-hour chart, the pair's quotes continue to grow in the direction of the corrective level of 200.0% (1.2353). The upward trend line still characterizes the current mood of traders as "bullish" and increases the probability of further growth. As long as the quotes do not consolidate under the trend line, you should not expect a strong fall in the pair. EUR/USD – Daily. 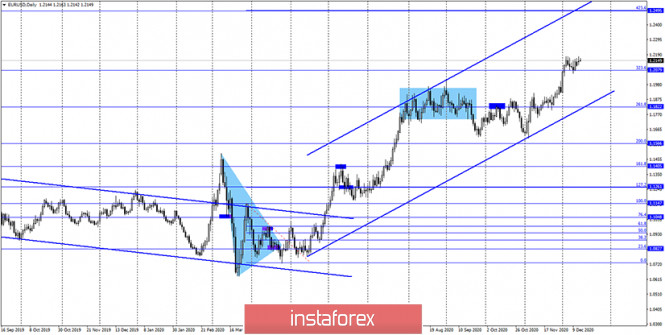
On the daily chart, the quotes of the EUR/USD pair performed a consolidation above the Fibo level of 323.6% (1.2079), which allows traders to expect continued growth in the direction of the next corrective level of 423.6% (1.2495). And until the pair completes the consolidation below the level of 323.6%, there are still high chances of growth. EUR/USD – Weekly. 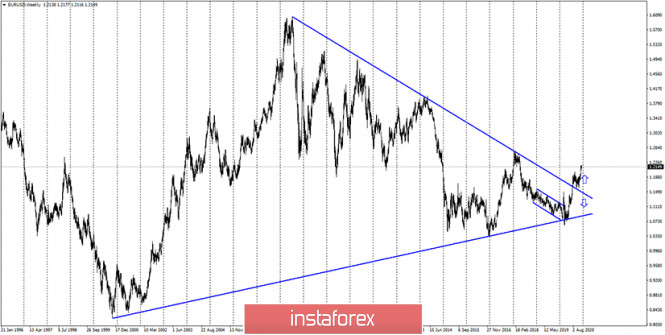
On the weekly chart, the EUR/USD pair performed a consolidation above the "narrowing triangle", which preserves the prospects for further growth of the pair in the long term. Overview of fundamentals: On December 14, in the European Union and America, the calendars of economic events were completely empty. Thus, there was no information background. The news calendar for the United States and the European Union: US - change in industrial production (14:15 GMT). On December 15, the calendars of economic events in the European Union and America are almost empty again. There will only be a more or less important report on industrial production in the United States and that's it. COT (Commitments of Traders) report: 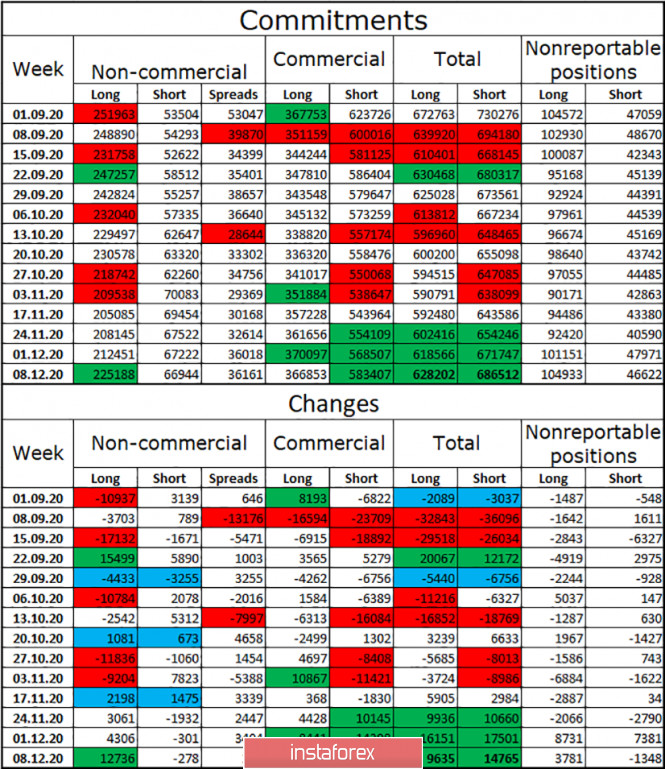
For the fourth week in a row, the mood of the "Non-commercial" category of traders has become more "bullish". This is indicated by COT reports and it coincides with what is happening now for the euro/dollar pair. During the reporting week, speculators opened as many as 13,000 new long contracts (more than in the previous three weeks), and also got rid of 300 short contracts. Thus, they significantly increased their "bullish" mood. The gap between the total number of long and short contracts in the hands of the "Non-commercial" category is growing again. Therefore, the European currency now continues to maintain high chances of continuing growth, although a month ago it was preparing for a powerful fall. The "Commercial" category of traders, on the contrary, opened short contracts, however, it always trades against speculators. And we pay attention first of all to them. EUR/USD forecast and recommendations for traders: Today, I recommend selling the euro with targets of 1.2094 and 1.2060, if the consolidation is made under the trend line on the hourly chart. Purchases of the pair could be opened by fixing quotes above the descending corridor, and yesterday - by rebounding from the trend line, with targets of 1.2175 and 1.2201. Trading has been taking place recently without a clear advantage of bulls or bears, but the 4-hour and daily charts maintain high chances of growth. Terms: "Non-commercial" - major market players: banks, hedge funds, investment funds, private, large investors. "Commercial" - commercial enterprises, firms, banks, corporations, companies that buy currency, not for speculative profit, but to ensure current activities or export-import operations. "Non-reportable positions" - small traders who do not have a significant impact on the price. EUR/USD and GBP/USD: COVID-19 vaccination has begun in the US. Rumors say the UK and the EU finally found a compromise on the post-Brexit trade deal. 2020-12-15 The euro is trading in a narrow sideways channel, and it seems that traders are in no hurry to increase long positions despite the news that COVID-19 vaccination has begun in the United States. The drug developed by Pfizer is expected to arrive in many US hospitals today, but the first 3 million doses will be strictly rationed and distributed among medical workers and elderly patients who are most at risk of complications from the virus. Nonetheless, hundreds of millions of Americans are projected to be vaccinated in the coming months.  The US Food and Drug Administration will also publish its analysis on the COVID-19 vaccine developed by Moderna. If the FDA advisers give a positive recommendation on Thursday, the agency could give the green light to the vaccine. But in the meantime, the enthusiasm of euro bulls have dropped after the ECB meeting last week, during which the members decided to increase the volume of their Emergency Asset Purchase Program (PEPP) by € 500 billion, and extended its operation until March 2022. Such made investors realize that negative interest rates, large bond purchase program and negative yields in the euro zone will persist for a rather long period of time, at least until the economy is fully restored to the pre-crisis values, which can take years. Meanwhile, with regards to economic reports, data on the eurozone's industrial production was published, and it indicated a good growth in October, which increases the chance that rates will be quite high in November this year, especially since the partial lockdown of the EU economy affected the service sector more. 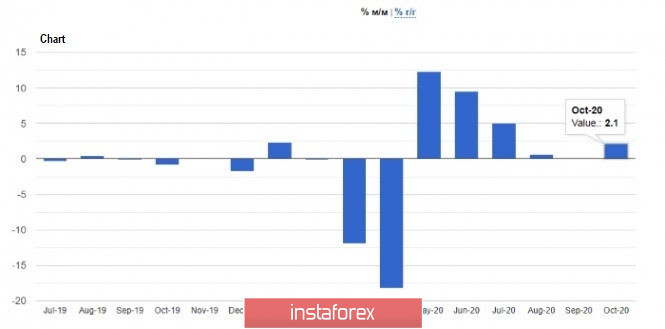 According to Eurostat, the index jumped 2.1% in October, but in annual terms fell by 3.8%. Economists had expected the index to rise 2% and decline 4.4%, respectively. As for the EUR/USD pair, movement will depend on whether the quote manages to consolidate above 1.2165 or not. Moving past this level will make it easier for the euro to reach 1.2250 and 1.2340, but if the quote returns below 1.2060, the EUR/USD pair will collapse to 1.1980 and then to 1.1890. GBP/USD: Yesterday, both the UK and the EU decided to continue negotiations on Brexit, which supported the British pound. Rumors also say both parties have allegedly found an understanding on how much the UK should be tied to the EU, which led to the strengthening of the pair in the morning. However, the enthusiasm quickly faded, so the pound returned to a more fair price area. Now, it will move depending on whether the quote breaks out of 1.3340 or not, as only going beyond which will the quote be able to reach 1.3390 and 1.3490. But if the pair goes below 1.3245 again, the pound will collapse to 1.3190 and then to 1.3140. AUD/USD: The Australian dollar declined after the Reserve Bank of Australia said further economic growth will be uneven and prolonged. This means that GDP will take longer to return to pre-pandemic levels, especially since the RBA expects a long period of high unemployment and low wage growth. Inflation will also remain low for several years, leading to continued monetary and fiscal stimulus for quite some time. Against this background, the AUD/USD pair dropped from 0.7576 to 0.7510, and a breakout from this range will lead to a deeper collapse to 0.7480 and 0.7425. But if the aussie returns to 0.7545, the AUD/USD pair may move up to 0.7580 and then to 0.7610. Simplified wave analysis and forecast for EUR/USD, AUD/USD, and GBP/JPY on December 15 2020-12-15 EUR/USD Analysis: The upward wave of the European currency, which started in March, is approaching the lower border of the preliminary target zone. At the end of last week, another correction was completed. From this time on, the price forms a reversal pattern before the final break in the trend. Forecast: In the next trading session, there is a high probability of a flat movement with a downward vector. A breakout of the lower support limit is unlikely. By the end of the day, we expect an increase in the activity and the beginning of a price rise. Potential reversal zones Resistance: - 1.2210/1.2240 Support: - 1.2130/1.2100 Recommendations: Sales in the euro market today may be unprofitable. In the area of the calculated support zone, it is recommended to look for signals to buy the pair. 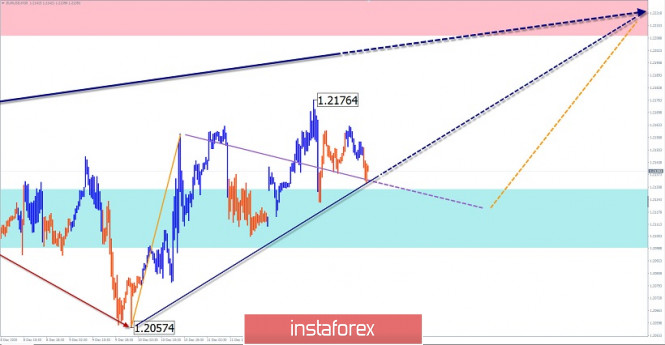
AUD/USD Analysis: Since March of this year, the Australian dollar chart has been developing an upward trend on a daily scale. The unfinished section counts down from November 2. The price has reached the lower limit of the strong zone of a potential reversal of a large TF. A small-scale corrective zigzag has been forming since last Friday. Forecast: On the next day, the price is expected to move in the corridor between the opposite zones, mainly with a downward vector. In the European session, a short-term price rise to the resistance zone is possible. Potential reversal zones Resistance: - 0.7550/0.7580 Support: - 0.7480/0.7450 Recommendations: Today, short-term sales with a reduced lot are possible on the "Aussie" market. It is safer to refrain from trading until the decline is complete. 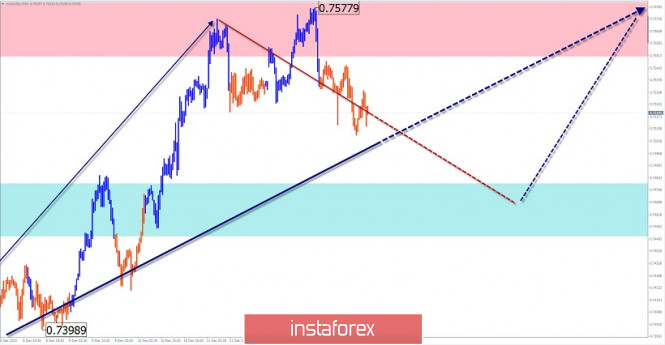
GBP/JPY Analysis: In the pair's market since the end of September, the trend is set by an upward wave. After a sideways correction from December 7, a reversal pattern is formed on the chart before the next jump in the main exchange rate. There is a clear zigzag in its structure. Forecast: In the current day, you can expect the completion of the downward movement of the pair, a reversal, and a second rise in the area of the nearest resistance. In case of a further upward breakout, the next target will be the next calculated zone. Potential reversal zones Resistance: - 140.20/140.50 - 139.10/139.40 Support: - 138.10/137.80 Recommendations: Today, when selling the pair, there is a high probability of receiving losses. It is recommended to refrain from trading during the pullback and look for buy signals at the end of it in the support area. 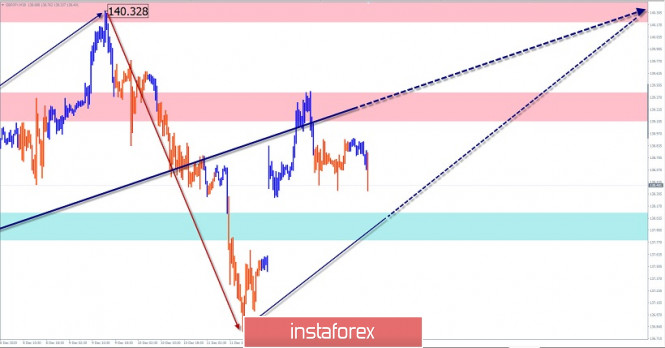
Explanation: In the simplified wave analysis (UVA), waves consist of 3 parts (A-B-C). The last incomplete wave is analyzed. The solid background of the arrows shows the formed structure, and the dotted one shows the expected movements. Note: The wave algorithm does not take into account the duration of the instrument's movements in time! Forex forecast 12/15/2020 on EUR/GBP, GBP/USD, USD/CAD and DAX from Sebastian Seliga 2020-12-15 Let's take a look at the technical situation on USD/CAD, EUR/GBP, GBP/USD and German DAX index. Technical analysis of USD/JPY for December 15, 2020 2020-12-15 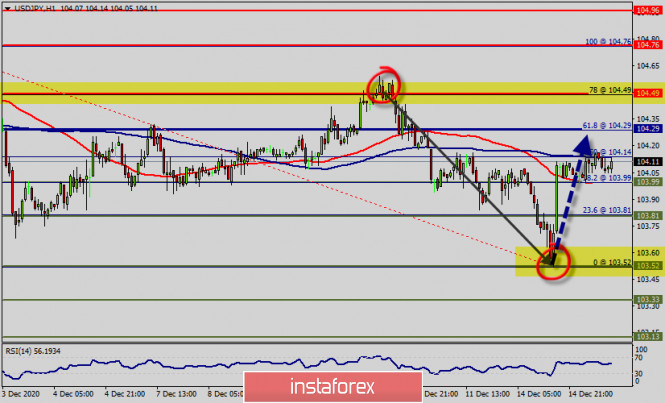 Overview : The USD/JPY pair rose from the bottom of 103.52 to the top of 104.76. The USD/JPY pair rebounded strongly after dipping to 104.09 and intraday bias is turned neutral again. Overall, the pair is staying inside the falling channel from 104.76. The USD/JPY pair is still staying in long term falling channel that started back in 104.76 since last week. Hence, there is no clear indication of trend reversal yet. The USD/JPY pair is as yet on the bearish side, according to intraday technical readings. The 1-hour chart shows that the latest advance stalled around a mildly bearish 50 SMA, which develops below the largest ones. Additionally, the RSI is still calling for a strong bearish market as well as the current price is also above the moving average 100 SMA and 50 SMA. Also, if the trend is buoyant, then the currency pair strength will be defined as following: USD is in an uptrend and Yen is in a downtrend. The Relative Strength Index (RSI) is considered overbought because it is set around 70. Dropped perfectly, remain bearish for another drop nearly 104.76. Price has dropped absolutely perfectly from our selling area and has since made an intermediate recovery. We're back to testing our major resistance again and we look to sell below 104.76 or/and 104.49. The pair bounced from a critical support level, with the bearish potential set to increaseas long as the trend sets below the spot of 104.76 - 104.49. However, if the pair fails to pass through the level of 104.76, the market will indicate a bearish opportunity below the strong resistance level of 104.76 (the level of 104.76 coincides with the double top too). Since there is nothing new in this market, it is not bullish yet. Break of 104.00 will target 103.81 first. Break there will resume the whole decline to 103.52 low. For now, break of 104.00 support is needed to indicate short term bottoming. Otherwise, outlook will stay bearish in case of recovery. The down trend could still extend through 103.33 low. On the upside, break of 104.76 resistance is needed to be the first signal of medium term reversal. On the other hand, outlook will remain bearish Trading recommendations : According to previous events, the USD/JPY pair is trading between the level of 104.76 and the 103.52 level (those levels coincided with the top price and bottom point respectively). It should be noted that the 104.76 price (around double top at the level of 104.76) will act as a strong resistance on December 15, 20120. Therefore, it will be too gainful to sell short below 104.76 and look for further downside with 103.81, 103.52 and 103.33 targets. It should also be reminded that stop loss must never exceed the maximum exposure amounts. Thus, stop loss should be placed at the 105.10 level today.
Author's today's articles: Maxim Magdalinin  In 2005 graduated from the Academy of the Ministry of Internal Affairs of the Republic of Belarus, law faculty. Worked as a lawyer for three years in one of the biggest country's company. Besides the trading, he develops trading systems, writes articles and analytical reviews. Works at stock and commodity markets explorations. On Forex since 2006. In 2005 graduated from the Academy of the Ministry of Internal Affairs of the Republic of Belarus, law faculty. Worked as a lawyer for three years in one of the biggest country's company. Besides the trading, he develops trading systems, writes articles and analytical reviews. Works at stock and commodity markets explorations. On Forex since 2006. Vladislav Tukhmenev  Vladislav graduated from Moscow State University of Technologiy and Management. He entered the forex market in early 2008. Vladislav is a professional trader, analyst, and manager. He applies a whole gamut of analysis – technical, graphical, mathematical, fundamental, and candlestick analysis. Moreover, he forecasts the market movements using his own methods based on the chaos theory. Vladimir took part in development of trading systems devoted to fractal analysis. In his free time, Vladimir blogs about exchange markets. Hobbies: active leisure, sporting shooting, cars, design, and marketing. "I do not dream only of becoming the best in my field. I also dream about those who I will take with me along the way up." Vladislav graduated from Moscow State University of Technologiy and Management. He entered the forex market in early 2008. Vladislav is a professional trader, analyst, and manager. He applies a whole gamut of analysis – technical, graphical, mathematical, fundamental, and candlestick analysis. Moreover, he forecasts the market movements using his own methods based on the chaos theory. Vladimir took part in development of trading systems devoted to fractal analysis. In his free time, Vladimir blogs about exchange markets. Hobbies: active leisure, sporting shooting, cars, design, and marketing. "I do not dream only of becoming the best in my field. I also dream about those who I will take with me along the way up." Sebastian Seliga  Sebastian Seliga was born on 13th Oсtober 1978 in Poland. He graduated in 2005 with MA in Social Psychology. He has worked for leading financial companies in Poland where he actively traded on NYSE, AMEX and NASDAQ exchanges. Sebastian started Forex trading in 2009 and mastered Elliott Wave Principle approach to the markets by developing and implementing his own trading strategies of Forex analysis. Since 2012, he has been writing analitical reviews based on EWP for blogs and for Forex websites and forums. He has developed several on-line projects devoted to Forex trading and investments. He is interested in slow cooking, stand-up comedy, guitar playing, reading and swimming. "Every battle is won before it is ever fought", Sun Tzu Sebastian Seliga was born on 13th Oсtober 1978 in Poland. He graduated in 2005 with MA in Social Psychology. He has worked for leading financial companies in Poland where he actively traded on NYSE, AMEX and NASDAQ exchanges. Sebastian started Forex trading in 2009 and mastered Elliott Wave Principle approach to the markets by developing and implementing his own trading strategies of Forex analysis. Since 2012, he has been writing analitical reviews based on EWP for blogs and for Forex websites and forums. He has developed several on-line projects devoted to Forex trading and investments. He is interested in slow cooking, stand-up comedy, guitar playing, reading and swimming. "Every battle is won before it is ever fought", Sun Tzu Sergey Belyaev  Born December 1, 1955. In 1993 graduated from Air Force Engineering Academy. In September 1999 started to study Forex markets. Since 2002 has been reading lectures on the technical analysis . Is fond of research work. Created a personal trading system based on the indicator analysis. Authored the book on technical analysis "Calculation of the next candlestick". At present the next book is being prepared for publishing "Indicator Analysis of Forex Market. Trading System Encyclopedia". Has created eleven courses on indicator analysis. Uses classical indicators. Works as a public lecturer. Held numerous seminars and workshops presented at international exhibitions of financial markets industry. Is known as one of the best specialists in the Russian Federation researching indicator analysis. Born December 1, 1955. In 1993 graduated from Air Force Engineering Academy. In September 1999 started to study Forex markets. Since 2002 has been reading lectures on the technical analysis . Is fond of research work. Created a personal trading system based on the indicator analysis. Authored the book on technical analysis "Calculation of the next candlestick". At present the next book is being prepared for publishing "Indicator Analysis of Forex Market. Trading System Encyclopedia". Has created eleven courses on indicator analysis. Uses classical indicators. Works as a public lecturer. Held numerous seminars and workshops presented at international exhibitions of financial markets industry. Is known as one of the best specialists in the Russian Federation researching indicator analysis. Torben Melsted  Born in November 1962. Graduated from CBS, got Diploma in Finance. Began trading on Forex in 1986 and since that time held various positions such as advising clients, hedging client flows on FX and commodity markets. Also worked for major corporations as Financial Risk Manager. Uses Elliott wave analysis in combination with classic technical analysis, and has been using a Calmar Ratio of 5.0 for over 3 years. Has his own blog, where he uses Elliott wave and technical analysis on all financial markets. Born in November 1962. Graduated from CBS, got Diploma in Finance. Began trading on Forex in 1986 and since that time held various positions such as advising clients, hedging client flows on FX and commodity markets. Also worked for major corporations as Financial Risk Manager. Uses Elliott wave analysis in combination with classic technical analysis, and has been using a Calmar Ratio of 5.0 for over 3 years. Has his own blog, where he uses Elliott wave and technical analysis on all financial markets. Grigory Sokolov  Born 1 January, 1986. In 2008 graduated from Kiev Institute of Business and Technology with "Finance and Credit" as a major. Since 2008 has studied the behavior of various currency pairs and their correlation on Forex. In his works and trading practice he uses candlestick analysis and Fibonacci technique. Since 2009 has written analytical reviews and articles which are published on popular Internet resources. Interests: music, computers and cookery. "Out of five deadly sins of business and as a rule, the most widespread, excessive striving to get profit is the worst". P. Drucker Born 1 January, 1986. In 2008 graduated from Kiev Institute of Business and Technology with "Finance and Credit" as a major. Since 2008 has studied the behavior of various currency pairs and their correlation on Forex. In his works and trading practice he uses candlestick analysis and Fibonacci technique. Since 2009 has written analytical reviews and articles which are published on popular Internet resources. Interests: music, computers and cookery. "Out of five deadly sins of business and as a rule, the most widespread, excessive striving to get profit is the worst". P. Drucker Pavel Vlasov  No data No data Vyacheslav Ognev  Vyacheslav was born on August 24, 1971. In 1993, he graduated from Urals State University of Economics in the Russian city of Ekaterinburg holding a degree in Commerce and Economics of Trade. In 2007, he started concentrating on the Russian stock market, trading stocks on the RTS Stock Exchange and futures contracts on FORTS. Since 2008 he has been engaged in analyzing Forex market and trading currencies. He is an author of a simplified wave analysis method. He has also developed a trading strategy. At present, Vyacheslav is a co-author of training materials on two web portals dedicated to Forex trading education. Interests: fitness, F1 "Experience is the best of schoolmasters, only the school fees are heavy." - Thomas Carlyle Vyacheslav was born on August 24, 1971. In 1993, he graduated from Urals State University of Economics in the Russian city of Ekaterinburg holding a degree in Commerce and Economics of Trade. In 2007, he started concentrating on the Russian stock market, trading stocks on the RTS Stock Exchange and futures contracts on FORTS. Since 2008 he has been engaged in analyzing Forex market and trading currencies. He is an author of a simplified wave analysis method. He has also developed a trading strategy. At present, Vyacheslav is a co-author of training materials on two web portals dedicated to Forex trading education. Interests: fitness, F1 "Experience is the best of schoolmasters, only the school fees are heavy." - Thomas Carlyle Mourad El Keddani  Was born in Oujda, Morocco. Currently lives in Belgium. In 2003 obtained B.S. in Experimental Sciences. In 2007 obtained a graduate diploma at Institut Marocain Specialise en Informatique Applique (IMSIA), specialty – Software Engineering Analyst. In 2007–2009 worked as teacher of computer services and trainer in a professional school specializing in computer technologies and accounting. In 2005 started Forex trading. Authored articles and analytical reviews on Forex market on Forex websites and forums. Since 2008 performs Forex market research, and develops and implements his own trading strategies of Forex analysis (especially in Forex Research & Analysis, Currency Forecast, and Recommendations and Analysis) that lies in: Numerical analysis: Probabilities, equations and techniques of applying Fibonacci levels. Classical analysis: Breakout strategy and trend indicators. Uses obtained skills to manage traders' accounts since 2009. In April 2009 was certified Financial Technician by the International Federation of Technical Analysts. Winner of several social work awards: Education Literacy and Non-Formal Education (in Literacy and Adult Education in The National Initiative for Human Development). Was born in Oujda, Morocco. Currently lives in Belgium. In 2003 obtained B.S. in Experimental Sciences. In 2007 obtained a graduate diploma at Institut Marocain Specialise en Informatique Applique (IMSIA), specialty – Software Engineering Analyst. In 2007–2009 worked as teacher of computer services and trainer in a professional school specializing in computer technologies and accounting. In 2005 started Forex trading. Authored articles and analytical reviews on Forex market on Forex websites and forums. Since 2008 performs Forex market research, and develops and implements his own trading strategies of Forex analysis (especially in Forex Research & Analysis, Currency Forecast, and Recommendations and Analysis) that lies in: Numerical analysis: Probabilities, equations and techniques of applying Fibonacci levels. Classical analysis: Breakout strategy and trend indicators. Uses obtained skills to manage traders' accounts since 2009. In April 2009 was certified Financial Technician by the International Federation of Technical Analysts. Winner of several social work awards: Education Literacy and Non-Formal Education (in Literacy and Adult Education in The National Initiative for Human Development).
Languages: Arabic, English, French and Dutch.
Interests: Algorithm, Graphics, Social work, Psychology and Philosophy.
Subscription's options management Theme's:
Fundamental analysis, Fractal analysis, Wave analysis, Technical analysis, Stock Markets
Author's :
A Zotova, Aleksey Almazov, Alexander Dneprovskiy, Alexandr Davidov, Alexandros Yfantis, Andrey Shevchenko, Arief Makmur, Dean Leo, Evgeny Klimov, Fedor Pavlov, Grigory Sokolov, I Belozerov, Igor Kovalyov, Irina Manzenko, Ivan Aleksandrov, l Kolesnikova, Maxim Magdalinin, Mihail Makarov, Mohamed Samy, Mourad El Keddani, Oleg Khmelevskiy, Oscar Ton, Pavel Vlasov, Petar Jacimovic, R Agafonov, S Doronina, Sebastian Seliga, Sergey Belyaev, Sergey Mityukov, Stanislav Polyanskiy, T Strelkova, Torben Melsted, V Isakov, Viktor Vasilevsky, Vladislav Tukhmenev, Vyacheslav Ognev, Yuriy Zaycev, Zhizhko Nadezhda
Edit data of subscription settings
Unsubscribe from the mailing list Sincerely,
Analysts Service | If you have any questions, you can make a phone call using one of the
InstaForex Toll free numbers right now:
|  | InstaForex Group is an international brand providing online trading services to the clients all over the world. InstaForex Group members include regulated companies in Europe, Russia and British Virgin Islands. This letter may contain personal information for access to your InstaForex trading account, so for the purpose of safety it is recommended to delete this data from the history. If you have received this letter by mistake, please contact InstaForex Customer Relations Department. |


No comments:
Post a Comment