| EUR/USD: plan for the European session on December 8. COT reports. Euro buyers did not reach new highs. Bullish trend on pause 2020-12-08 To open long positions on EUR/USD, you need: In yesterday's forecast, I drew attention to the 1.2111 level and said that as long as trading is conducted below this range, we can expect the euro to continue falling. I marked an area on the 5-minute chart where bears were actively defending their positions, forming false breakouts from the resistance at 1.2111, but this did not lead to anything good. As a result, the breakout and consolidation at 1.2111 caused EUR/USD to rise in the afternoon. Unfortunately, I did not wait until the 1.2111 level has been tested from top to bottom in order to produce a convenient entry point, so I missed this, as well as being able to sell in the morning. 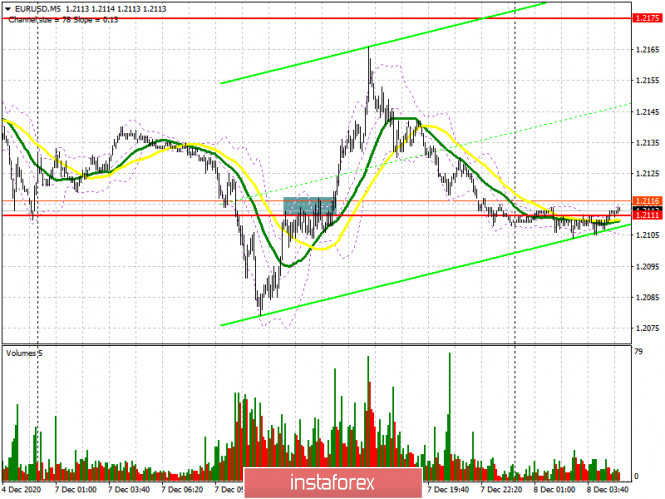
I didn't really review much at the moment. The 1.2111 level has slightly changed, which became 1.2116. I will focus on it in the morning. Buyers of the euro need to do their best to regain resistance at 1.2116, and they know how to do it. Yesterday's breakdown of 1.2111 was proof of this. Testing this level from the bottom up after the breakout produces a good signal to open long positions. The main goal is to return to last week's highs in the 1.2175 area, which has already been tested for strength twice. The fact that the bulls did not update this level yesterday jeopardizes the upward trend. Therefore, testing 1.2175 for the third time will lead to its breakout and EUR/USD will rise to highs of 1.2255 and 1.2339, where I recommend taking profit. In the absence of bullish activity in the 1.2116 area and we receive weak fundamental data from the ZEW institute for Germany and the eurozone, it is best not to rush into long deals, but wait until the 1.2046 low has been updated. You can buy the euro on a rebound from this level, counting on a correction of 20-25 points within the day. A larger support level is seen around 1.1986. Testing this low will lead to a reversal of the upward trend in the short term. To open short positions on EUR/USD, you need: News that there is still a chance for a Brexit trade deal has made it possible for the bulls to regain their positions following a huge drop earlier in the day. At the moment, the pound sellers are focused on the 1.2116 level, which they need to protect. Forming a false breakout there in the first half of the day after receiving weak data on the index of business sentiment in Germany and the eurozone from the ZEW institute and the index of the current situation from the ZEW institute will be a signal to open short positions in sustaining the downward correction to the area of a low of 1.2046, where I recommend taking profit... Getting the pair to settle below this level and testing it from the bottom up will be a good signal to sell EUR/USD to the area of a large low at 1.1986, and the bears hope to be close to the support area of 1.1923, which will seriously affect the upward trend. If EUR/USD rises above the resistance of 1.2116, it is better not to rush to sell. In this scenario, you can only rely on short positions from the resistance of 1.2175, or sell EUR/USD from a new high of 1.2255, counting on a downward correction of 15-20 points within the day. 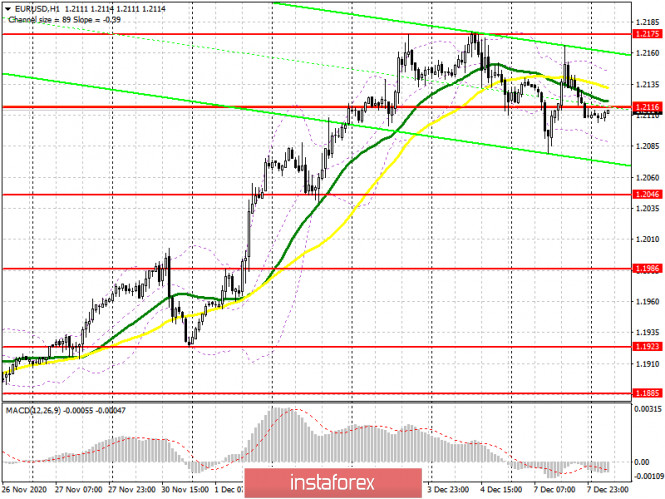
The Commitment of Traders (COT) report for December 1 showed an increase in long positions and a reduction in short positions. Buyers of risky assets believe that the bull market will continue and they also anticipate the euro's growth, after going beyond the psychological mark in the area of the 20th figure. Thus, long non-commercial positions rose from 206,354 to 207,302, while short non-commercial positions fell to 67,407 from 68,104. The total non-commercial net position rose to 139,894 from 138,250 a week earlier. Take note of the delta's growth after its 8-week decline, which indicates a clear advantage of buyers and a possible resumption of the medium-term upward trend for the euro. We can only talk about an even bigger recovery when European leaders have negotiated a new trade deal with Britain. However, we did not receive good news last week, and we have an EU summit ahead of us, which could put the final point in this story. News that restrictive measures will be lifted for the Christmas holidays can provide support to the euro, as well as the absence of major changes in the ECB's monetary policy. Indicator signals: Moving averages Trading is carried out in the area of 30 and 50 moving averages, which indicates the struggle of euro buyers to maintain control over the market. Note: The period and prices of moving averages are considered by the author on the H1 hourly chart and differs from the general definition of the classic daily moving averages on the daily D1 chart. Bollinger Bands A breakout of the upper border of the indicator in the 1.2150 area will lead to a new wave of euro growth. A breakout of the lower boundary at 1.2080 will increase pressure on the pair. Description of indicators - Moving average (moving average, determines the current trend by smoothing out volatility and noise). Period 50. It is marked in yellow on the chart.
- Moving average (moving average, determines the current trend by smoothing out volatility and noise). Period 30. It is marked in green on the chart.
- MACD indicator (Moving Average Convergence/Divergence — convergence/divergence of moving averages) Quick EMA period 12. Slow EMA period to 26. SMA period 9
- Bollinger Bands (Bollinger Bands). Period 20
- Non-commercial speculative traders, such as individual traders, hedge funds, and large institutions that use the futures market for speculative purposes and meet certain requirements.
- Long non-commercial positions represent the total long open position of non-commercial traders.
- Short non-commercial positions represent the total short open position of non-commercial traders.
- Total non-commercial net position is the difference between short and long positions of non-commercial traders.
GBP/USD: plan for the European session on December 8. COT reports. Pound buyers rely on Boris Johnson. Expect high volatility 2020-12-08 To open long positions on GBP/USD, you need: Pound buyers were in control in the afternoon after receiving news that British Prime Minister Boris Johnson would hold talks with European Commission President Ursula von der Leyen. This is the last chance to conclude a trade deal between the UK and the EU. Against this background, the pound strengthened and several interesting signals to enter the market appeared. Let's take a look at the 5-minute chart and break them down. In yesterday's review, I advised you to open long positions after forming a false breakout in the support area of 1.3246, which happened. But if you missed this entry point, you could always enter buy positions after the breakout and when the pair has settled above the resistance level of 1.3290, where a good entry for long deals appeared. A similar update of resistance at 1.3340 and testing it top to bottom resulted in another buy signal. There was no point in selling from these levels, since buyers immediately broke through these areas on its initial test. 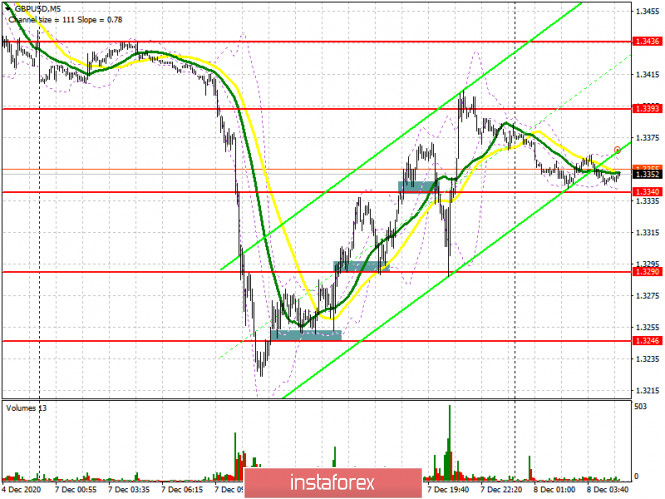
Buyers currently need to maintain their control over the 1.3340 level. Forming a false breakout there in the first half of the day will be an excellent signal to open long positions in hopes for the pound to rise in the short term. The main target will be a breakout and getting the pair to settle above resistance at 1.3381, testing it from top to bottom, similar to yesterday's purchases, produces a convenient entry point for sustaining the pound's growth in order for it to reach a high of 1.3433, where I recommend taking profits. The next goal will be resistances 1.3483 and 1.3534, but they will be available only if we receive good news regarding the outcome of the Brexit trade talks. In case bulls are not active in the support area of 1.3340, it is best not to rush to buy, but wait for a downward correction to the area of the 1.3290 low, where you can try to catch hold of the market, counting on a 20-30 point correction within the day. A larger support level is still at 1.3246, where you can also buy GBP/USD immediately on a rebound, counting on a correction of 20-30 points. To open short positions on GBP/USD, you need: Pound sellers retreated from the market again amid rumors that Boris Johnson may make a number of concessions at the last moment in order to conclude a trade deal with the EU. The initial goal is to protect resistance at 1.3381, where forming a false breakout will return pressure to the pair and result in updating the 1.3340 low. The next goal is to form a breakout and get the pair to settle below 1.3340. Testing this level from the bottom up produces a good signal to sell the pound in hopes for it to fall to the 1.3290 and 1.3246 areas, where I recommend taking profits. Bad news on the trade deal will pull down GBP/USD to the 1.3194 and 1.3114 lows. If the bulls manage to regain the 1.3381 level, then it is better not to rush with short positions. The optimal scenario for selling the pound is when the pair fails to settle above 1.3433. I recommend opening short positions immediately on a rebound from the high of 1.3483, counting on a downward correction of 25-30 points within the day. Since we will not receive any news regarding the UK economy today, focus will shift to Brexit. 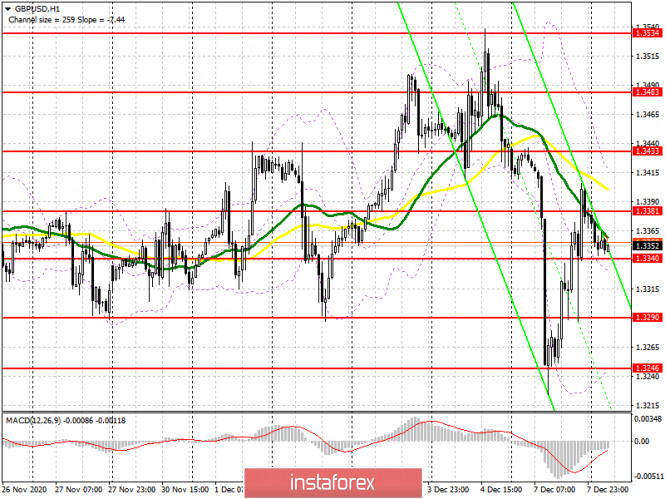
The Commitment of Traders (COT) reports for November 24 indicates significant interest in the pound, as many traders hoped that the Brexit deal would be finalized. Long non-commercial positions rose from 30,838 to 37,087. At the same time, short non-commercial positions decreased from 47,968 to 44,986. As a result, the negative non-commercial net position was -7,899 against -17,130 a week earlier. This indicates that sellers of the British pound retain control and it also shows their slight advantage in the current situation, but the market is beginning to gradually come back to risks, and reaching a trade deal will help it in this. Indicator signals: Moving averages Trading is carried out just above 30 and 50 moving averages, which indicates an attempt by the bulls to resume the growth of the British pound. Note: The period and prices of moving averages are considered by the author on the H1 hourly chart and differs from the general definition of the classic daily moving averages on the daily D1 chart. Bollinger Bands Growth will be limited by the upper level of the indicator around 1.315. A break of the middle border of the indicator in the 1.3340 area will increase pressure by the pound. Description of indicators - Moving average (moving average, determines the current trend by smoothing out volatility and noise). Period 50. It is marked in yellow on the chart.
- Moving average (moving average, determines the current trend by smoothing out volatility and noise). Period 30. It is marked in green on the chart.
- MACD indicator (Moving Average Convergence/Divergence — convergence/divergence of moving averages) Quick EMA period 12. Slow EMA period to 26. SMA period 9
- Bollinger Bands (Bollinger Bands). Period 20
- Non-commercial speculative traders, such as individual traders, hedge funds, and large institutions that use the futures market for speculative purposes and meet certain requirements.
- Long non-commercial positions represent the total long open position of non-commercial traders.
- Short non-commercial positions represent the total short open position of non-commercial traders.
- Total non-commercial net position is the difference between short and long positions of non-commercial traders.
Technical Analysis of EUR/USD for December 8, 2020 2020-12-08 Technical Market Outlook: The EUR/USD pair made a Shooting Star candlestick pattern around the level of 1.2163 and was pushed back into the acceleration channel. The local low wad made at the level of 1.2078, just below the intraday technical support seen at 1.2088. Any violation of the lower acceleration channel line will be bearish, so the market participants should keep an eye on the level of 1.2000 again. Please notice, the momentum is now hovering around the neutral level of fifty and the market is coming of the overbought conditions. Weekly Pivot Points: WR3 - 1.2496 WR2 - 1.2335 WR1 - 1.2244 Weekly Pivot - 1.2088 WS1 - 1.1996 WS2 - 1.1828 WS3 - 1.1738 Trading Recommendations: Since the middle of March 2020 the main trend is on EUR/USD pair has been up. This means any local corrections should be used to buy the dips until the key technical support is broken. The key long-term technical support is seen at the level of 1.1609. The key long-term technical resistance is seen at the level of 1.2555. 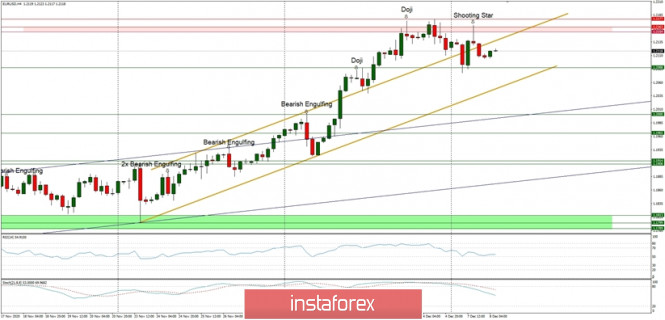
Technical Analysis of GBP/USD for December 8, 2020 2020-12-08 Technical Market Outlook: The GBP/USD pair has made a new local high at the level of 1.3537, but was capped at the end of the rally and a Bearish Engulfing candlestick pattern was made at the H4 time frame chart. The market dropped towards the key technical support located at the level of 1.3240 and bounced slightly. Nevertheless, this situation is only temporary and there is no indication of the up trend termination yet. The nearest technical support is located at 1.3240 and 1.3264. The strong and positive momentum supports the short-term bullish outlook, so only if the demand zone located between the levels of 1.3264 - 1.3240 is clearly violated, then the outlook will change to bearish. Weekly Pivot Points: WR3 - 1.3800 WR2 - 1.3667 WR1 - 1.3552 Weekly Pivot - 1.3410 WS1 - 1.3307 WS2 - 1.3172 WS3 - 1.3057 Trading Recommendations: The GBP/USD pair is in the down trend on the monthly time frame, but the recent bounce from the low at 1.1411 made in the middle of March 2020 looks very strong and might be a reversal swing. In order to confirm the trend change, the bulls have to break through the technical resistance seen at the level of 1.3518. All the local corrections should be used to enter a buy orders as long as the level of 1.2674 is not broken. 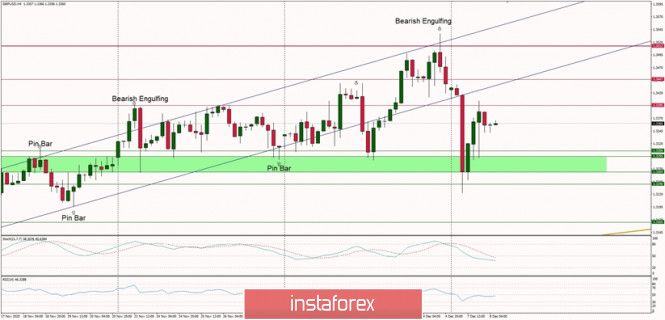
Elliott wave analysis of EUR/JPY for December 8, 2020 2020-12-08 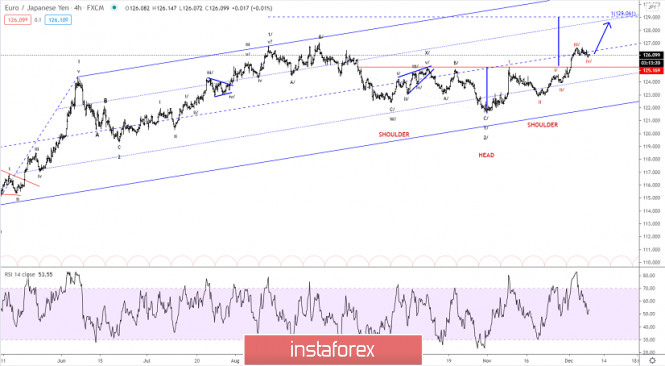
The consolidation in red wave iv/ is likely complete or very close to being complete and red wave v/ higher to 127.30 should be expected short-term. A break above minor resistance at 126.48 will confirm the rally in red wave v/ to 127.30 as the first minor upside target. If a break above 127.30 is seen the next target in play will be 127.75 and finally 128.21 to complete red wave v/ and red wave iii. Support is seen at 125.92. R3: 127.75 R2: 127.30 R1: 126.66 Pivot: 126.48 S1: 125.92 S2: 125.61 S3: 125.34 Trading recommendation: We are long EUR from 123.43 with our stop placed at 125.50 Technical analysis of EUR/USD for December 8, 2020 2020-12-08 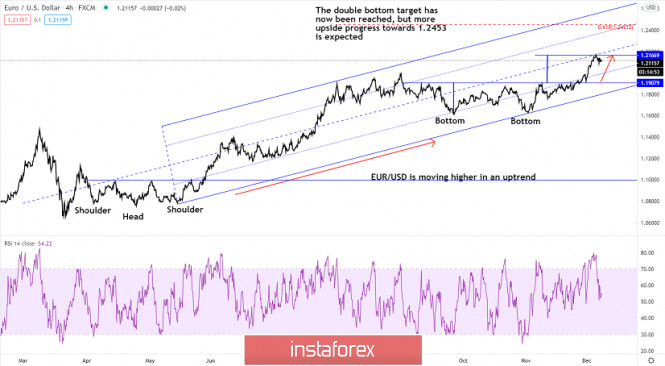
We have been following EUR/USD for a while now and has been looking for a rally towards the double bottom target 1.2167. This target has now been hit, but does that secure a top is in place and a decline should be expected? NO! the uptrend can continue higher towards the next upside target at 1.2300 and the ideal 1.2453 target. Short-term support is seen at 1.2083 with long-term important support at 1.1934. Remember that the trend and patience are your friends. AUD/USD. Main upward target is the level of 0.7470 2020-12-08 The AUD/USD pair moved within the 0.74 mark, finally consolidating in this price area. Buyers of this pair have been trying to reach this price level since November, but the pair attracted sellers upon breaking the level of 0.7400, as a result of which the price returned each time. However, last week's fundamental outlook was in favor of the AUD, while the USD was still showing its weakness. The combination of these factors allowed the pair's bulls to enter the area of the level of 0.74 and take a wait-and-see position. Bears' attempt yesterday to pull the price back below 0.7400 was unsuccessful. So, while the US dollar had a temporary strengthening, the Australian dollar regained its lost positions this afternoon. 
In general, the pair has been showing an upward trend over the past few weeks (in particular, since mid-November), together with deeper corrective pullbacks to allow traders to buy again at a better price. Moreover, the growth of the AUD/USD pair is not only due to the weakness of the US dollar, as the Australian one has its own arguments for revaluation. This is an important fact that allows the AUD to contain the attack of the AUD/USD bears, during the US dollar's temporary strength. Yesterday's price dynamics served as a good example. On one hand, we have the Australian and macroeconomic statistics, RBA's wait-and-see attitude, the favorable situation with the COVID-19 in the country, as well as the general interest of the currency market in risky assets. On the other hand, we have the Australian-Chinese political conflict and RBA's head, Philip Lowe's cautious rhetoric. For example, remarkable data on Australia's economic growth was published last week. In quarterly terms, the country's GDP in Q3 increased from -7% to 3.3%. This indicator has grown at the fastest pace in the last 44 years. At the same time, the largest state in the country (Victoria) was in a strict lockdown during this period. If this region were also operating, then the volume of Australia's GDP would increase by approximately 5%. Moreover, there was quite good data on the labor market published a little earlier. Australian inflation did not disappoint either: the main indicators came out either at the level of forecasts, or exceeded the forecast values. In other words, key macroeconomic reports favored the Australian dollar, providing background support to it. It is also worth noting the fact that the Reserve Bank of Australia confirmed its wait-and-see position during its last meeting this year, while excluding the option of reducing the interest rate to the negative area. However, RBA's head Philip Lowe, who speaks too cautious rhetoric, acts as a kind of a barrier for the impulsive growth of the AUD/USD pair. In particular, he repeated his main arguments yesterday, which he had already reiterated earlier. In particular, Lowe paid attention to weak wage growth, high underemployment and weak inflation dynamics. In light of these circumstances, he allowed the expansion of the incentive program next year. Nevertheless, such threats do not allow the pair's bulls to show their full character, at least in regards with impulse attack to the level of 0.75. AUD/USD buyers have to cooperate, while attempting to reach the unyielding resistance level of 0.7470. The Australian-Chinese conflict, which is fading and then flaring up with renewed strength, is also one of the factors which limits the growth of the Australian dollar. For example, a Chinese Foreign Ministry official tweeted a fake photo of an Australian soldier threatening an Afghan child with a knife in late November. There was another scandal, but it quickly faded. Moreover, Australian Prime Minister Scott Morrison suddenly expressed his intention to establish constructive contacts with China, emphasizing that relations with Beijing on the basis of mutual benefit will help both countries. 
In general, if this political conflict is considered in the context of the AUD/USD prospects, then it is necessary first to monitor Beijing's attitude to Australian iron ore – China buys about 65% of the iron ore and about two-thirds of this comes from Australia. At the same time, the export of these raw materials from Australia in the last fiscal year amounted to more than 100 billion Australian dollars, which is about half of the total value of all commodity exports.In other words, this is a very sensitive issue for the Australian dollar. But despite all the heated tension, China does not use this lever as a tool for political pressure. And as long as the status quo remains in this issue, the conflict itself will have a weak (background) pressure on the AUD/USD pair. Thus, the current fundamental background for the AUD/USD pair allows us to consider long positions on price declines. The first, and so far the main upward target is the resistance level of 0.7470 (upper line of the Bollinger Bands indicator on the daily and weekly time frames). Indicator Analysis. Daily review for the EUR/USD currency pair 12/08/20 2020-12-08 Yesterday, the pair went down and tested almost at the historical support level of 1.2073 (blue dotted line) and then went up, closing the daily candle at 1.2110. Today, the price may continue to go down according to the economic calendar news, it is expected at 10.00 UTC (Euro) and 12.00 UTC (dollar) Trend Analysis (Fig. 1). Today, the market may continue to go downward from the level of 1.2110 (yesterday's closing daily candle) with the target of 1.2073 at historical support level (blue dotted line). If this line will be tested, there will be a work going down with the target of 1.2041 at the retracement level of 23.6% (red dotted line). 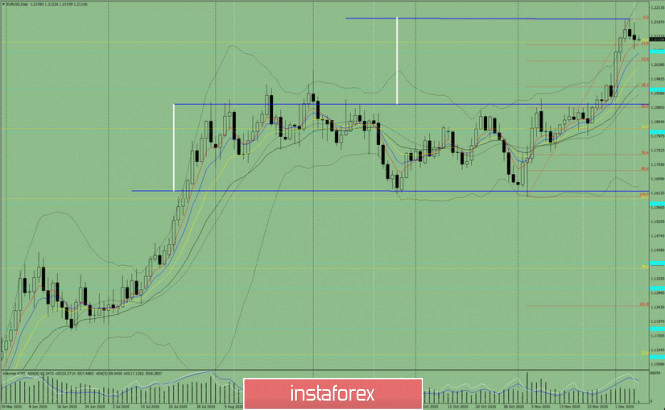
Figure 1 (daily chart). Complex Analysis: - Indicator Analysis - down
- Technical Analysis - down
General Conclusion: Today, the price may continue to go downward from the level of 1.2110 (yesterday's closing daily candle) with the target of 1.2073 at the historical support level (blue dotted line). If this line will be tested, it will continue to go down with the target of 1.2041 at the resistance level of 23.6% (red dotted line). Unlikely scenario: when working down to reach the historical support level of 1.2073 (blue dotted line), there will be a work going up with the target of 1.2102 at the rollback level of 76.4% (yellow dotted line). Trading plan for EUR/USD and GBP/USD on 12/08/2020 2020-12-08 The week began with Michel Barnier's amusing words that the chances of reaching a compromise on a trade agreement between London and Brussels are slim. In fact, the EU's main negotiator has admitted that the parties are still procrastinating, although there is not much time left. The situation was worsened by Boris Johnson's statement that he is ready to abandon further negotiations, which will make Brexit regulated with unpredictable consequences, although the consequences are generally clear – London will suffer serious economic losses. In view of this, the pound sharply declined pulling the euro along with it. So, it is not for nothing that various media outlets have recently been actively discussing the fact that the European Union will suffer enormous economic consequences if a full-fledged trade agreement is not signed, which everyone knew anyway. It is clear that Europe will suffer, but only slightly and it will recover from this very quickly. Moreover, unregulated Brexit is even beneficial for Europe in the long term. Thus, euro's weakness was purely emotional in nature. However, Boris Johnson seemed to have forgotten what he had said in the morning, as he announced his urgent trip to Brussels for personal talks with Ursula von der Leyen half a day later as well as hinting at the possibility of meeting with Angela Merkel and Emmanuel Macron. Against this background, the pound immediately recovered all its losses after being shocked with such an instant change. It was followed by the euro, but not so smartly. In general, it looks like London and Brussels are trying to provoke each other, hoping that someone will break down and make drastic concessions. After all, they are really lacking time. On Thursday, the EU summit will already start, during which the content of trade agreement with London will be considered. It turns out that the parties have only two days left, and the documents will be studied already during the summit, if it turns out at least something to agree. However, London and Brussels had several years to do this, and during this time such insignificant issues as state regulation, technical regulations and state support measures have not moved. These are fundamental questions, so progress is only possible if one of the parties suddenly gets scared and abruptly abandons its position on these issues, which will cost a lot. More so, Europe is unlikely to give up its demands, as it is well aware that its economy will most likely only benefit in the end, even if an agreement is not reached. In turn, London faces a difficult choice that it has not been able to make for many years. And all because the UK expects to achieve exceptional preferences, much greater than it had even within the European Union. In essence, the UK's position is to maintain free access to the European single market, with the ability to regulate the access of European capital to its own market. But over the course of a few years, it was still possible to learn that Brussels does not allow such a possibility. Thus, all these endless attempts to send threats/blackmail, which is getting very cheap, look extremely child-like. In any case, today and tomorrow's movement of the pound and euro will depend on Boris Johnson's diplomatic successes or failures. 
It is very clear that today's publication of Eurozone's third estimate of GDP for the third quarter will not be interesting. This is not only due to the dramatic events overshadowing it, but also because of previous estimates coinciding with it, which showed a slowdown in the rate of economic decline from -14.8% to -4.4%. Thus, investors will not see anything new, which means there is no reason for any sudden movement. Nevertheless, the data indicate a strong recovery (albeit far from being completed) in the European economy, which has been severely affected by the pandemic. GDP growth rates (Europe): 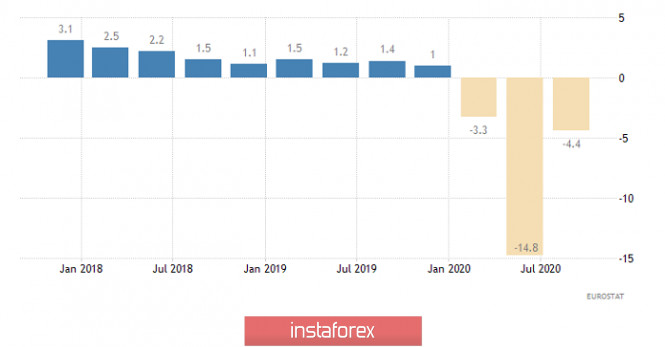
The EUR/USD pair found a resistance level located at 1.3180 during the upward trend, where there was a slowdown and as a result a flat in the range of 1.2080/1.2180. It can be assumed that the movement in a given range will continue for some time in the market, where the method of breaking a particular border is considered to be the best trading tactic. 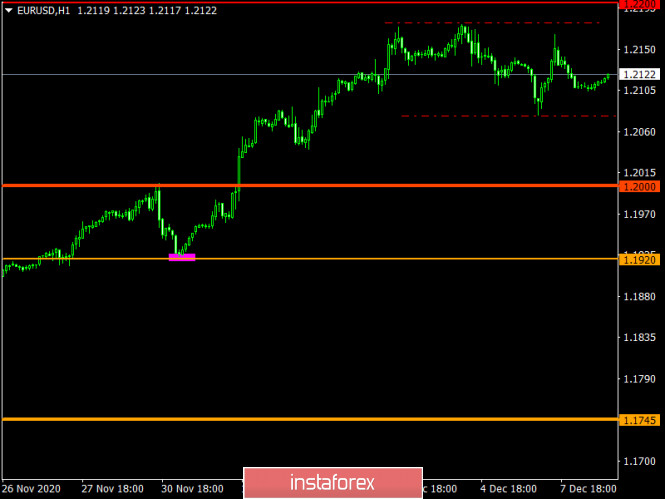
In turn, the GBP/USD pair is showing high activity, where the quote managed to locally surged by more than 200 points. The coordinates 1.3225, 1.3300, and 1.3400 are selected as the levels of price interaction with market participants. 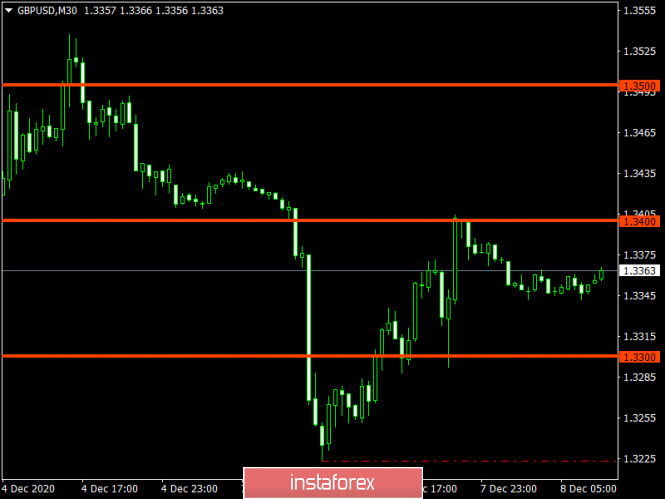
It can be assumed that speculators will continue to follow the information flow, where previously identified price levels can be broken, depending on the nature of the incoming information. Indicator analysis. Daily review on the GBP/USD currency pair on December 8, 2020 2020-12-08 Trend analysis (Fig. 1). Today, from the level of 1.3381 (closing of yesterday's daily candlestick), the market will try to continue moving downward with the target of 1.3251 - the support line (red bold line). If this level is reached, it is possible to move upward with the target of 1.3290, which is the retracement level of 76.4% (red dotted line). 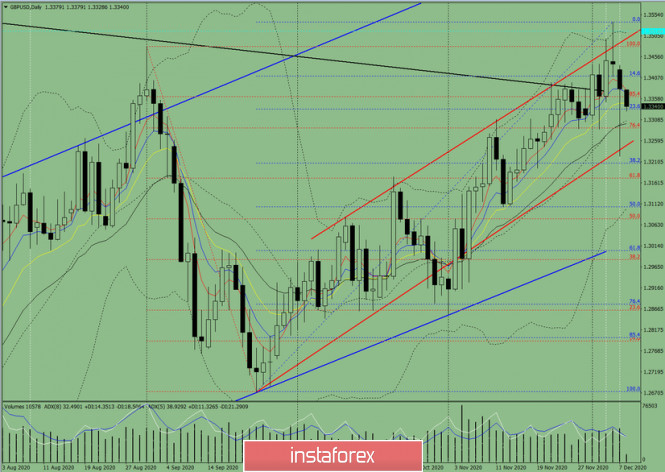
Figure 1 (Daily Chart). Comprehensive analysis: - Indicator analysis - down
- Fibonacci levels - down
- Volumes - down
- Candlestick analysis - down
- Trend analysis - down
- Bollinger bands - down
- Weekly chart - down
General conclusion: Today, from the level of 1.3381 (the closing of yesterday's daily candlestick), the price will try to continue moving downward with the target of 1.3251 - the support line (red bold line). If this level is reached, it is possible to move upward with the target of 1.3290, which is the retracement level of 76.4% (red dotted line). Unlikely scenario: A downward movement with a target of 1.3333 - 23.6% pullback level (blue dotted line). If this level is reached, an upward movement is possible with the target of 1.3361 - an 85.4% pullback level (red dotted line). Forex forecast 12/08/2020 on USD/JPY, EUR/GBP and Gold from Sebastian Seliga 2020-12-08 Let's take a look at the technical picture of Gold, USD/JPY and EUR/GBP on the daily time frame chart. GBP/USD: Boris Johnson will meet Ursula von der Leyen to discuss a post-Brexit trade deal. 2020-12-08 UK Prime Minister, Boris Johnson, is set to travel to Brussels for urgent talks with European Commission President, Ursula von der Leyen. The reason for this is that all attempts made by both UK and EU negotiators to find mutual understanding have failed, and there is simply no time for new rounds of negotiations. To add to that, Johnson said there was no talk of extending the transition period for another year. Thus, yesterday, he and von der Leyen agreed to meet in person to try to break the deadlock. 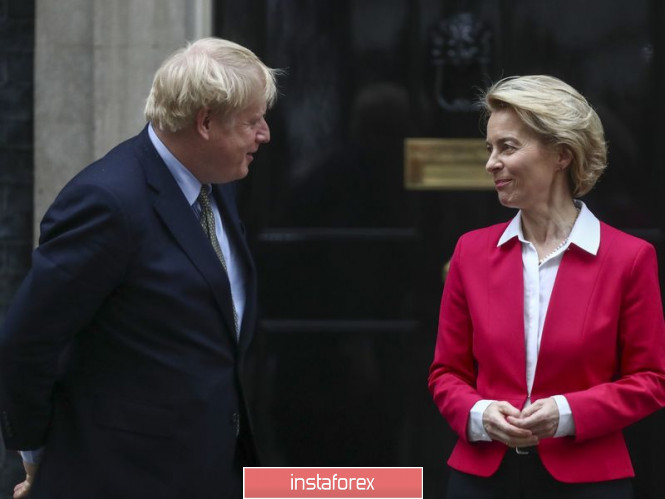 This news renewed hopes for investors, most especially since in all eight months of the negotiations, an agreement between the two countries was not made. The intervention of political leaders suggests that both parties want to conclude a deal before the final deadline on December 31, when the UK will formally leave the EU. And although the two sides still have many disagreements with each other, the chances of signing a deal will seriously increase if the issues on fishing and fair competition rules for European and British companies are resolved. However, the UK's side does not share the EU's optimism and has gloomily assessed the state of affairs, warning that negotiations could lead to failure. Rumors also surfaced that since the disagreements escalated last week, there was no tangible progress yesterday, and there is every chance that the parties will not come to an agreement until the end of Wednesday. Irish Foreign Minister, Simon Coveney, even expressed disappointment with the way the UK is behaving in the negotiations. As a result, volatility in the GBP / USD pair has decreased, and the market became in favor of the bears. Since yesterday, they have been trying to bring the quote to 1.3340, a breakout of which will lead to the pound's collapse to 1.2390 and 1.3220 areas. But if the bulls regain control of the market and the quote moves above 1.3380, the pair will be able to reach 1.3440 and 1.3490. EUR / USD Quite an interesting report was published yesterday, which indicated that the trajectory of the global public debt is unlikely to change after the current crisis. At the moment, its value is approaching a record 100% of GDP, and this may pull economic forecasts into negative territories. Even if the central banks of different countries reduce the cost of government spending (compared to pre-crisis levels), there is still the issue of growing national debt. Modifying monetary policies also does not entail a reassessment of risks. One risk that excessive global debt produces is uneven economic recovery. Thus, even though Scope Ratings said the global economy could recover by about 5.4% in 2021, it will be uneven due to the current massive world public debt. Nonetheless, huge economic growth, about 9.9%, will be seen in China in 2021, while the US, on the other hand, is unlikely to see a rise above 4%. In the eurozone, more active growth is expected in the region of 5.6%. A more active economic recovery means more demand for risky assets and, accordingly, a decline in the US dollar. The widespread availability of COVID-19 vaccines will also make the US dollar weaker, in addition to the adoption of a massive US stimulus package. If the US government adopts the recently-proposed $ 900 billion package, tax will increase in the future, as will the cost of national debt. In another note, COVID-19 continues to rage in the United States. It seems that the authorities are not showing much concern to the statistics, which could result to the US taking much longer to recover from the virus. 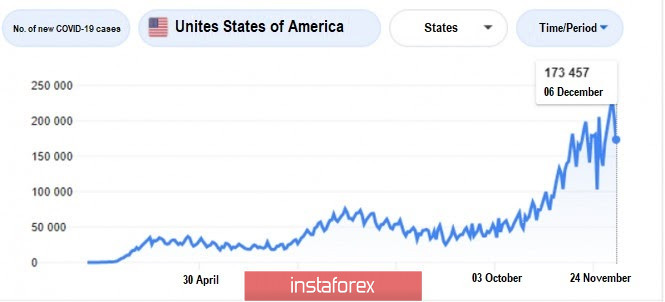 Meanwhile, the strong growth of the euro is a serious problem for the European Central Bank. It may attempt to verbally intervene against it soon, however, the bank's rhetoric alone will not be enough to deter investors, especially those who count on the strengthening of risky assets. The maximum that the ECB will manage is to delay growth and achieve a return to the area of the 19th figure. The ECB may also make significant policy changes, which will lead to the return of pressure on the European currency. Such a scenario will bring the quote to levels 1.1840 and 1.1790, but a break above 1.2175 will lead to a rise towards 1.2260 and 12340. With regards to economic reports, the Conference Board published data on US employment, which indicated that the employment trend index rose in November, but the pace of job creation is slowing. This is not surprising in light of the latest figures from the US Department of Labor. The index, as calculated by the Conference Board, amounted to 98.81 points in November, against the October value of 98.32 points. Last Friday, the US Department of Labor reported that only 245,000 jobs were created in November.
Author's today's articles: Maxim Magdalinin  In 2005 graduated from the Academy of the Ministry of Internal Affairs of the Republic of Belarus, law faculty. Worked as a lawyer for three years in one of the biggest country's company. Besides the trading, he develops trading systems, writes articles and analytical reviews. Works at stock and commodity markets explorations. On Forex since 2006. In 2005 graduated from the Academy of the Ministry of Internal Affairs of the Republic of Belarus, law faculty. Worked as a lawyer for three years in one of the biggest country's company. Besides the trading, he develops trading systems, writes articles and analytical reviews. Works at stock and commodity markets explorations. On Forex since 2006. Sebastian Seliga  Sebastian Seliga was born on 13th Oсtober 1978 in Poland. He graduated in 2005 with MA in Social Psychology. He has worked for leading financial companies in Poland where he actively traded on NYSE, AMEX and NASDAQ exchanges. Sebastian started Forex trading in 2009 and mastered Elliott Wave Principle approach to the markets by developing and implementing his own trading strategies of Forex analysis. Since 2012, he has been writing analitical reviews based on EWP for blogs and for Forex websites and forums. He has developed several on-line projects devoted to Forex trading and investments. He is interested in slow cooking, stand-up comedy, guitar playing, reading and swimming. "Every battle is won before it is ever fought", Sun Tzu Sebastian Seliga was born on 13th Oсtober 1978 in Poland. He graduated in 2005 with MA in Social Psychology. He has worked for leading financial companies in Poland where he actively traded on NYSE, AMEX and NASDAQ exchanges. Sebastian started Forex trading in 2009 and mastered Elliott Wave Principle approach to the markets by developing and implementing his own trading strategies of Forex analysis. Since 2012, he has been writing analitical reviews based on EWP for blogs and for Forex websites and forums. He has developed several on-line projects devoted to Forex trading and investments. He is interested in slow cooking, stand-up comedy, guitar playing, reading and swimming. "Every battle is won before it is ever fought", Sun Tzu Torben Melsted  Born in November 1962. Graduated from CBS, got Diploma in Finance. Began trading on Forex in 1986 and since that time held various positions such as advising clients, hedging client flows on FX and commodity markets. Also worked for major corporations as Financial Risk Manager. Uses Elliott wave analysis in combination with classic technical analysis, and has been using a Calmar Ratio of 5.0 for over 3 years. Has his own blog, where he uses Elliott wave and technical analysis on all financial markets. Born in November 1962. Graduated from CBS, got Diploma in Finance. Began trading on Forex in 1986 and since that time held various positions such as advising clients, hedging client flows on FX and commodity markets. Also worked for major corporations as Financial Risk Manager. Uses Elliott wave analysis in combination with classic technical analysis, and has been using a Calmar Ratio of 5.0 for over 3 years. Has his own blog, where he uses Elliott wave and technical analysis on all financial markets. Irina Manzenko  Irina Manzenko Irina Manzenko Sergey Belyaev  Born December 1, 1955. In 1993 graduated from Air Force Engineering Academy. In September 1999 started to study Forex markets. Since 2002 has been reading lectures on the technical analysis . Is fond of research work. Created a personal trading system based on the indicator analysis. Authored the book on technical analysis "Calculation of the next candlestick". At present the next book is being prepared for publishing "Indicator Analysis of Forex Market. Trading System Encyclopedia". Has created eleven courses on indicator analysis. Uses classical indicators. Works as a public lecturer. Held numerous seminars and workshops presented at international exhibitions of financial markets industry. Is known as one of the best specialists in the Russian Federation researching indicator analysis. Born December 1, 1955. In 1993 graduated from Air Force Engineering Academy. In September 1999 started to study Forex markets. Since 2002 has been reading lectures on the technical analysis . Is fond of research work. Created a personal trading system based on the indicator analysis. Authored the book on technical analysis "Calculation of the next candlestick". At present the next book is being prepared for publishing "Indicator Analysis of Forex Market. Trading System Encyclopedia". Has created eleven courses on indicator analysis. Uses classical indicators. Works as a public lecturer. Held numerous seminars and workshops presented at international exhibitions of financial markets industry. Is known as one of the best specialists in the Russian Federation researching indicator analysis. Alexandr Davidov  No data No data Pavel Vlasov  No data No data
Subscription's options management Theme's:
Fundamental analysis, Fractal analysis, Wave analysis, Technical analysis, Stock Markets
Author's :
A Zotova, Aleksey Almazov, Alexander Dneprovskiy, Alexandr Davidov, Alexandros Yfantis, Andrey Shevchenko, Arief Makmur, Dean Leo, Evgeny Klimov, Fedor Pavlov, Grigory Sokolov, I Belozerov, Igor Kovalyov, Irina Manzenko, Ivan Aleksandrov, l Kolesnikova, Maxim Magdalinin, Mihail Makarov, Mohamed Samy, Mourad El Keddani, Oleg Khmelevskiy, Oscar Ton, Pavel Vlasov, Petar Jacimovic, R Agafonov, S Doronina, Sebastian Seliga, Sergey Belyaev, Sergey Mityukov, Stanislav Polyanskiy, T Strelkova, Torben Melsted, V Isakov, Viktor Vasilevsky, Vladislav Tukhmenev, Vyacheslav Ognev, Yuriy Zaycev, Zhizhko Nadezhda
Edit data of subscription settings
Unsubscribe from the mailing list Sincerely,
Analysts Service | If you have any questions, you can make a phone call using one of the
InstaForex Toll free numbers right now:
|  | InstaForex Group is an international brand providing online trading services to the clients all over the world. InstaForex Group members include regulated companies in Europe, Russia and British Virgin Islands. This letter may contain personal information for access to your InstaForex trading account, so for the purpose of safety it is recommended to delete this data from the history. If you have received this letter by mistake, please contact InstaForex Customer Relations Department. |


No comments:
Post a Comment