| Trading plan for the EUR/USD pair on December 8. Euro rally halted ahead of the ECB meeting this week. 2020-12-08 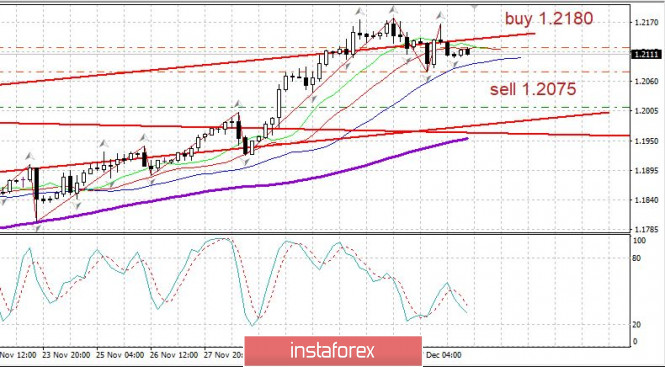
EUR / USD - the euro stopped growing ahead of the ECB meeting this week. This is because the decisions during it may cause the euro to turn down, but then such a scenario will provide new impetus for growth in the EUR / USD pair. Continue setting up long positions from 1.2000 upwards, but place stop and be ready for a pullback from 1.2077. Longs may also be opened from 1.2180. 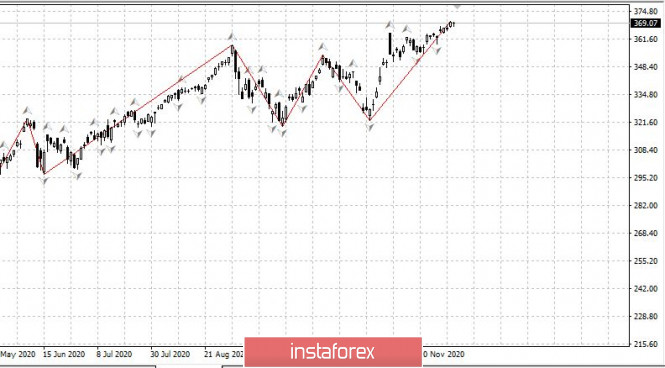
The US market wants to grow, but for that to happen, a strong push is needed, which may come from the adoption of the $ 900 billion bailout package. In this regard, it is best to wait for growth without buying. A short growth will be followed by a correction, then, at that, we can sell for upward rebounds. 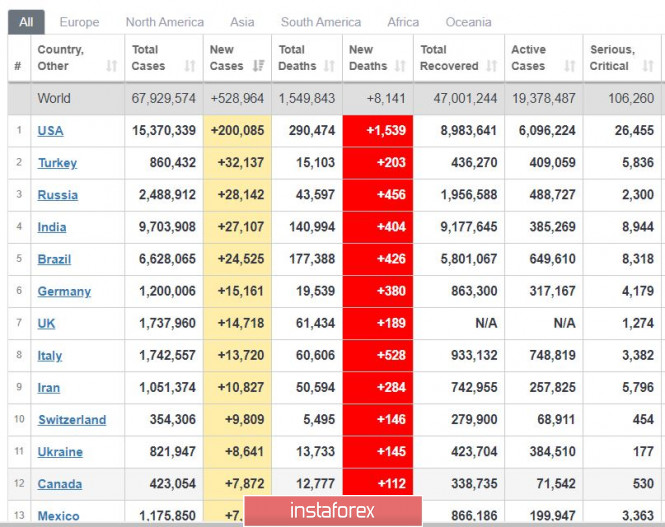
Global COVID-19 incidence decreased again yesterday, only amounting to below 650,000. I n the US, new infections are still at high levels (around 200,000 a day), but in Europe, there is an obvious decline in the figures. Vaccination starts in the UK this Friday. Technical analysis of USD/JPY for December 08, 2020 2020-12-08 Forecast : If the pair fails to pass through the level of 104.52, the market will indicate a bearish opportunity below the strong resistance level of 104.52. In this regard, sell deals are recommended lower than the 104.52 level with the first target at 103.69. It is possible that the pair will turn downwards continuing the development of the bearish trend to the level 103.33. However, stop loss has always been in consideration thus it will be useful to set it above the last double top at the level of 104.76. 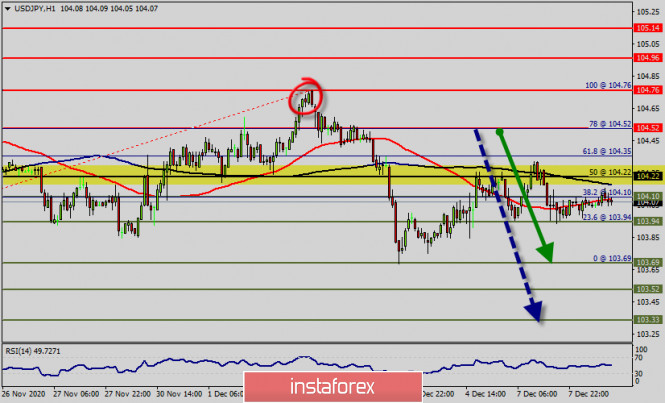
The trend is still trading around the 104.22 price since last week. The 104.22 pair is representing key level on the H1 chart. Also, the level of 104.22 represents a daily pivot point for that it is acting as major resistance/support this week. Because the market's behavior is impacted and determined by how individuals perceive and react to its behavior, investor psychology and sentiment affect whether the market will rise or fall. The market performance and investor psychology are mutually dependent. In a bull market, investors willingly participate in the hope of obtaining a profit. The USD/JPY pair movement was debatable as it took place in a narrow sideways channel for a while. The market showed signs of instability. Amid the previous events, the price is still moving between the levels of 104.76 and 103.69. The pair is still in a downtrend, because the USD/JPY pair is trading in a bearish trend from the new resistance line of 104.76 towards the first support level at 104.22 in order to test it. The daily resistance and support are seen at the levels of 104.76 and 104.22 respectively. In consequence, it is recommended to be cautious while placing orders in this area. Thus, we should wait until the sideways channel has completed. The price spot of 104.76remains a significant resistance zone. Therefore, there is a possibility that the USD/JPY pair will move to the downside and the fall structure does not look corrective. Resistance is seen at the level of 104.76 today. So, sell below 104.76 with the first target at 103.69 to test yesterday's bottom. In overall, we still prefer the bearish scenario as long as the price is below the level of 103.69. Furthermore, if the USD/JPY pair is able to break out the bottom at 103.69, the market will decline further to 103.19. On the support side, the previous support at 104.22 will likely serve as the first resistance level for the USD/JPY pair. A move below this level will push the USD/JPY pair towards the next support at 102.77. However, it would also be sage to consider where to place a stop loss; this should be set above the second resistance of 104.96. Trading recommendations for EUR/USD and GBP/USD pair on 12/08/20 2020-12-08 
Past review of GBP/USD pair The pound showed very high activity yesterday. As a result, the quotes initially collapsed, and then recovered to previous levels. What was published on the economic calendar? Nothing interesting was published in the UK in terms of statistics, similarly in the United States. What caused such high activity in the market? This is due to the prolonged Brexit process, where England and Brussels cannot agree on a trade agreement in any way. The tight deadlines for negotiations lead to the fact that speculators begin to panic buy and sell the pound, depending on the incoming information. Yesterday, there was information about the lack of progress in the negotiations, which led to the pound's rapid decline by more than 200 points. Many traders expected the reaction of the market, so it was easy to earn 100-150 points in just a few hours. What happened on the trading chart? The pound sharply fell at the beginning of the European session, which resulted in the quotes' decline to the level of 1.3225 even before noon, where a stop occurred followed by a recovery. Such a sharp decline in the pound's value in a short period of time was noticed. Thus, the recovery process began almost immediately, where the quote returned to the level of 1.3400 at the end of the day, where it started almost from this point. 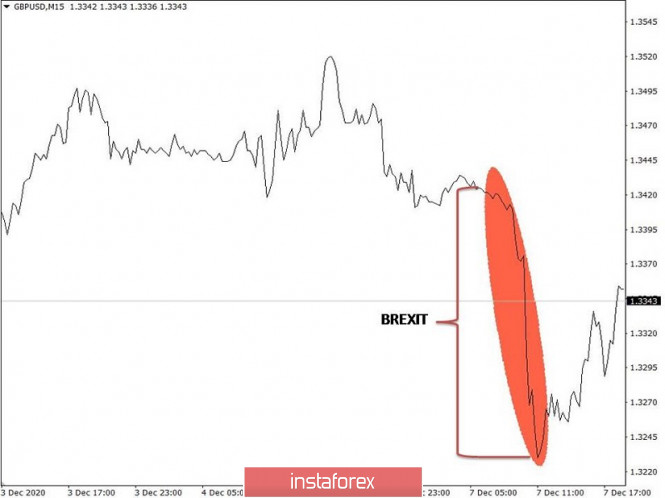
Past review of EUR/USD pair The euro showed less activity yesterday compared to the pound, but there was still a characteristic downward interest. What was published on the economic calendar? Statistics from Europe were not published and so, the market was sharply driven by the information noise flow, particularly news on the Brexit trade negotiations. What happened on the trading chart? The quote followed the pound at first, dropping the euro rate to the level of 1.2080. After that, a stop occurred with the price concentration near the level of 1.2100. Trading recommendation for GBP/USD on December 8 There are no statistics from the UK and the US today in terms of economic calendar. Therefore, market participants will continue to track information on Brexit trade negotiations. It should be recalled that positive information on trade negotiations leads to the pound's strengthening, while negative news about the lack of progress or the threat of Britain leaving the EU without a deal leads to the pound's weakening. Technically, a stagnation within the coordinate 1.3350 can be seen, as if market participants are waiting for a new batch of Brexit information. A speculative surge in the market can be expected, depending on the nature of the information (positive/negative). Local surges can occur outside the limits of the current stagnation 1.3335/1.3370. - Buying a pair at a price above 1.3370, with the prospect of moving to the level of 1.3400 is recommended. - Selling a pair at a price below 1.3330, with the prospect of moving to the level of 1.3300 is recommended. 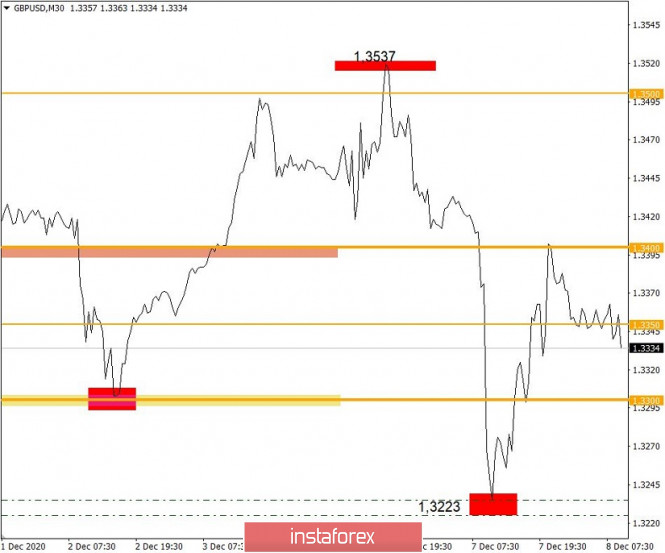
Trading recommendation for EUR/USD on December 8 Considering the economic calendar, we are waiting for the third estimate of Europe's GDP for the third quarter to be published today, where a decline in the economic slowdown is predicted from -14.8% to -4.4%. Investors do not expect any sharp price changes in the euro at the time of publication of the news, due to the fact that the data repeats the result of the first assessment. In terms of analysis, you can see that the quote continues to move within the level of 1.2100, trying to consolidate below it. If the quote continues to move below the level of 1.2100, and then remains below the previous day's low - 1.2078, then the most significant correctional movement towards 1.2000 will be possible. 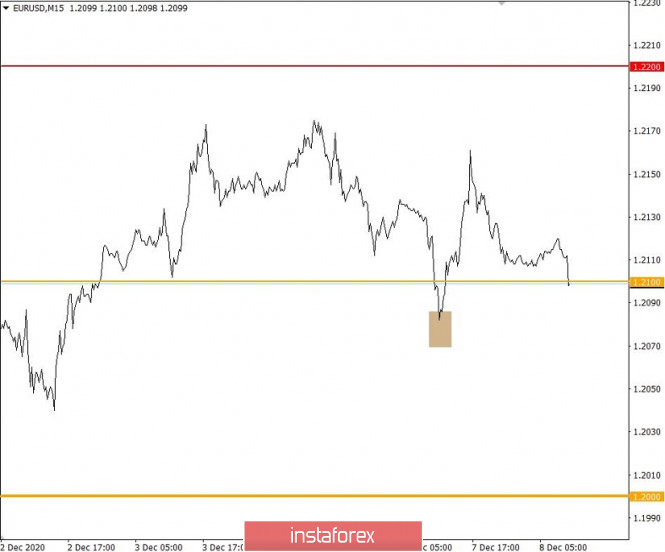
Technical recommendations for EUR/USD and GBP/USD pair on 12/08/20 2020-12-08 EUR / USD 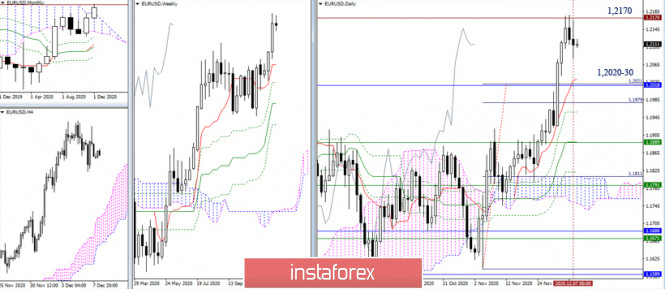 The slowdown under the level of 1.2170 continues. Thus, the pair is thinking whether the correction should be limited to a slight decline and deceleration, or turned it into a full-fledged correction decline to the first target – the daily Tenkan, which is now located very deeply (1.2031). Most likely, this will affect the following development of the situation. 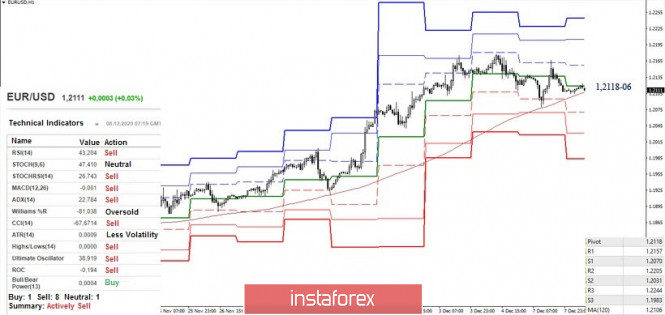 The movement in the smaller time frames is executed below the central pivot level, which is currently located at 1.2118. But at the same time, bulls maintain the support of the weekly long-term trend (1.2106). In turn, the bears' main task is to break through the key supports in the same TF and sharply consolidate below (1.2106-18). If this plan works out, the bearish mood will further strengthen. Today, the supports of the classic pivot levels located at 1.2070 - 1.2031 - 1.1983 serve as bears' intraday targets. On the other hand, returning the central pivot level of the day (1.2118) to the bulls' side will turn the main tasks into updating the high extremes (1.2166-77) and restoring the upward trend, which allows us to return bullish prospects. GBP / USD 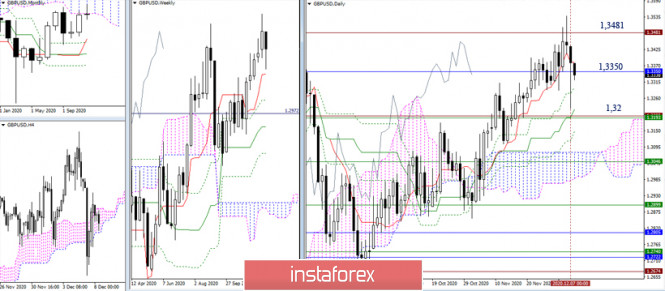 Based on yesterday's results, we can note that the current confrontation is quite strong. Despite bears' activity, they failed to maintain their positions. Thus, they were forced to return to the monthly cloud (above the level of 1.3350) by the closing of the day. Now, the bearish players are making an attempt to decline to the previously reached targets. The accumulation of important support levels still remains at 1.32 (historical level + daily Kijun + weekly Tenkan). 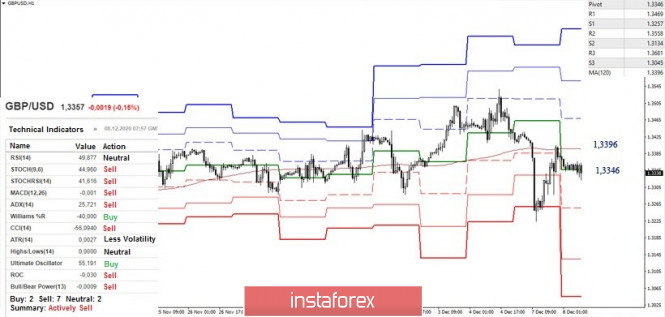 In this situation, the advantage in the smaller time frames is determined by being above or below the key level zone, which is currently located in the area of 1.3396-46 (central pivot level + weekly long-term trend). The bears are currently striving to reach a reliable predominance of forces, while being supported by technical indicators. However, yesterday's long lower shadow is undoubtedly a weakening factor, pulling the key levels (1.3396-46). On the other hand, if players return above the weekly long-term trend (1.3396), today's resistance levels at 1.3469 - 1.3558 - 1.3681 can be noted. Now, bearish prospects can be discussed not only after consolidating below the level of 1.3324, but also after passing the support level of 1.32 in the higher time frames. Ichimoku Kinko Hyo (9.26.52), Pivot Points (classical), Moving Average (120) Technical analysis of AUD/USD for December 08, 2020 2020-12-08 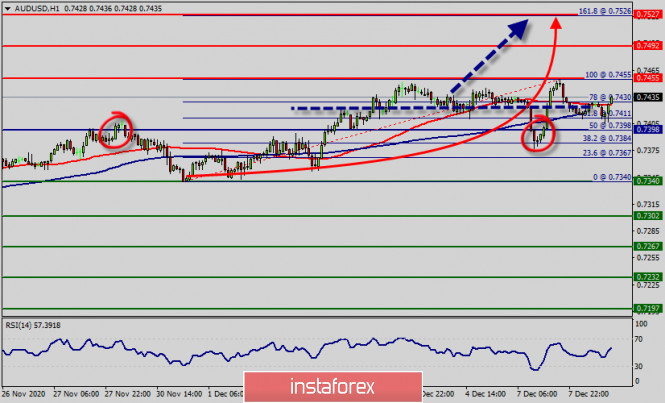 Overview : The AUD/USD pair quickly progressed to the top around 50 pips in the last hour and has now risen to the higher end of its daily trading range, around the 0.7398 - 0.7455 region. The AUD/USD pair has extended its rally to 0.7432 this morning, ending it a handful of pips below it. The AUD/USD pair has been steadily but painfully advancing against its American peer. With 0.7398 minor support intact (1st support, pivot point, 50% of Fibonacci), further rise is expected in the AUD/USD pair. Current rally from 0.7398 should target 0.7455 key long term fibonacci level. Further close above the high end may cause a rally towards 0.7455. Nonetheless, the weekly resistance level and zone should be considered. Therefore, strong support will be found at the level of 0.7398 providing a clear signal to buy with a target seen at 0.7455. The AUD/USD pair is showing signs of strength following a breakout of the highest level of 0.7398. If the trend breaks the minor resistance at 0.7455, the pair will move upwards continuing the bullish trend development to the level 0.7492 in order to test the daily resistance 2. On the H1 chart. the level of 0.7398 coincides with 50% of Fibonacci, which is expected to act as minor support today. Since the trend is above the 50% Fibonacci level, the market is still in an uptrend. But, major support is seen at the level of 0.7340. Furthermore, the trend is still showing strength above the moving average (100). Thus, the market is indicating a bullish opportunity above the above-mentioned support levels, for that the bullish outlook remains the same as long as the 100 EMA is headed to the upside. The market is likely to show signs of a bullish trend around the spot of 0.7398 - 0.7455. In other words, buy orders are recommended above the spot of 0.7398 - 0.7455 with the first target at the level of 0.7455 ; and continue towards 0.7492, then 0.7527. On the downside, however, break of 0.7340 will indicate short term topping and turn bias back to the downside for pull back. If the AUD/USD pair fails to break through the resistance level of 0.7340 today, the market will decline further to 0.7232. GBP/USD analysis on December 8. Brexit negotiations: a complete confusion. The British continues to lose demand 2020-12-08 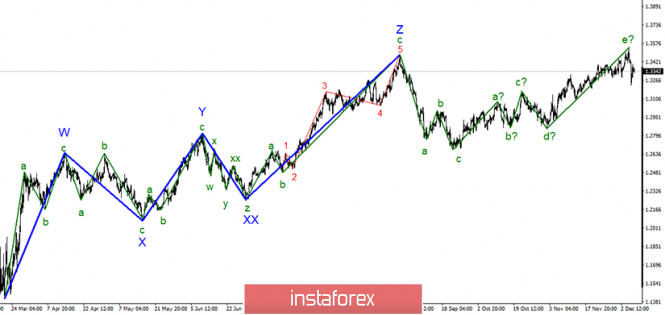
In the most global terms, the construction of an upward trend continues even though the quotes are moving away from the previously reached highs. Moreover, the wave pattern looks convincing enough to be considered complete as of this moment. Five waves are built up as part of a non-impulse section of the trend. The attempt to break the maximum of the previous global wave Z was unsuccessful. Thus, the markets now can start selling the British dollar which has been brewing for a long time. 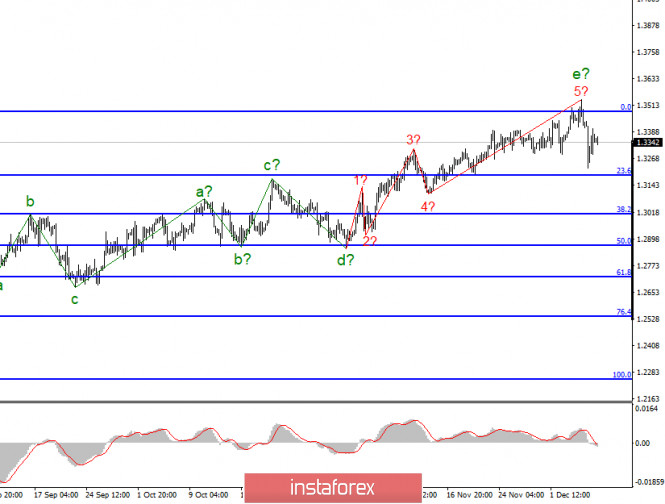
The lower chart clearly shows the a-b-c-d-e waves of the upward trend section. The assumed wave e took a five-wave form, which is also visible on the chart. However, even with this complication, it is nearing completion. As I expected, the tool started building a minimum correction three-wave section of the trend. A decline in quotes may also mean the end of the upward section and it will no longer be complicated. It depends much on the news background at this time and it remains not too favorable for the British. There was no interesting news in America or the UK yesterday. However, the Pound / Dollar instrument was still trading very actively, in fact, it's even more active than the usual. Markets feel that the series called "brexit negotiations" is nearing its end. And the closer the end, the more worried the markets are. In the past months, the British pound has been rising quite actively. If in March this year it fell to absolute lows around 14 figures, it reached 35 figures in December. Of course, at least half of the distance traveled can not be taken into account, since initially the British dollar fell so seriously due to the panic in the foreign exchange market caused by the first wave of coronavirus and the crisis that it caused in the spring of this year. Nevertheless, the British pound was clearly in demand due to the fact that the markets believed in London and Brussels for the past weeks. Given that it is not profitable for anyone to complete Brexit without a trade agreement, markets continued to believe that a deal would be agreed. However, the parties have already exceeded all the maximum allowed terms of negotiations. Today, the negotiations were supposed to end three weeks ago according to the EU and Britain, so that the parliaments of both parties could get acquainted with the agreement and ratify it. However, there is still no agreement and judging by the latest comments of the participants in the negotiation process, the deal is again at an impasse and the issues that were unresolved a month ago remained up to this day. Boris Johnson also said once again that the UK is ready to leave the EU without a deal. Other UK Ministers and EU diplomats have previously said the same thing. Thus, the question arises, do the parties want to agree at all or they're just playing on each other's nerves? General Conclusions and Recommendations: The Pound-Dollar instrument is expected to have completed the construction of an upward trend section. So, now I recommend looking closely at the sales of the tool. The British man will probably be aiming for 29. I expect to build at least three wave formations for this purpose. Thus, I recommend selling at this time the instrument for each MACD signal "down" with targets located near the calculated marks of 1.3012 and 1.2866. Ichimoku cloud indicator analysis of Gold 2020-12-08 Gold price is challenging key weekly resistance. In our previous analysis we noted that Gold is trading below key resistance at $1,850-60. What was once support is now resistance. According to the Ichimoku cloud indicator this area is confirmed resistance and a weekly close above will be a bullish sign. 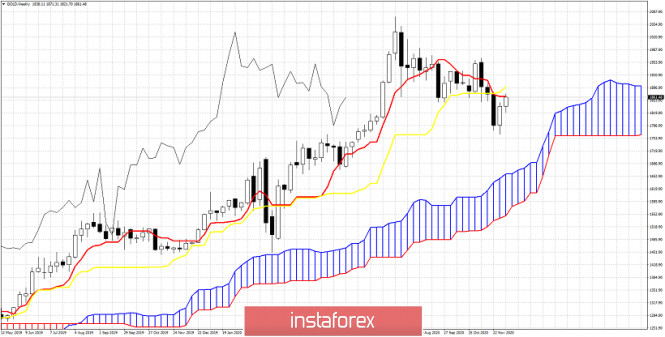
Gold price is above the weekly Kumo (cloud). Weekly trend is bullish. However as we explained in previous posts, Gold price was vulnerable for a pull back towards $1,800-$1,750. There is potential of price falling even lower towards cloud support around $1,725-$1,670. Price is below both the tenkan-sen (red line indicator) and the kijun-sen (yellow line indicator). As long as price is below these two indicators, price is vulnerable to another downward move. The Ichimoku cloud indicator confirms what our recent analysis says. Bulls need to recapture $1,850-60 and stay above it. EUR/USD analysis for December 08 2020 - Potetnial for the upside continuation and test of 1.2240 2020-12-08 Latest data released by NFIB - 8 December 2020 US small business optimism fell by the most in seven months, as the resurgence in the virus across the country is seen weighing on sentiment. Six of the ten sub-indexes declined last month and that points to some pessimism in business conditions overall. The election outcome was also seen as a factor, with NFIB noting that "there was clearly a disappointment for some small business owners". Further Development 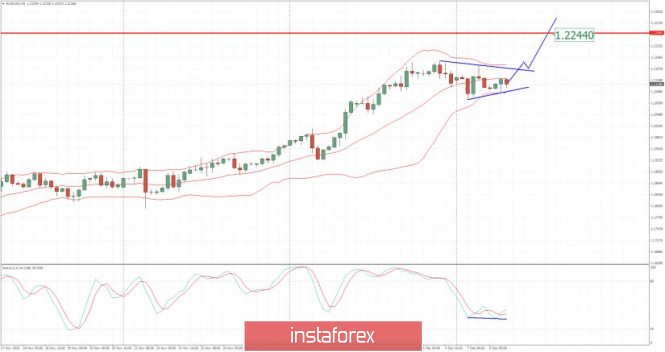
Analyzing the current trading chart of EUR/USD, I found that there is the consolidation and symmetrical triangle in creation, which is sign that there is potential for the upside continuation. 1-Day relative strength performance Finviz 
Based on the graph above I found that on the top of the list we got Ethanol and Lumber today and on the bottom Lean Hogs and Palladium. Key Levels: Resistance: 1,1165 and 1,2240 Support level: 1,2080 Analysis of Gold for December 08,.2020 - Outside bar on yesterday's close and potential for further test of $1.895 2020-12-08 Brexit: There is reportedly still no firm decision on when Boris Johnson will be heading to Brussels The Daily Telegraph's political editor, Gordon Rayner, updates on the situation Still no decision on when Boris Johnson will go to Brussels. Tomorrow is still possible, UK sources are saying, but EU sources saying there hasn't been a discussion yet with No10 over which day it will be. Just be reminded that the EU has now put a "deadline" for tomorrow but again, as much as one would believe that will be where they draw the line, it is easy to imagine further political posturing until we get to the transition period "deadline" of 31 December. For the pound, it will come down to how much buyers can tolerate all the shenanigans in the meantime. 
Further Development 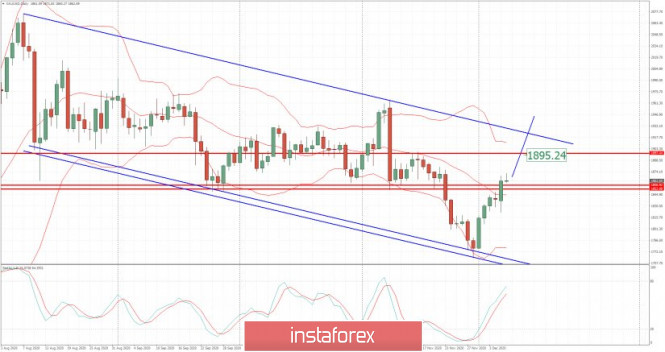
Analyzing the current trading chart of Gold, I found that there is the bullish outisde candle yesterday, which is good sign that buyers are strong. 1-Day relative strength performance Finviz 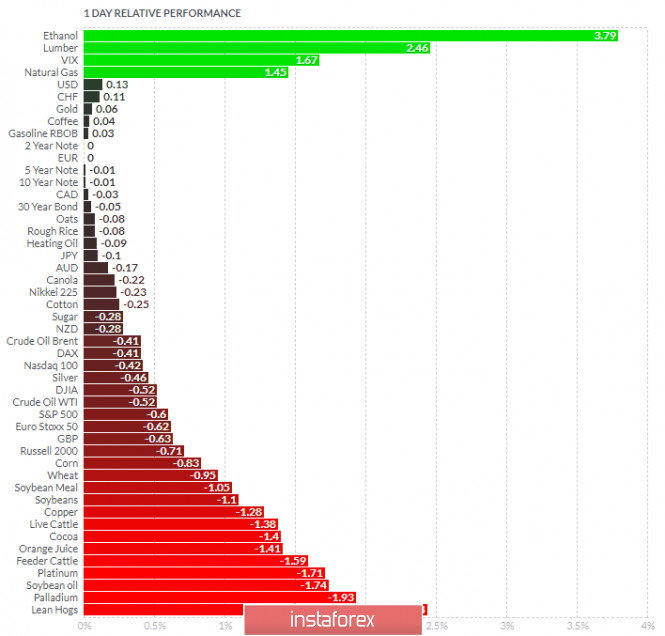
Based on the graph above I found that on the top of the list we got Ethanol and Lumber today and on the bottom Lean Hogs and Palladium. Gold is slightly positive today. Key Levels: Resistance:$1,895 Support level: $1,848
Author's today's articles: Mihail Makarov  - - Mourad El Keddani  Was born in Oujda, Morocco. Currently lives in Belgium. In 2003 obtained B.S. in Experimental Sciences. In 2007 obtained a graduate diploma at Institut Marocain Specialise en Informatique Applique (IMSIA), specialty – Software Engineering Analyst. In 2007–2009 worked as teacher of computer services and trainer in a professional school specializing in computer technologies and accounting. In 2005 started Forex trading. Authored articles and analytical reviews on Forex market on Forex websites and forums. Since 2008 performs Forex market research, and develops and implements his own trading strategies of Forex analysis (especially in Forex Research & Analysis, Currency Forecast, and Recommendations and Analysis) that lies in: Numerical analysis: Probabilities, equations and techniques of applying Fibonacci levels. Classical analysis: Breakout strategy and trend indicators. Uses obtained skills to manage traders' accounts since 2009. In April 2009 was certified Financial Technician by the International Federation of Technical Analysts. Winner of several social work awards: Education Literacy and Non-Formal Education (in Literacy and Adult Education in The National Initiative for Human Development). Was born in Oujda, Morocco. Currently lives in Belgium. In 2003 obtained B.S. in Experimental Sciences. In 2007 obtained a graduate diploma at Institut Marocain Specialise en Informatique Applique (IMSIA), specialty – Software Engineering Analyst. In 2007–2009 worked as teacher of computer services and trainer in a professional school specializing in computer technologies and accounting. In 2005 started Forex trading. Authored articles and analytical reviews on Forex market on Forex websites and forums. Since 2008 performs Forex market research, and develops and implements his own trading strategies of Forex analysis (especially in Forex Research & Analysis, Currency Forecast, and Recommendations and Analysis) that lies in: Numerical analysis: Probabilities, equations and techniques of applying Fibonacci levels. Classical analysis: Breakout strategy and trend indicators. Uses obtained skills to manage traders' accounts since 2009. In April 2009 was certified Financial Technician by the International Federation of Technical Analysts. Winner of several social work awards: Education Literacy and Non-Formal Education (in Literacy and Adult Education in The National Initiative for Human Development).
Languages: Arabic, English, French and Dutch.
Interests: Algorithm, Graphics, Social work, Psychology and Philosophy. Vladislav Tukhmenev  Vladislav graduated from Moscow State University of Technologiy and Management. He entered the forex market in early 2008. Vladislav is a professional trader, analyst, and manager. He applies a whole gamut of analysis – technical, graphical, mathematical, fundamental, and candlestick analysis. Moreover, he forecasts the market movements using his own methods based on the chaos theory. Vladimir took part in development of trading systems devoted to fractal analysis. In his free time, Vladimir blogs about exchange markets. Hobbies: active leisure, sporting shooting, cars, design, and marketing. "I do not dream only of becoming the best in my field. I also dream about those who I will take with me along the way up." Vladislav graduated from Moscow State University of Technologiy and Management. He entered the forex market in early 2008. Vladislav is a professional trader, analyst, and manager. He applies a whole gamut of analysis – technical, graphical, mathematical, fundamental, and candlestick analysis. Moreover, he forecasts the market movements using his own methods based on the chaos theory. Vladimir took part in development of trading systems devoted to fractal analysis. In his free time, Vladimir blogs about exchange markets. Hobbies: active leisure, sporting shooting, cars, design, and marketing. "I do not dream only of becoming the best in my field. I also dream about those who I will take with me along the way up." Zhizhko Nadezhda  Graduated from Irkutsk State University. Having acquainted with Forex market in 2008, followed the courses in the International Academy of Stock Exchange Trading. The agenda was so exiting that she moved to St. Petersburg in order to get professional education. Obtained a diploma of the retraining course on the discipline Exchange market and stock market issues, defended the graduation paper with distinction on the subject "Modern technical indicators as the basis of the trading system". At the moment obtains a master degree in International Banking Institute on specialty Financial markets and investments. Apart from trading is occupied with development of trading systems and formalization of the working strategies using Ichimoku indicator. At the moment is working on the book dedicated to the peculiarities of Ichimoku indicator and its operating methods. Interests: yoga, literature, travelling and photograph. "You can only get smarter by playing a smarter opponent" Basics of Chess play, 1883 "Successful people change by themselves, the others are changed by life" Jim Rohn Graduated from Irkutsk State University. Having acquainted with Forex market in 2008, followed the courses in the International Academy of Stock Exchange Trading. The agenda was so exiting that she moved to St. Petersburg in order to get professional education. Obtained a diploma of the retraining course on the discipline Exchange market and stock market issues, defended the graduation paper with distinction on the subject "Modern technical indicators as the basis of the trading system". At the moment obtains a master degree in International Banking Institute on specialty Financial markets and investments. Apart from trading is occupied with development of trading systems and formalization of the working strategies using Ichimoku indicator. At the moment is working on the book dedicated to the peculiarities of Ichimoku indicator and its operating methods. Interests: yoga, literature, travelling and photograph. "You can only get smarter by playing a smarter opponent" Basics of Chess play, 1883 "Successful people change by themselves, the others are changed by life" Jim Rohn Alexander Dneprovskiy  Graduated from Kiev State University of Economics. On Forex market since 2007. Started his work at Forex as a trader. Since 2008 is working as a currency analyst. Graduated from Kiev State University of Economics. On Forex market since 2007. Started his work at Forex as a trader. Since 2008 is working as a currency analyst. Alexandros Yfantis  Alexandros was born on September 14, 1978. He graduated from the ICMA Centre, University of Reading with the MSc in International Securities, investment and Banking in 2001. In 2000, Alexandros got the BSc in Economics and Business Finance from Brunel University, UK. In 2004, he began trading on the Greek stock market, where Alexandros got a specialization in international derivatives. Alexandros Yfantis has worked in a top financial company in Greece, responsible for the day-to-day running of the International markets department. He is a certified Portfolio Manager and a certified Derivatives Trader. Alexandros is also a contributor and analyst using Elliott wave and technical analysis of global financial markets. In 2007, he started Forex trading. He loves his profession and believes that entering a trade should always be accompanied by money management rules. His goal is to find profitable opportunities across the markets while minimizing risk and maximizing potential profit. "I'm still learning" Michelangelo Alexandros was born on September 14, 1978. He graduated from the ICMA Centre, University of Reading with the MSc in International Securities, investment and Banking in 2001. In 2000, Alexandros got the BSc in Economics and Business Finance from Brunel University, UK. In 2004, he began trading on the Greek stock market, where Alexandros got a specialization in international derivatives. Alexandros Yfantis has worked in a top financial company in Greece, responsible for the day-to-day running of the International markets department. He is a certified Portfolio Manager and a certified Derivatives Trader. Alexandros is also a contributor and analyst using Elliott wave and technical analysis of global financial markets. In 2007, he started Forex trading. He loves his profession and believes that entering a trade should always be accompanied by money management rules. His goal is to find profitable opportunities across the markets while minimizing risk and maximizing potential profit. "I'm still learning" Michelangelo Petar Jacimovic  Petar was born on July 08, 1989 in Serbia. Graduated from Economy University and after has worked as a currency analyst for large private investors. Petar has been involved in the world of finance since 2007. In this trading he specializes in Volume Price Action (volume background, multi Fibonacci zones, trend channels, supply and demand). He also writes the market analytical reviews for Forex forums and websites. Moreover Petar is forex teacher and has wide experience in tutoring and conducting webinars. Interests : finance, travelling, sports, music "The key to success is hard work" Petar was born on July 08, 1989 in Serbia. Graduated from Economy University and after has worked as a currency analyst for large private investors. Petar has been involved in the world of finance since 2007. In this trading he specializes in Volume Price Action (volume background, multi Fibonacci zones, trend channels, supply and demand). He also writes the market analytical reviews for Forex forums and websites. Moreover Petar is forex teacher and has wide experience in tutoring and conducting webinars. Interests : finance, travelling, sports, music "The key to success is hard work"
Subscription's options management Theme's:
Fundamental analysis, Fractal analysis, Wave analysis, Technical analysis, Stock Markets
Author's :
A Zotova, Aleksey Almazov, Alexander Dneprovskiy, Alexandr Davidov, Alexandros Yfantis, Andrey Shevchenko, Arief Makmur, Dean Leo, Evgeny Klimov, Fedor Pavlov, Grigory Sokolov, I Belozerov, Igor Kovalyov, Irina Manzenko, Ivan Aleksandrov, l Kolesnikova, Maxim Magdalinin, Mihail Makarov, Mohamed Samy, Mourad El Keddani, Oleg Khmelevskiy, Oscar Ton, Pavel Vlasov, Petar Jacimovic, R Agafonov, S Doronina, Sebastian Seliga, Sergey Belyaev, Sergey Mityukov, Stanislav Polyanskiy, T Strelkova, Torben Melsted, V Isakov, Viktor Vasilevsky, Vladislav Tukhmenev, Vyacheslav Ognev, Yuriy Zaycev, Zhizhko Nadezhda
Edit data of subscription settings
Unsubscribe from the mailing list Sincerely,
Analysts Service | If you have any questions, you can make a phone call using one of the
InstaForex Toll free numbers right now:
|  | InstaForex Group is an international brand providing online trading services to the clients all over the world. InstaForex Group members include regulated companies in Europe, Russia and British Virgin Islands. This letter may contain personal information for access to your InstaForex trading account, so for the purpose of safety it is recommended to delete this data from the history. If you have received this letter by mistake, please contact InstaForex Customer Relations Department. |


No comments:
Post a Comment