| Analysis and forecast for GBP/USD on November 19, 2020 2020-11-19 Daily 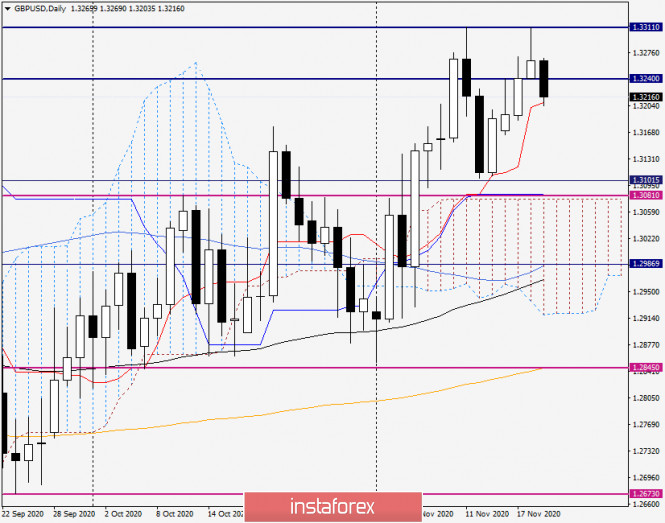
Despite yesterday's strengthening of the British pound against the US dollar, the situation regarding the further direction of the GBP/USD currency pair remains far from clear. The situation is not clear about the conclusion of a trade deal between the UK and the European Union. The British continue to say that they are ready to agree, but the European Union must respect the sovereignty of the UK with due respect. It's an old song. But yesterday's daily candle with a particularly long upper shadow and the inability to overcome the strong resistance of sellers at 1.3311 is more pessimistic. Most often, after such candles and the second unsuccessful attempt to break through the resistance, a reversal to a decrease in the rate follows. This is exactly what is observed at the moment of writing. The pound/dollar pair is currently trading near 1.3215. The current support is provided by the red Tenkan line of the Ichimoku indicator, but if it is passed and the auction closes lower, it is time to count on a subsequent decline in the quote. In this case, the subsequent targets of the bears for the pound will be 1.3180 and 1.3100. At the same time, a breakdown of the last level will finally convince the sellers to have control over the pair. To reanimate the bullish scenario, it is necessary to break through the resistance of sellers at 1.3311, which has already blocked the way up twice and pushed the pair in the south direction. Given the current picture on the daily timeframe, I am more inclined to assume a downward scenario. H4 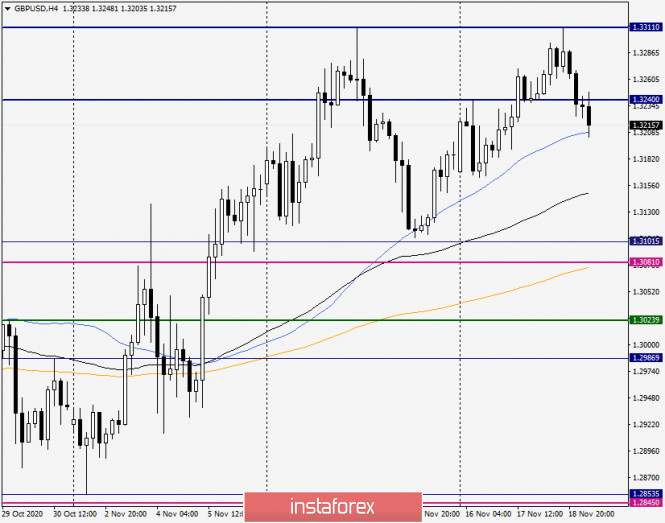
On the four-hour chart, the pair is trading above the used moving averages (50 MA, 89 EMA, and 200 EMA), while at the time of writing, the quote is testing the simple moving average for a break of 50. If the 50 MA breakdown takes place, we expect a further decline to 89 EMA, which is at 1.3148. If this moving average can be pushed, the downward trend will continue to the area of 1.3100-1.3080, where there are a strong technical level and the orange 200 exponentials. But in case of failure to break through 50 MA and the appearance of a reversal model of candle analysis here, a signal will appear that the pound bulls are ready to once again try to raise the rate to the area of 1.3300. If this happens, it is highly likely that the resistance at 1.3311 will still be broken on the third attempt. If you go to the trading recommendations, then both purchases and sales can be considered relevant. However, given yesterday's daily candle, the GBP/USD pair's sales look more typical. I suggest that we consider the nearest options for opening short positions after short-term rises to the levels of 1.3233 and 1.3255 and the appearance of bearish candle patterns here. I suggest you take a closer look at the purchases after the price drops to the price zone of 1.3200-1.3180. In this case, bullish candlestick signals will be the confirmation for opening long positions. From today's statistics, the price dynamics of the GBP/USD pair may be affected by initial applications for unemployment benefits and the Philadelphia Federal Reserve's manufacturing index, which will be published at 14:30 London time. Technical analysis of GBP/USD for November 19, 2020 2020-11-19 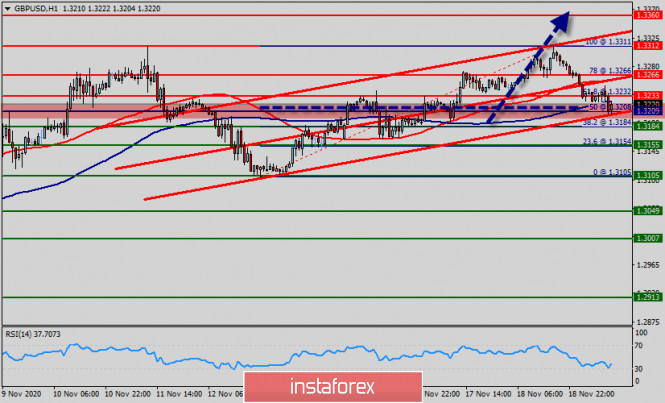 Overview : The GBP/USD pair rose from the level of 1.3105 towards 1.3311, but it rebounded to the level of 1.3209. Now, the current price is set at 1.3218. On the H1 chart, the resistance is seen at the levels of 1.3266 and 1.3311. Besides, the weekly support 1 is seen at the level of 1.3155. Today, the GBP/USD pair is continuing to move in a bullish trend from the new support level of 1.3208, to form a bullish channel. Amid the previous events, we expect the pair to move between 1.3208 and 1.3311. Therefore, buy above the level of 1.3208 with the first target at 1.3266 in order to test the daily resistance 1 and further to 1.3311 (double top). However, if the pair fails to pass through the level of 1.3311, the market will indicate a bearish opportunity below the level of 1.3311. The market will decline further to 1.3209 so as to return to the weekly pivot point. Additionally, a breakout of that target will move the pair further downwards to 1.3105. The market is still in an uptrend. We still prefer the bullish scenario. Technical recommendations for EUR/USD and GBP/USD on November 19 2020-11-19 EUR / USD 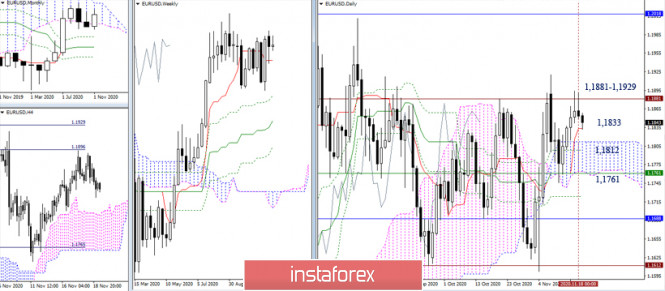 The bulls failed to attack the resistance area 1.1881 - 1.1929 (historical level + 100% target development for the breakdown of the H4 cloud) again and so, it retained its value. Now, the pair declined to the support level of the daily Tenkan (1.1833). If the bulls lose their daily short-term advantage, a decline will follow to the area of the daily cloud (1.1812 - 1.1761), which is strengthened by the weekly short-term trend. 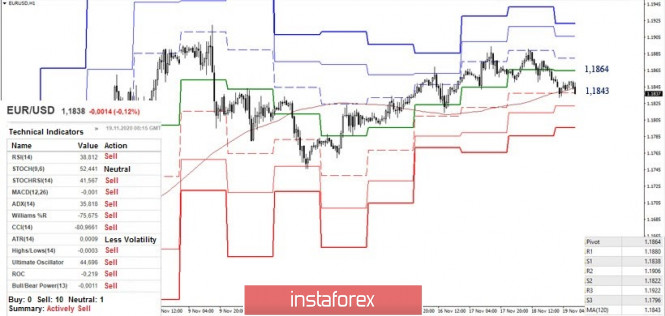 There is a struggle for the weekly long-term trend (1.1843) in the smaller time frames. The loss of two such important support levels at once, such as the daily short-term trend (1.1833) and the long-term trend on H1 (1.1843), can force players to yield their prospects for a long time. The next supports for the classic intraday pivot levels are located at 1.1822 and 1.1796. On the other hand, it is important for the bulls to hold their positions to the level of 1.1843 (weekly long-term trend) and 1.1864 (central pivot level) in order to restore their positions and advantages. GBP / USD 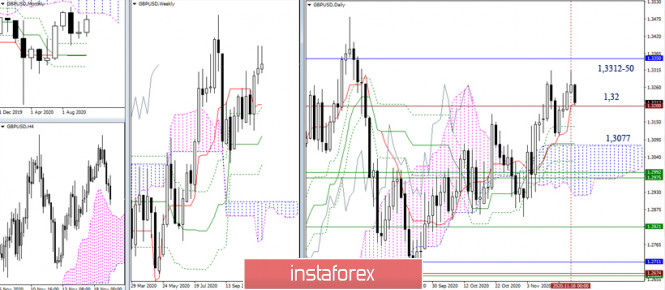 The resistances in the area of 1.3312-50 (high + lower limit of the monthly cloud) have retained their value and location. It is unlikely to update last week's high (1.3312), and so, pair is trading in the zone of the all-time level of 1.32 again, where the daily short-term trend (1.3209) is also located. A consolidation below which will change the balance of forces and open the way to important supports in the area of the daily cloud 1.3077 (upper limit + daily Kijun) - 1.2990-20 (lower limits + weekly levels). We can note the nearest support level at 1.3137 (daily Fibo Kijun). 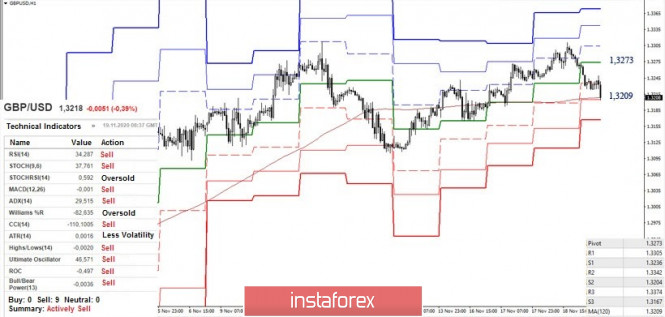 At the reversal of the all-time level of 1.32, an important support for the smaller time frames, led by the weekly long-term trend (1.3209) is currently fixed. The level's strength can now keep the pair in the influence zone for quite a long time, allowing some movement in this time frame. Nevertheless, a consolidation below and a reversal of the moving average will form an advantage on one-hour TF to strengthen the bearish mood. The next downside goals are 1.3167 (S3) and 1.3108 (low extreme). If the bulls manage to rebound from the reached support levels and return to the central pivot level (1.3273), options to restore their positions will be considered. Their main task will be to update the low (1.3312). Ichimoku Kinko Hyo (9.26.52), Pivot Points (classical), Moving Average (120) Gold lays trap for buyers 2020-11-19  Hi dear traders! Let me present my overview of the gold situation. Well, last week I suggested the short trading idea for gold. This trading week is likely to bring disappointment to small gold speculators who are betting on the metal appreciation. The gold price is putting pressure on the lower border of a huge auction. Under such market conditions, buyers have nothing to do but hide behind a monthly level of $1,850. To sum up, at present I would recommend you staying away from long deals on gold so that you will not be caught in a trap set by market makers. The gold price could slump anytime. The odds are that it will happen during the American trade. The trading idea is developed on the grounds of the two methods: Price Action and Hunting for stop orders. Good luck in trading! Make sure you manage your risks! EUR/USD: plan for the American session on November 19 (analysis of morning deals) 2020-11-19 To open long positions on EURUSD, you need: In my morning forecast, I recommended selling the euro after the breakout and consolidation below the level of 1.1832, which happened. Let's look at a 5-minute chart. The lack of important fundamental statistics led to the continuation of the bearish momentum in the pair, which allowed us to increase short positions below the level of 1.1832. A break and consolidation below this range with a reverse test from the bottom up formed a good entry point for short positions, however, this did not lead to a major sell-off, as traders do not have further guidance due to the uncertainty with Brexit. Already closer to the beginning of the American session, the bulls managed to return to the level of 1.1832. 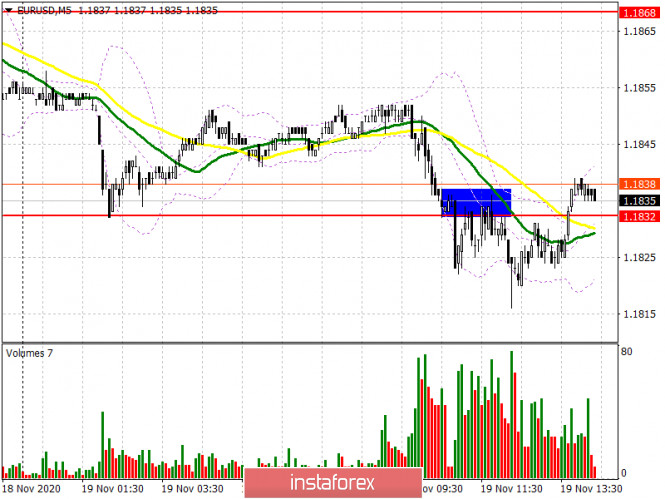
I do not recommend rushing to open long positions. A small increase above 1.1832 is required, and then a return to this range with its top-down test. Only this creates a convenient entry point for long positions with the expectation of resuming the upward trend. It will be possible to say that buyers have returned to the market only after they manage to pick up the level of 1.1868, fixing at which will be an additional signal to open long positions in the expectation of updating the maximum of 1.1915, where I recommend fixing the profits. If there is no activity from buyers above the level of 1.1868 in the second half of the day, and the pair again falls below this range after the release of good data on the US labor market, I recommend postponing long positions until the test of large support of 1.1797. You can open long positions in EUR/USD immediately on the rebound from the minimum of 1.1749, based on a correction of 15-20 points within the day. To open short positions on EURUSD, you need: The same task for sellers in the second half of the day is to break the level of 1.1832, which they failed to achieve during the European session. Only a consolidation below 1.1832, similar to the morning entry point for sales, and its test from the reverse side from the bottom up, form a more convenient signal for entering short positions in the expectation of resuming the downward trend. In this case, the nearest target of the bears will be at least 1.1797. A test of this level will only indicate that the pair is stuck in a side channel. Only a breakdown and consolidation below this range will lead EUR/USD to the lower border of the side channel 1.1749, where I recommend taking the profit. However, it will be possible to talk about the resumption of the bearish trend only after a complete breakout of this area, which will quickly push the pair to the minimum of 1.1701. If the bulls are stronger and continue to push EUR/USD up in the second half of the day, and this will happen only against the background of weak data on the US economy due to a sharp increase in the number of initial applications for unemployment benefits in the US, then it is best not to rush with sales, but wait for the update of the larger resistance of 1.1868. However, you can only sell from this level if a false breakout is formed there. I recommend opening short positions on EUR/USD immediately for a rebound only from the monthly maximum of 1.1915, based on a correction of 15-20 points within the day. 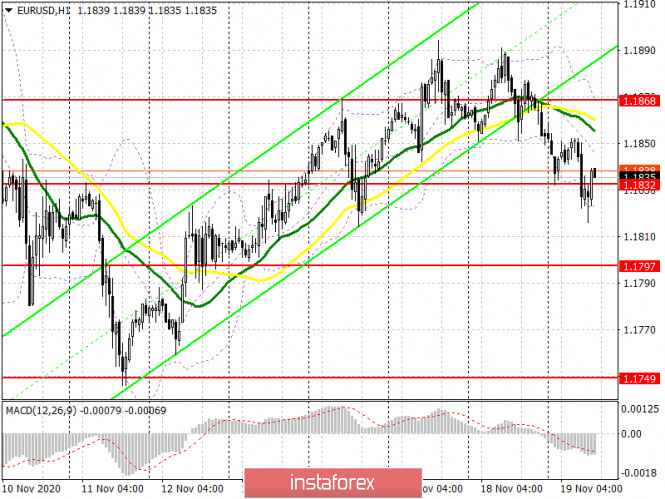
The COT report (Commitment of Traders) for November 10 recorded a reduction in long and short positions. Euro bulls are holding a wait-and-see attitude and are in no hurry to return to the market even after the presidential election in the United States. But despite this, buyers of risky assets believe in the continuation of the bull market, although they prefer to act cautiously. Thus, long non-commercial positions decreased from the level of 208,237 to the level of 202,374, while short non-commercial positions remained almost unchanged, falling from the level of 67,888 to 67,087. The total non-profit net position fell to 135,287, down from 140,349 a week earlier. It is worth noting that the delta has been declining for 7 consecutive weeks, which confirms the lack of desire of euro buyers to go to the market in the current conditions. Growth will only begin after Joe Biden's victory and his intentions to bestow the next largest monetary aid package of more than $ 2 trillion on the American economy begin to be realized. Signals of indicators: Moving averages Trading is conducted below 30 and 50 daily moving averages, which indicates an attempt by the bears to return to the market. Note: The period and prices of moving averages are considered by the author on the hourly chart H1 and differ from the general definition of classic daily moving averages on the daily chart D1. Bollinger Bands If the pair grows, the upper limit of the indicator around 1.1868 will act as a resistance. Description of indicators - Moving average (moving average determines the current trend by smoothing out volatility and noise). Period 50. The graph is marked in yellow.
- Moving average (moving average determines the current trend by smoothing out volatility and noise). Period 30. The graph is marked in green.
- MACD indicator (Moving Average Convergence / Divergence - moving average convergence / divergence) Fast EMA period 12. Slow EMA period 26. SMA period 9
- Bollinger Bands (Bollinger Bands). Period 20
- Non-profit speculative traders, such as individual traders, hedge funds, and large institutions that use the futures market for speculative purposes and meet certain requirements.
- Long non-commercial positions represent the total long open position of non-commercial traders.
- Short non-commercial positions represent the total short open position of non-commercial traders.
- Total non-commercial net position is the difference between the short and long positions of non-commercial traders.
GBP/USD: plan for the American session on November 19 (analysis of morning deals) 2020-11-19 To open long positions on GBPUSD, you need: In my morning forecast, I paid attention to the level of 1.3237 and recommended to act from it based on the situation. Let's look at the 5-minute chart and see what happened. Initially, the bulls tried to take the area of 1.3237 and even broke above this range by testing it from top to bottom, which led to the formation of a buy signal, which immediately led to a loss, as the bears quickly regained control of this level. Then, after a confident consolidation below 1.3237, a reverse test of the area of 1.3237 took place from the bottom up, which led to the formation of a sell signal for the pound. The movement from this level was more than 30 points, however, it was not possible to achieve the formation of a larger downward trend. 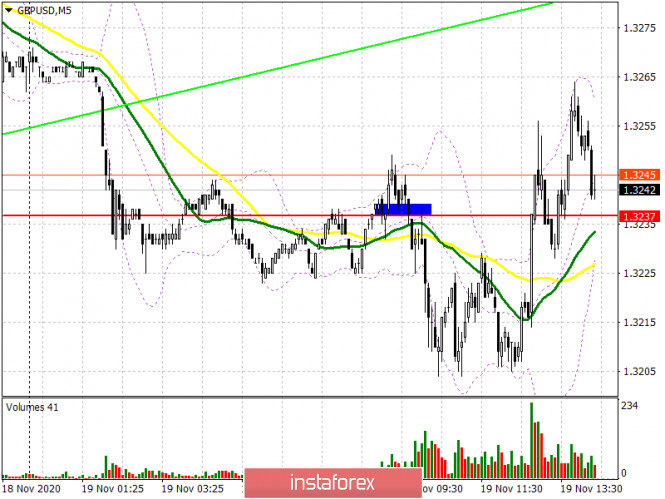
If you look at the hourly chart, you will see that buyers managed to return the pound to the level of 1.3237 again, keeping the initiative on their side. Only if the bulls hold 1.3237, or achieve the formation of a false breakout, I recommend opening long positions in the continuation of the upward trend. This may happen immediately after the release of data on the US labor market, as the number of initial applications for unemployment benefits may jump sharply amid the growth of the coronavirus epidemic in the United States. If the report turns out to be worse than economists' forecasts, the bulls will continue to buy the pound. In this case, the nearest target for buyers will be this month's maximum of 1.3310. Only a break and consolidation above this range forms a new wave of growth of the pound with an exit to the area of 1.3378 and 1.3467, where I recommend fixing the profits. In the scenario of good data on the US economy and the return of GBP/USD to the level of 1.3237, it is best to postpone long positions until the minimum of 1.3168 is updated or buy the pair immediately for a rebound from the larger area of 1.3106, which is a kind of lower border of the wide side channel 1.3106-1.3310 in which the pound is all this month. To open short positions on GBPUSD, you need: The bears are still fighting to regain control of the level of 1.3237, which they managed to miss in the first half of the day. Particular attention is focused on the Brexit news, as it will set the tone of the market at the end of this week. The initial task is to return GBP/USD to the level of 1.3237 and test it from the bottom up, which forms a fairly good entry point into short positions, which will be able to push the pound to a minimum of 1.3168, where I recommend fixing the profits. Only a breakout of 1.3168 with consolidation under this range will give sellers of the pound more confidence, which will open a direct road to the lows of 1.3106 and 1.3034. In the scenario of a lack of activity among sellers and poor data on the US economy, it is best to postpone short positions until the maximum of 1.3310 is updated, provided that a false breakout is formed there. I recommend selling GBP/USD immediately for a rebound from the maximum of 1.3378, based on a correction of 20-30 points within the day. 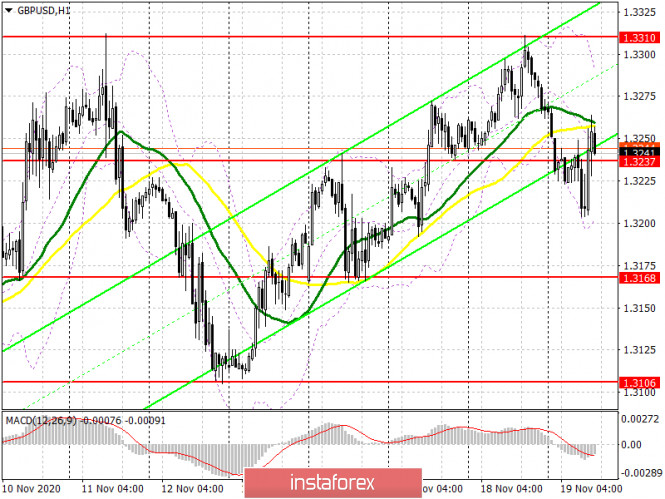
In COT reports (Commitment of Traders) for November 10, there was a minimal increase in long positions and a sharp influx of short positions. Non-commercial long positions grew from 27,701 to 27,872. At the same time, short non-commercial positions increased from the level of 38,928 up to the level of 45,567. As a result, the negative non-commercial net position was -17,695, compared to -11,227 a week earlier, which indicates that sellers of the British pound remain in control and have an advantage in the current situation. Signals of indicators: Moving averages Trading is conducted around 30 and 50 daily averages, which indicates the sideways nature of the market. Note: The period and prices of moving averages are considered by the author on the hourly chart H1 and differ from the general definition of classic daily moving averages on the daily chart D1. Bollinger Bands If the pound rises, the upper limit of the indicator around 1.3300 will act as a resistance. Description of indicators - Moving average (moving average determines the current trend by smoothing out volatility and noise). Period 50. The graph is marked in yellow.
- Moving average (moving average determines the current trend by smoothing out volatility and noise). Period 30. The graph is marked in green.
- MACD indicator (Moving Average Convergence / Divergence - moving average convergence / divergence) Fast EMA period 12. Slow EMA period 26. SMA period 9
- Bollinger Bands (Bollinger Bands). Period 20
- Non-profit speculative traders, such as individual traders, hedge funds, and large institutions that use the futures market for speculative purposes and meet certain requirements.
- Long non-commercial positions represent the total long open position of non-commercial traders.
- Short non-commercial positions represent the total short open position of non-commercial traders.
- Total non-commercial net position is the difference between the short and long positions of non-commercial traders.
Analysis of Gold for November 19,.2020 - Strong downside continuation as I expected and potential for test of $1.850/20 2020-11-19 Daily Express' Brussels correspondent, Joe Barnes, also corroborates with the report in saying that Barnier will be briefing EU member states tomorrow to update on Brexit talks. After the earlier development, the question now is will this be one where Barnier signals white smoke or just a reiteration of what we have heard time and time again? There is every likelihood that talks could continue through the weekend and also into next week, so the update tomorrow is going to be key to set the tone. 
Further Development 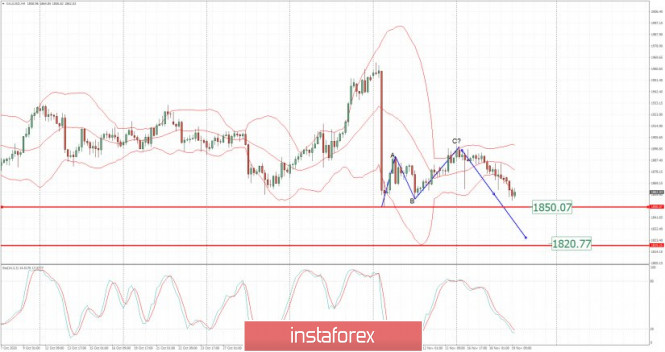
Analyzing the current trading chart of Gold, I found that Gold is heading towards our first yesterday's target at $1,850. 1-Day relative strength performance Finviz 
Based on the graph above I found that on the top of the list we got Ethanol and Orange Juice today and on the bottom Natural Gas and Lumber. Gold is negative on the list, which is another sign of weakness. Key Levels: Resistance: $1,865 Support levels: $1,850 and $1,820. EUR/USD analysis for November 19 2020 - Breakout of the 2-day balance to the downside and potential for test of 1.1700 2020-11-19
Prior -34 - Trends selling prices -8 vs 0 expected
- Prior 4
UK manufacturing orders is seen declining at a quicker pace in November, with order books seen softening again amid more lockdowns across the region. Of note, output volumes have declined to their slowest pace in over a year, according to CBI. The CBI readings are a survey on manufacturers to rate the level of volume for orders expected during the next 3 months.
Further Development 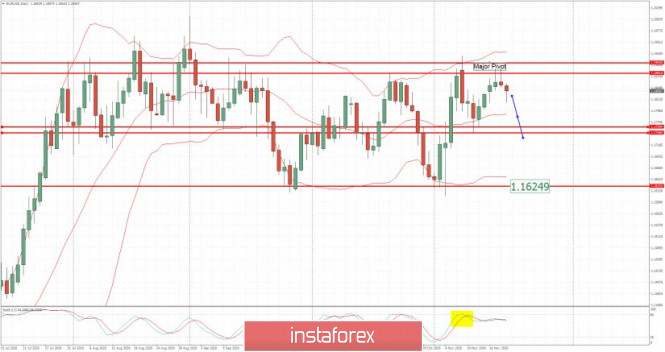
Analyzing the current trading chart of EUR/USD, I found that EUR broke the inside day formation to the downside and i see further downside movement on this currency pair. 1-Day relative strength performance Finviz 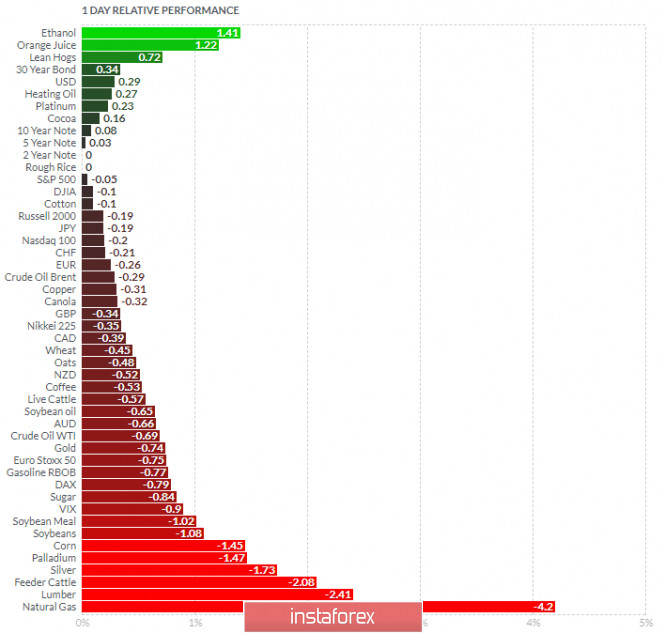
Based on the graph above I found that on the top of the list we got Ethanol and Orange Juice today and on the bottom Natural Gas and Lumber. Key Levels: Resistance: 1,1840/50 Support levels: 1,1700 and 1,1625
Author's today's articles: Ivan Aleksandrov  Ivan Aleksandrov Ivan Aleksandrov Mourad El Keddani  Was born in Oujda, Morocco. Currently lives in Belgium. In 2003 obtained B.S. in Experimental Sciences. In 2007 obtained a graduate diploma at Institut Marocain Specialise en Informatique Applique (IMSIA), specialty – Software Engineering Analyst. In 2007–2009 worked as teacher of computer services and trainer in a professional school specializing in computer technologies and accounting. In 2005 started Forex trading. Authored articles and analytical reviews on Forex market on Forex websites and forums. Since 2008 performs Forex market research, and develops and implements his own trading strategies of Forex analysis (especially in Forex Research & Analysis, Currency Forecast, and Recommendations and Analysis) that lies in: Numerical analysis: Probabilities, equations and techniques of applying Fibonacci levels. Classical analysis: Breakout strategy and trend indicators. Uses obtained skills to manage traders' accounts since 2009. In April 2009 was certified Financial Technician by the International Federation of Technical Analysts. Winner of several social work awards: Education Literacy and Non-Formal Education (in Literacy and Adult Education in The National Initiative for Human Development). Was born in Oujda, Morocco. Currently lives in Belgium. In 2003 obtained B.S. in Experimental Sciences. In 2007 obtained a graduate diploma at Institut Marocain Specialise en Informatique Applique (IMSIA), specialty – Software Engineering Analyst. In 2007–2009 worked as teacher of computer services and trainer in a professional school specializing in computer technologies and accounting. In 2005 started Forex trading. Authored articles and analytical reviews on Forex market on Forex websites and forums. Since 2008 performs Forex market research, and develops and implements his own trading strategies of Forex analysis (especially in Forex Research & Analysis, Currency Forecast, and Recommendations and Analysis) that lies in: Numerical analysis: Probabilities, equations and techniques of applying Fibonacci levels. Classical analysis: Breakout strategy and trend indicators. Uses obtained skills to manage traders' accounts since 2009. In April 2009 was certified Financial Technician by the International Federation of Technical Analysts. Winner of several social work awards: Education Literacy and Non-Formal Education (in Literacy and Adult Education in The National Initiative for Human Development).
Languages: Arabic, English, French and Dutch.
Interests: Algorithm, Graphics, Social work, Psychology and Philosophy. Zhizhko Nadezhda  Graduated from Irkutsk State University. Having acquainted with Forex market in 2008, followed the courses in the International Academy of Stock Exchange Trading. The agenda was so exiting that she moved to St. Petersburg in order to get professional education. Obtained a diploma of the retraining course on the discipline Exchange market and stock market issues, defended the graduation paper with distinction on the subject "Modern technical indicators as the basis of the trading system". At the moment obtains a master degree in International Banking Institute on specialty Financial markets and investments. Apart from trading is occupied with development of trading systems and formalization of the working strategies using Ichimoku indicator. At the moment is working on the book dedicated to the peculiarities of Ichimoku indicator and its operating methods. Interests: yoga, literature, travelling and photograph. "You can only get smarter by playing a smarter opponent" Basics of Chess play, 1883 "Successful people change by themselves, the others are changed by life" Jim Rohn Graduated from Irkutsk State University. Having acquainted with Forex market in 2008, followed the courses in the International Academy of Stock Exchange Trading. The agenda was so exiting that she moved to St. Petersburg in order to get professional education. Obtained a diploma of the retraining course on the discipline Exchange market and stock market issues, defended the graduation paper with distinction on the subject "Modern technical indicators as the basis of the trading system". At the moment obtains a master degree in International Banking Institute on specialty Financial markets and investments. Apart from trading is occupied with development of trading systems and formalization of the working strategies using Ichimoku indicator. At the moment is working on the book dedicated to the peculiarities of Ichimoku indicator and its operating methods. Interests: yoga, literature, travelling and photograph. "You can only get smarter by playing a smarter opponent" Basics of Chess play, 1883 "Successful people change by themselves, the others are changed by life" Jim Rohn Andrey Shevchenko  Andrey Shevchenko Andrey Shevchenko Maxim Magdalinin  In 2005 graduated from the Academy of the Ministry of Internal Affairs of the Republic of Belarus, law faculty. Worked as a lawyer for three years in one of the biggest country's company. Besides the trading, he develops trading systems, writes articles and analytical reviews. Works at stock and commodity markets explorations. On Forex since 2006. In 2005 graduated from the Academy of the Ministry of Internal Affairs of the Republic of Belarus, law faculty. Worked as a lawyer for three years in one of the biggest country's company. Besides the trading, he develops trading systems, writes articles and analytical reviews. Works at stock and commodity markets explorations. On Forex since 2006. Petar Jacimovic  Petar was born on July 08, 1989 in Serbia. Graduated from Economy University and after has worked as a currency analyst for large private investors. Petar has been involved in the world of finance since 2007. In this trading he specializes in Volume Price Action (volume background, multi Fibonacci zones, trend channels, supply and demand). He also writes the market analytical reviews for Forex forums and websites. Moreover Petar is forex teacher and has wide experience in tutoring and conducting webinars. Interests : finance, travelling, sports, music "The key to success is hard work" Petar was born on July 08, 1989 in Serbia. Graduated from Economy University and after has worked as a currency analyst for large private investors. Petar has been involved in the world of finance since 2007. In this trading he specializes in Volume Price Action (volume background, multi Fibonacci zones, trend channels, supply and demand). He also writes the market analytical reviews for Forex forums and websites. Moreover Petar is forex teacher and has wide experience in tutoring and conducting webinars. Interests : finance, travelling, sports, music "The key to success is hard work"
Subscription's options management Theme's:
Fundamental analysis, Fractal analysis, Wave analysis, Technical analysis, Stock Markets
Author's :
A Zotova, Aleksey Almazov, Alexander Dneprovskiy, Alexandr Davidov, Alexandros Yfantis, Andrey Shevchenko, Arief Makmur, Dean Leo, Evgeny Klimov, Fedor Pavlov, Grigory Sokolov, I Belozerov, Igor Kovalyov, Irina Manzenko, Ivan Aleksandrov, l Kolesnikova, Maxim Magdalinin, Mihail Makarov, Mohamed Samy, Mourad El Keddani, Oleg Khmelevskiy, Oscar Ton, Pavel Vlasov, Petar Jacimovic, R Agafonov, S Doronina, Sebastian Seliga, Sergey Belyaev, Sergey Mityukov, Stanislav Polyanskiy, T Strelkova, Torben Melsted, V Isakov, Viktor Vasilevsky, Vladislav Tukhmenev, Vyacheslav Ognev, Yuriy Zaycev, Zhizhko Nadezhda
Edit data of subscription settings
Unsubscribe from the mailing list Sincerely,
Analysts Service | If you have any questions, you can make a phone call using one of the
InstaForex Toll free numbers right now:
|  | InstaForex Group is an international brand providing online trading services to the clients all over the world. InstaForex Group members include regulated companies in Europe, Russia and British Virgin Islands. This letter may contain personal information for access to your InstaForex trading account, so for the purpose of safety it is recommended to delete this data from the history. If you have received this letter by mistake, please contact InstaForex Customer Relations Department. |


No comments:
Post a Comment