| Analysis and forecast for GBP/USD on October 15, 2020 2020-10-15 Daily 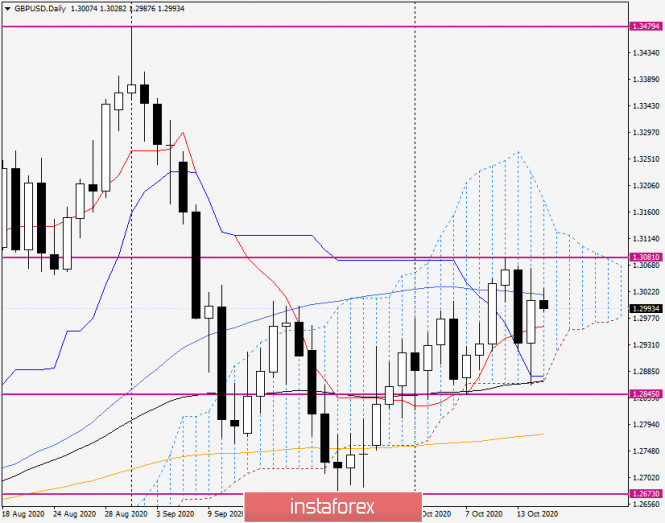
Yesterday's trading day ended with a fairly good growth for the GBP/USD currency pair — the closing price was 1.3007. The highs were shown at 1.3063, while the lows were indicated at 1.2862. In the run-up to the European Union summit, that will be held on Thursday and Friday, the pound is clearly in a fever, which is not surprising at all. Note that one of the most important topics of this upcoming event will be the Brexit negotiations for it can eliminate all the contradictions that prevent the signing of a trade deal between the EU and the UK. However, as some reputable news agencies suggest, real prerequisites for reaching a trade agreement between the parting parties may be insufficient. If that is the case, then the upcoming EU summit risks being another "pass-through" or simply - fruitless. You can estimate options now, but it is better to wait for the results of the summit and make appropriate conclusions after the negotiations are completed. In the technical picture, we should note that yesterday's assumptions about price dynamics were fully justified. This refers to the support that the blue Kijun line of the Ichimoku indicator, the black line of the exponential average, and the lower border of the cloud should have provided to the quote. As you can see, the pair once again flashed excellent technique and, having dropped to the lower border of the cloud and the listed indicators, began an active recovery. The obstacle to further growth is still the 50 simple moving average, which runs at 1.3017. So today, the pair made an attempt to continue yesterday's growth, but 50 MA at this stage of time does not allow the quote to go higher. It can be assumed that the 50 MA and the red Tenkan line will be the benchmarks for further price movement of GBP/USD on the daily chart. If trading closes above 50 MA, the pair will open the road to a strong resistance zone of 1.3063-1.3081, where the highs of yesterday's session and trading on October 12 were shown. A break of 1.3081 will significantly strengthen the bullish mood for the pair, and then we will mark the next targets at the top. If the day closes below the Tenkan line, there will be a real possibility of a second attempt to exit down from the Ichimoku cloud and break through the 89 exponent. H4 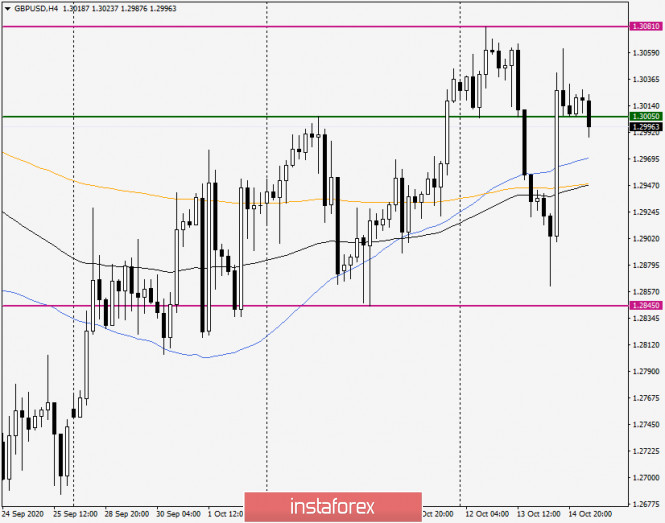
In the four-hour timeframe, the pair went up the used moving averages (89 EMA, 200 EMA and 50 MA), and at the end of the review, it shows the intention to roll back to the moving averages broken the day before. If this happens, the pair may find strong support around 1.2970 and turn up. Moving on to the trading recommendations, it is important to note that the situation for the pound is just as uncertain as for the euro/dollar. Based on this, it is better to consider both positioning options or stay out of the market until the situation is clarified. For those who want to trade, it is advisable to consider purchases after a short-term decline in the price zone of 1.2975-1.2960. At the same time, sales will become relevant after the rise to the strong and important price zone of 1.3000-1.3050 and the appearance of bearish reversal patterns of candle analysis there. We will return to the consideration of the pound/dollar currency pair tomorrow. For all we know, the situation might become more clear and trading recommendations might become more unambiguous. EUR/USD: The risk of another lockdown in Europe limits the euro's upside potential. Meanwhile, the IMF urges states to increase spending. 2020-10-15 The latest data on eurozone industrial production is both positive and negative, as on the one hand, the indicator continues to grow, but on the other, a slowdown has been observed. In addition, the increasing incidence rate in Europe does not give optimism. The report published by the Eurostat said that industrial production in the eurozone increased by 0.7% in August compared to July, but decreased by 7.2% compared to the same period last year.  Economic forecasts for Germany were also revised for the worse, and this is because the Ifo Institute, as well as other German research organizations, have noticed that the economic consequences of the coronavirus have become longer. Thus, they said that the German GDP will shrink by 5.4% instead of only 4.2%, and grow by 4.7%, not 5.8% in 2021. The slow recovery in investments, as well as problems in export are two of the main factors behind the downward revision of forecasts. 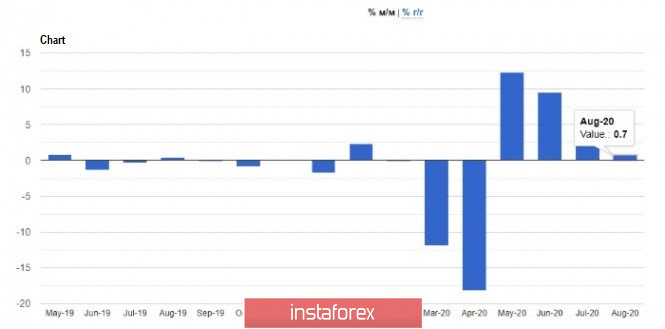 Another factor that limits the growth potential of the euro is the risk of another lockdown in Europe, which continues to increase as many states relentlessly record high numbers of coronavirus infections. Aside from that, the situation in the United States will also be taken into consideration, because if investors feel that the US has dealt with the problem better, the potential for a recovery in the European currency will be further limited. In that regard, German Chancellor, Angela Merkel, gave a statement regarding Germany's intentions to avoid a second outbreak, calling for continued compliance with infection safety measures. According to her, the country is not ready to afford another lockdown, as the consequences of a second quarantine will be catastrophic. Meanwhile, the International Monetary Fund issued a statement yesterday, urging countries to increase their government spending to help support the full recovery of the world economy. However, such will also bring the global public debt to a record level, much higher than the current forecast, which is 100% of GDP by the end of 2020. The current plan of the United States fulfills this matter though, as recently, the US government proposed a new stimulus package in the amount of $ 2 trillion. However, this is not final yet, as negotiations on its amount are still ongoing. Secretary of the Treasury Steven Mnuchin talked with House Speaker Nancy Pelosi about this, however, it was unsuccessful as both parties failed to agree on a number of key issues, including the amount to be allocated. With regards to economic statistics, the latest data on US PPI was published yesterday, the report of which revealed a much better figure than the forecasts. The data said that final demand in the US rose by 0.4% in September compared with the previous month, and was exactly the same as the core index, which does not take into account volatile categories of goods. Compared to the same period last year, the overall PPI rose 0.4%, while the core index rose 1.2%. As for the technical picture of the EUR / USD pair, growth will continue if the euro manages to consolidate above the resistance level of 1.1760. Only after that will the quote reach the local weekly high which is 1.1830, but before that it is necessary to overcome the level of 1.1790 first. The pair could decline though if the euro moves below 1.1720, as such will bring the quote to lows 1.1680 and 1.1640. Trading recommendations for GBP/USD pair on October 15 2020-10-15 The pound/dollar pair showed super-high activity yesterday, which resulted in the formation of an inertial upward movement in the direction of the psychological level of 1.3000. The dynamics are directly related to the information noise – Brexit, where the price sharply changes in accordance with the incoming data. In fact, we have a direct interaction of speculators with the quote, in its local consideration The dynamics are extremely high and the quote easily passes hundreds of points. Thus, it is a useless idea to talk about the week-month perspective now, if we can pass a sufficient number of points in the period of one day and stay in tact with the market. The market development is based on short-term positions, where the trading signal is based on the levels of price interaction with market participants, as well as information noise, where the second element is considered the main incentive for speculative surges. Analyzing yesterday's fifteen-minute period, a round of long positions appeared in the period 7:15-14:30 UTC+00, where an inertial move was recorded with a local high of 1.3062. After that, there was a pullback towards the level of 1.3000. In fact, a recovery was obtained relative to the decline last October 13. The movement took the form of a V-shaped pattern, where the role of resistance, as before, is played by the maximum correction in the form of the 1.3060/1.3080 area. In terms of daily dynamics, the highest indicator for 24 trading days was recorded yesterday. It amounted to 200 points, which is 63% higher than the average. The speculative position ratio had a high level, which is confirmed by the volatility. As discussed in the previous analytical review, traders were prepared for high activity and knew that a strong information background was expected, on which they could earn money on the principle of speculative price surges. On the other hand, information noise can be detected by monitoring resources such as Bloomberg, Wall Street Journal, Reuters, CNN for hot topics like Brexit, COVID, statements of influential persons from the EU, USA and Britain. Considering the trading chart in general terms (daily period), we can see that the corrective movement from the local low of 1.2674 is still relevant, while the quote is still at its conditional high. Yesterday's news background had data on US producer prices, where the decline was replaced by a growth of 0.4%, which will positively affect the US dollar in the future. The market did not react at the time of publication of the data due to the strong information noise. In terms of the information background, Brexit served as a hot news, where British Prime Minister Boris Johnson said during his telephone conversation with the head of the European Commission (EC) Ursula von der Leyen, that London would not abandon trade negotiations with the EU in the form of an immediate decision. Moreover, he expressed disappointment at the lack of new success in the negotiations between London and Brussels, but speculators considered all the noise only as to the fact that there will still be negotiations and London will not make an exit without a deal right now. In turn, Ursula von der Leyen noted that the EU is working on a deal, but not on getting it at any cost. The conditions must be suitable in terms of fishing, common rules and management.  Speculators' attention is focused on the EU summit today and tomorrow, where the main topic will be Brexit. Thus, it is worth paying close attention to the comments and statements, as they may lead to impulse changes in the market. We should also continue monitoring these resources: Bloomberg, Wall Street Journal, Reuters, and CNN for hot topics. In terms of statistics, the US weekly data on claims for unemployment benefits will be released today, which is expected to be not bad. Initial applications can be reduced from 840,000 to 825,000, while repeated applications can be reduced from 10,976,000 to 10,700,000. Further development Analyzing the current trading chart, you can see the pullback process relative to yesterday's activity surge, where the quote is trying to consolidate below the psychological level of 1.3000. In terms of technical analysis, focusing the price below 1.3000 may open the prospect of a decline towards 1.2950, which would be logical in terms of recovery. In turn, Brexit's information background can make adjustments to technical analysis in the form of speculative surge, where it is worth carefully monitoring the incoming information. 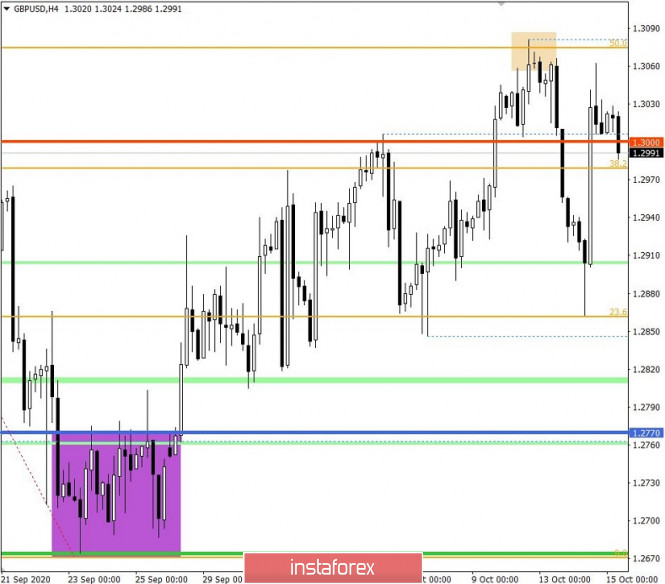 Indicator analysis Analyzing different sectors of time frames (TF), we see that the minute and hourly TFs have a variable buy/sell signal due to high activity and the recovery process. Meanwhile, the daily TF still has a buy signal by focusing within the level of 1.3000. 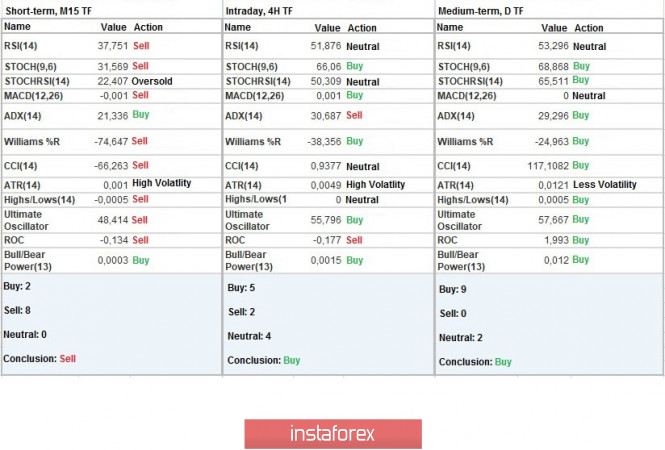 Weekly volatility / Volatility measurement: Month; Quarter; Year The volatility measurement reflects the average daily fluctuations, calculated per Month / Quarter / Year. (It was built considering the publication time of the article) The dynamics of the current time is 42 pips, but if we consider the anticipating position of speculators, we can assume that the volatility will grow further. 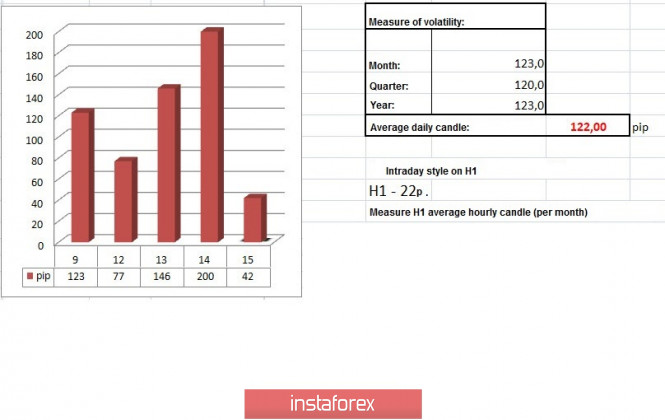 Key levels Resistance zones: 1.3000 ***; 1.3200; 1.3300 **; 1.3600; 1.3850; 1.4000 ***; 1.4350 **. Support zones: 1.3000 ***; 1.2770 **; 1.2620; 1.2500; 1.2350 **; 1.2250; 1.2150 **; 1.2000 *** (1.1957); 1.1850; 1.1660; 1.1450 (1.1411). * Periodic level ** Range level *** Psychological level Trading idea for the GBP/USD pair 2020-10-15 
A strong bullish momentum went through the pound yesterday, from which long positions can be opened after a pullback. 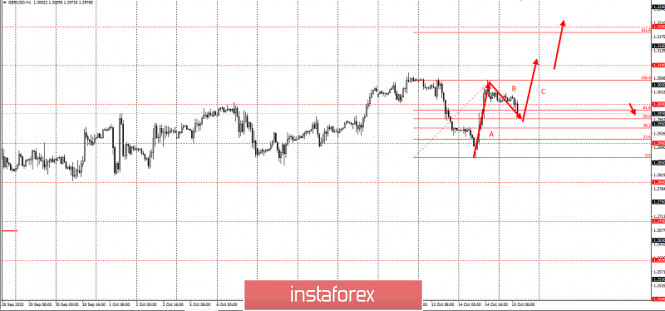
In fact, a three-wave pattern has already formed on the daily chart, with which wave A is the strong bullish impulse recorded yesterday. If long positions are opened along the 50% retracement zone, profit will be 2: 1, especially if the quote reaches the first target, which is 1.31. Stopping at the level of 1.29, on the other hand, will increase the risk. The main target of this bullish strategy is the round level of 1.35. Good luck! EUR/USD: US dollar is a victim of the presidential election 2020-10-15  The situation of the US dollar has developed inconsistently. On the one hand, it shows significant volatility, rising and falling periodically, while on the other hand, it is completely tired of the "up and down" movement. What worsens the situation is the upcoming US presidential elections, which can increase the imbalance in the EUR/USD pair. Several analysts believe that if Joe Biden, the main rival of the current US President Donald Trump, wins the election, it will threaten the US dollar's further upward trend. The USD may sharply decline if the victory will be taken by the Democratic Party. At the same time, experts are sure that the dollar will take care of the preservation of political issues and uncertainty after the presidential election. The outlook for the US currency does not look very positive ahead of the elections, but rather unbalanced, which makes the market worried. According to Commerzbank analysts, investors and traders should slightly step back from the dollar and not rely on it anytime soon. They believe that the dollar's stability is deceiving, since it is supported by Fed's recent cut in interest rates and expansion of its asset-buying program. Against this background, an imbalance arises in the EUR/USD pair, contributing to the manipulation of the euro exchange rate (artificial undervaluation) and the dollar exchange rate (overvaluation). Experts say that the global monetary policy of central banks has now many points of contact. According to Commerzbank, the ECB's monetary strategy is not too different from that of the Fed. They believe that this will help strengthen the euro next year. Based on the calculations of specialists, the EUR/USD pair will strengthen to 1.2100 by December of this year, and to 1.2400 by the end of 2021. But the indicated pair is far from these indicators at the moment. Today, the EUR/USD pair was trading near the range of 1.1734-1.1735, trying to move higher. However, these attempts were unsuccessful, and so it declined to the level of 1.1715. Earlier, experts expected the EUR/USD pair to correct to this level, emphasizing that the rates aimed at divergence in economic growth and in the monetary policy of Central banks will be ineffective, after the presidential election. In this regard, many market players began to get rid of long positions in the EUR/USD pair, which led to its correction. The US currency, whose dynamics is strongly dependent on the result of the presidential elections, remains highly volatile. Experts summarize that its dynamics in the short and medium term will depend on the correctly chosen direction. For now, the USD continues to be a victim of the upcoming elections, anxiously waiting along with other currencies. Trading idea for gold 2020-10-15  Technical analysis shows that although long positions were set at good price levels, the stops were not reached during the US trading session, which appears to be a bull trap in gold. Because of this, it would be best to transfer into short positions, in order to falsely drop stop loss at the level of 1872: 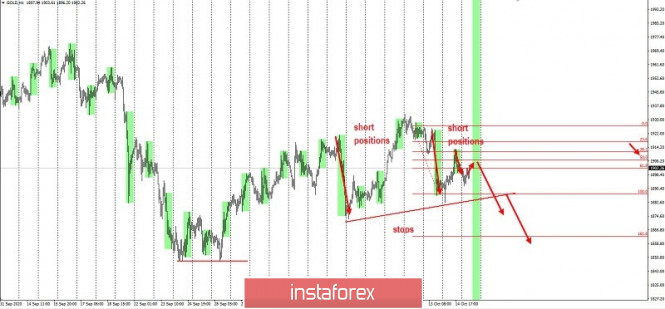 In fact, there is already a three-wave pattern on the daily chart, with which wave A is the strong bearish impulse on October 13. Gold already tested half of this course yesterday, and if it continues to reach the price level of 1872, rather good profit will be obtained. However, if it reaches a quote of 1922, the risk/reward ratio will be 1.5:1. This strategy follows the Price Action and Stop Hunting methods. Good luck! Analysis of EUR/USD on October 15. Americans started a presidential pre-voting three weeks before the Election Day 2020-10-15 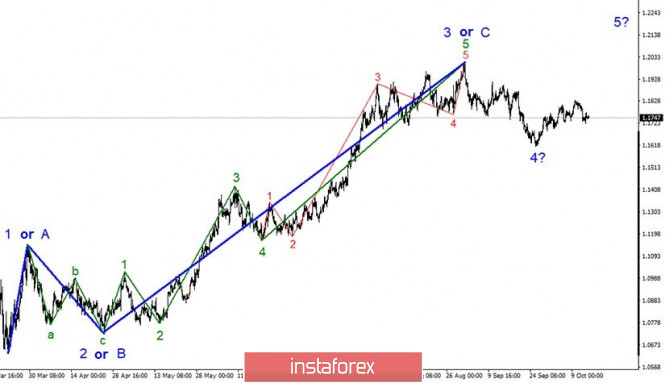 Globally, the wave pattern of the EUR/USD pair still looks quite convincing, and wave 4 is quite complete. Thus, the main option remains to increase quotes from the current levels within the framework of building wave 5 with goals located above the high of the expected wave 3 or C. This means that the indicated pair will increase to at least 20 figures, and most likely even higher. On the other hand, adopting a more complex form of wave 4 is currently not considered. 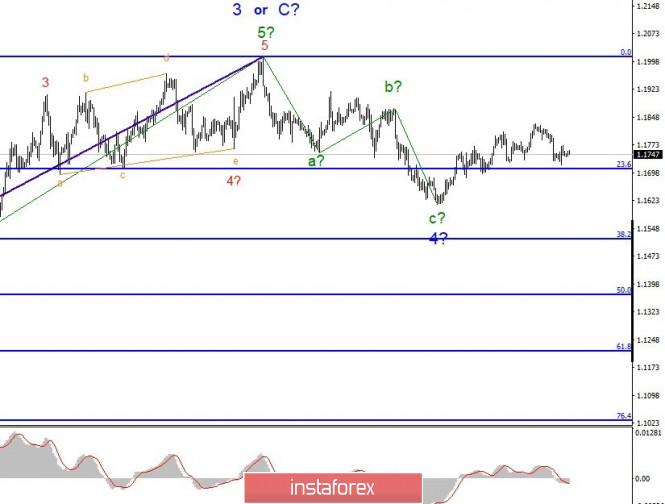 On a smaller time frame, the wave pattern still shows that the supposed wave 4 has taken on a three-wave form and is probably completed. If this is true, the quotes' growth will continue within wave 5. However, there are doubts recently that the quotes' growth is indeed inside the wave 5. It is quite possible that wave 4 becomes more complex and takes the form a-b-c-d-e. This option is supported by the fact that the pair failed to break through the high of wave b at 4. If this assumption is correct, then the current positions will let the quotes to further decline. In terms of news background, we are filled with news which is why it is extremely difficult to understand which of them influence the mood of the markets and which do not. For example, there is a report today that more than 15 million Americans have already taken part in the so-called pre-election. According to preliminary estimates and according to the statements of the officials of the election commissions, Joe Biden had the majority vote, but the Republicans didn't panic. Donald Trump's representatives believe that there is nothing wrong with the fact that Biden may be ahead initially, since only the overall, final results will matter, which may be completely opposite. However, it is very hard to say which of the candidates is supported by the dollar itself. The wave pattern is getting confused and it is absolutely unclear now whether a new descending wave will be built as part of 4 or whether the complex wave 5 will continue to build. Today, economic statistics are not expected either in the US or Europe, but Christine Lagarde's speech tonight might affect trading if she reports something new regarding monetary policy and the EU economy. General conclusions and recommendations: The euro/dollar pair has presumably completed the construction of corrective wave 4. However, if the high of wave b at 4 is not broken, a possible complication of the entire wave 4 will be likely. Thus, I still recommend buying this pair with targets located near the calculated level of 1.2012, equating to 0.0% Fibonacci. US Dollar Index and the "main" cross-instrument EUR/GBP - h4. Comprehensive analysis of APLs & ZUP traffic options from October 16, 2020 2020-10-15 Operational scale Minute (h4 timeframe ) Second half of October - the dollar index #USDX and the GBP in the h4 timeframe - What's next? - Review of traffic options from October 16, 2020 ____________________ US Dollar Index The development of the movement of the dollar index #USDX from October 16, 2020 will continue in the equilibrium zone (92.72 - 93.30 - 93.88) forks of the operational scale Minute, taking into account the development and direction of the breakdown of the range: - resistance level 93.75 on the lower border of the channel 1/2 Median Line operating scale forks Minuette
- support level 93.60 on the initial line SSL operating scale forks Minuette
The breakdown of the resistance level of 93.75 - continued development of the movement #USDX within the boundaries of the channel 1/2 Median Line Minuette (93.75 - 94.00 - 94.25) with the prospect of reaching the lower border ISL38.2 (94.65) zone equilibrium fork operational scale Minuette and c, then updating the local maximum 94.71. A joint breakdown of the support level of 93.75 on the initial SSL fork line of the Minuette operational scale and the Median Line Minute (93.30) will make it relevant to develop the movement of the dollar index towards the goals: - LTL Minuette control line (93.05); - local minimum 92.98; - lower limit ISL61.8 (92.72) of the fork equilibrium zone of the operational scale Minute; - the ultimate Shiff Line Minuette (92.50). 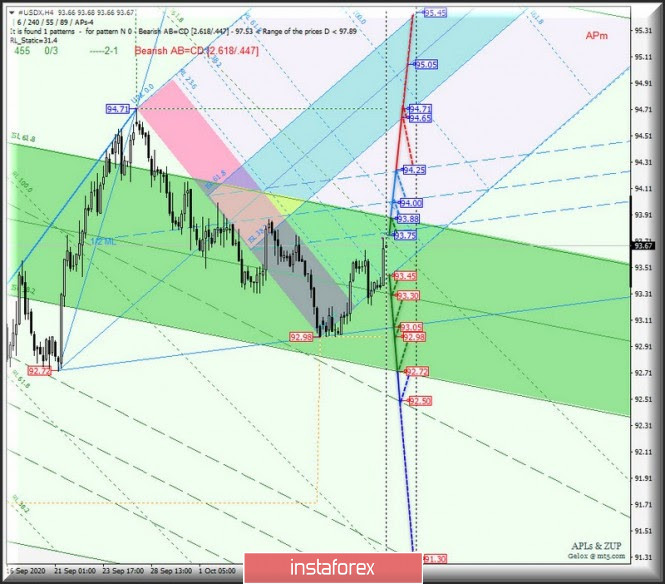 ___________________ Euro vs Great Britain Pound The movement of the "main" cross-instrument EUR/GBP from October 16, 2020 will also occur in the equilibrium zone (0.8965 - 0.9018 - 0.9070) forks of the operational scale Minute depending on the working out and direction of the range breakdown: - resistance level is 0.9136 on the initial SSL line of the operating scale fork Minuette
- support level is 0.9090 on the Median Line of the operating scale fork Minute
A breakdown of the Median Line Minute - support level 0.9018 - followed by a breakdown of the LTL control line (0.9010) of the Minuette operating scale forks - will determine the development of a downward movement of EUR/GBP to the lower border of ISL61.8 (0.8965) of the equilibrium zone of the Minute operating scale forks with the prospect of reaching the local minimum 0.8865. If the resistance level of 0.9060 is broken, the movement of the "main" cross-instrument will continue in the channel 1/2 Median Line Minuette (0.9060 - 0.9075 - 0.9090) with the possibility of reaching the boundaries of the equilibrium zone (0.9110 - 0.9135 - 0.9161) a fork of the Minuette operational scale. 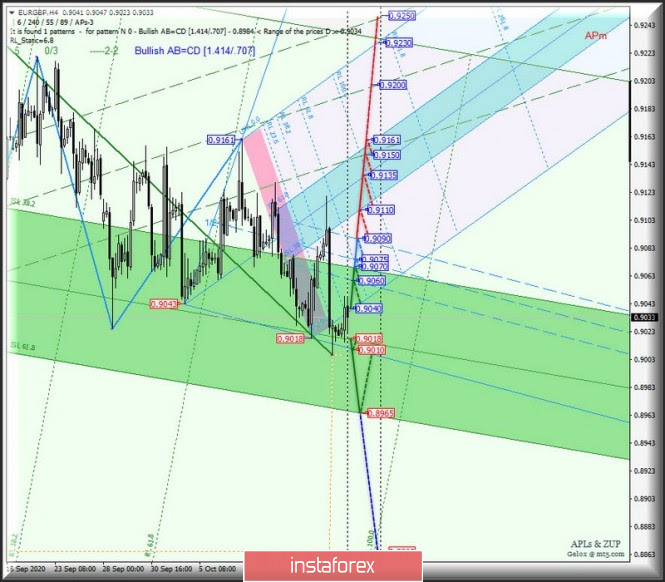 ____________________ The review is compiled without taking into account the news background, the opening of trading sessions of the main financial centers and is not a guide to action (placing "sell" or "buy" orders). EUR/USD analysis for October 15 2020 - Potential exhaustion of the downside movement today. Chance for the rally towards 1.1770 2020-10-15 This pretty much reaffirms the earlier report here, that there has been a slight change in language on the Brexit front by European leaders now that they expect the UK to also signal some intention to keep negotiations ongoing beyond this week. That said, just be mindful in case we get some 'drama' later today as the summit meeting is only scheduled for 1300 GMT. Further Development 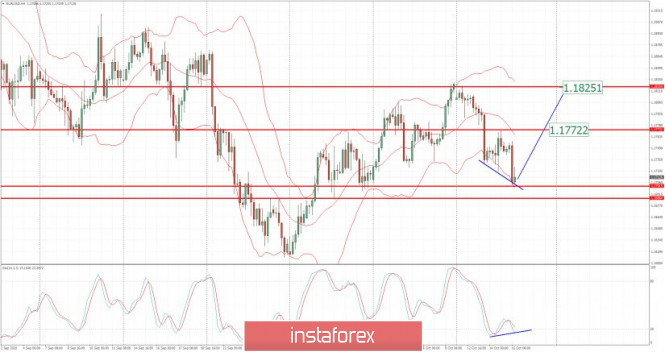
Analyzing the current trading chart of EUR, I found that there is the bullish divergence on the 4H time-frame in creation, which is sign that there is potential for the upside rotation. 1-Day relative strength performance Finviz 
Based on the graph above I found that on the top of the list we got VIX and Natural Gas today and on the bottom Crude Oil and Gasoline RBOB. Key Levels: Resistance: 1,1772 Support levels: 1,1700 and 1,1690 Analysis of Gold for October 15,.2020 - Potential end ot the downside correction. Upside movement is in play towards the $1.912 2020-10-15 - HICP 0.0% vs 0.0% y/y prelim
- HICP -0.6% vs -0.6% m/m prelim
A slight revision lower in headline annual inflation is the only change relative to the initial report, but it doesn't tell us anything new. Inflation pressures are subdued in September across the region and that continues to keep the ECB on their toes as the threat of deflation starts to creep in ahead of the year-end. Further Development 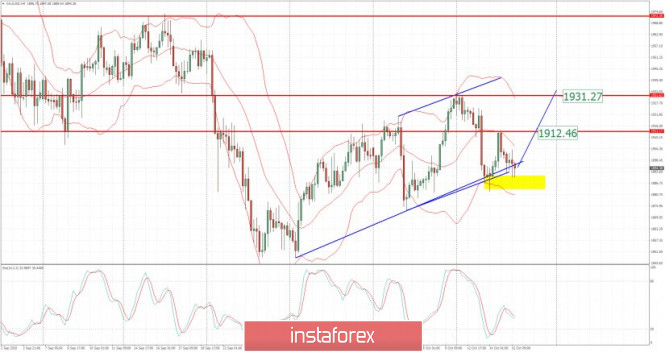
Analyzing the current trading chart of Gold, I found that there is successful rejection of the rising trendline and potential running flat downside correction completion. 1-Day relative strength performance Finviz 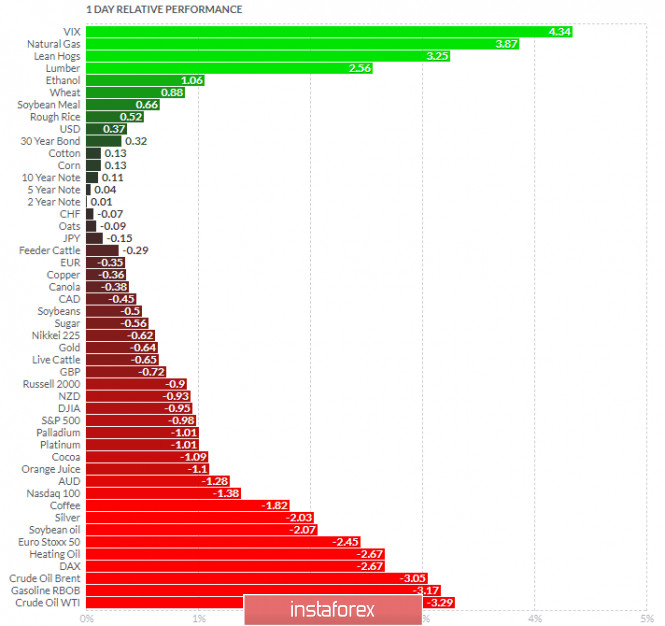
Based on the graph above I found that on the top of the list we got VIX and Natural Gas today and on the bottom Crude Oil and Gasoline RBOB. Key Levels: Resistance: $1,912 and $1,930 Support level: $1,890
Author's today's articles: Ivan Aleksandrov  Ivan Aleksandrov Ivan Aleksandrov Pavel Vlasov  No data No data Vladislav Tukhmenev  Vladislav graduated from Moscow State University of Technologiy and Management. He entered the forex market in early 2008. Vladislav is a professional trader, analyst, and manager. He applies a whole gamut of analysis – technical, graphical, mathematical, fundamental, and candlestick analysis. Moreover, he forecasts the market movements using his own methods based on the chaos theory. Vladimir took part in development of trading systems devoted to fractal analysis. In his free time, Vladimir blogs about exchange markets. Hobbies: active leisure, sporting shooting, cars, design, and marketing. "I do not dream only of becoming the best in my field. I also dream about those who I will take with me along the way up." Vladislav graduated from Moscow State University of Technologiy and Management. He entered the forex market in early 2008. Vladislav is a professional trader, analyst, and manager. He applies a whole gamut of analysis – technical, graphical, mathematical, fundamental, and candlestick analysis. Moreover, he forecasts the market movements using his own methods based on the chaos theory. Vladimir took part in development of trading systems devoted to fractal analysis. In his free time, Vladimir blogs about exchange markets. Hobbies: active leisure, sporting shooting, cars, design, and marketing. "I do not dream only of becoming the best in my field. I also dream about those who I will take with me along the way up." Andrey Shevchenko  Andrey Shevchenko Andrey Shevchenko l Kolesnikova  text text Alexander Dneprovskiy  Graduated from Kiev State University of Economics. On Forex market since 2007. Started his work at Forex as a trader. Since 2008 is working as a currency analyst. Graduated from Kiev State University of Economics. On Forex market since 2007. Started his work at Forex as a trader. Since 2008 is working as a currency analyst. Oleg Khmelevskiy  In 1986 graduated from the Taganrog Institute of Technology. Oleg has been working on Forex market since 2007. He has been engaged in the technical analysis for three years using ZUP©nen indicator platform and DML&EWA©Putnik technology. Oleg is a financial analyst of Forex Trading Portal MT5.com and a moderator of ruforum.mt5.com. He administrates "ZUP analysis" (major currency pairs and gold) thread on the forum. Nickname Gelox. Interests: literature, music, cinema. «Ignore the majority opinion. It is most likely false». Rene Descartes In 1986 graduated from the Taganrog Institute of Technology. Oleg has been working on Forex market since 2007. He has been engaged in the technical analysis for three years using ZUP©nen indicator platform and DML&EWA©Putnik technology. Oleg is a financial analyst of Forex Trading Portal MT5.com and a moderator of ruforum.mt5.com. He administrates "ZUP analysis" (major currency pairs and gold) thread on the forum. Nickname Gelox. Interests: literature, music, cinema. «Ignore the majority opinion. It is most likely false». Rene Descartes Petar Jacimovic  Petar was born on July 08, 1989 in Serbia. Graduated from Economy University and after has worked as a currency analyst for large private investors. Petar has been involved in the world of finance since 2007. In this trading he specializes in Volume Price Action (volume background, multi Fibonacci zones, trend channels, supply and demand). He also writes the market analytical reviews for Forex forums and websites. Moreover Petar is forex teacher and has wide experience in tutoring and conducting webinars. Interests : finance, travelling, sports, music "The key to success is hard work" Petar was born on July 08, 1989 in Serbia. Graduated from Economy University and after has worked as a currency analyst for large private investors. Petar has been involved in the world of finance since 2007. In this trading he specializes in Volume Price Action (volume background, multi Fibonacci zones, trend channels, supply and demand). He also writes the market analytical reviews for Forex forums and websites. Moreover Petar is forex teacher and has wide experience in tutoring and conducting webinars. Interests : finance, travelling, sports, music "The key to success is hard work"
Subscription's options management Theme's:
Fundamental analysis, Fractal analysis, Wave analysis, Technical analysis, Stock Markets
Author's :
A Zotova, Aleksey Almazov, Alexander Dneprovskiy, Alexandr Davidov, Alexandros Yfantis, Andrey Shevchenko, Arief Makmur, Dean Leo, Evgeny Klimov, Fedor Pavlov, Grigory Sokolov, I Belozerov, Igor Kovalyov, Irina Manzenko, Ivan Aleksandrov, l Kolesnikova, Maxim Magdalinin, Mihail Makarov, Mohamed Samy, Mourad El Keddani, Oleg Khmelevskiy, Oscar Ton, Pavel Vlasov, Petar Jacimovic, R Agafonov, S Doronina, Sebastian Seliga, Sergey Belyaev, Sergey Mityukov, Stanislav Polyanskiy, T Strelkova, Torben Melsted, V Isakov, Viktor Vasilevsky, Vladislav Tukhmenev, Vyacheslav Ognev, Yuriy Zaycev, Zhizhko Nadezhda
Edit data of subscription settings
Unsubscribe from the mailing list Sincerely,
Analysts Service | If you have any questions, you can make a phone call using one of the
InstaForex Toll free numbers right now:
|  | InstaForex Group is an international brand providing online trading services to the clients all over the world. InstaForex Group members include regulated companies in Europe, Russia and British Virgin Islands. This letter may contain personal information for access to your InstaForex trading account, so for the purpose of safety it is recommended to delete this data from the history. If you have received this letter by mistake, please contact InstaForex Customer Relations Department. |


No comments:
Post a Comment