

Option trading is such a trip. Sure, there is lots to learn, but your expectation changes anything and everything. Know with a certainty you are going to grasp it all and do well. True success is not just a function of understanding trading and finding order, logic, and synchronicity in it. True success is understanding that your viewpoint, your knowing, your expectations of order, logic, and synchronicity is what creates your success, creates your world.
Here’s What Is Covered Below:
- What are Pivot Points?
- Why are They Important?
- Learn to Use the Indicator
- Pivot Points into Your Charts
Friday is education day. My goal is to teach everyday people (like me) to successfully trade options. I do my best to write in an understandable way as if we are talking while sitting on my deck in a relaxed atmosphere.
The trading tools you select and use are important, and can make your trading easier and more effective. Today, I am discussing Pivot Points.
Last week, we discussed Fibonacci Numbers and the information they provide on a stock’s chart when incorporated into indicators. We will also use them within the Pivot Point information, too.
I am going to post images further below of a couple charts, but first I want to discuss the concept of Pivot Points, so you understand what this means and how to use the information.
Last week, in addition to discussing Fibonacci numbers, we also discussed applying those number to the EMA (Exponential Moving Averages) on the charts. Today we are going to apply them to Pivot Points.
Pivot Points are significant levels you can use to determine directional movement and potential support/resistance levels on your charts. Pivot Points use the prior period's high, low and close to estimate future support and resistance levels. In this regard, Pivot Points are predictive or leading indicators. There are at least five different versions of Pivot Points. This article will focus on Standard Pivot Points and Fibonacci Pivot Points.
Pivot Points were originally used by floor traders to set key levels. Like modern-era day traders, floor traders dealt in a very fast-moving environment with a short-term focus. At the beginning of the trading day, floor traders would look at the previous day's high, low and close to calculate a Pivot Point for the current trading day. With this Pivot Point as the base, further calculations were used to set support 1, support 2, resistance 1, and resistance 2. These levels would then be used to assist their trading throughout the day. (Stockcharts.com)
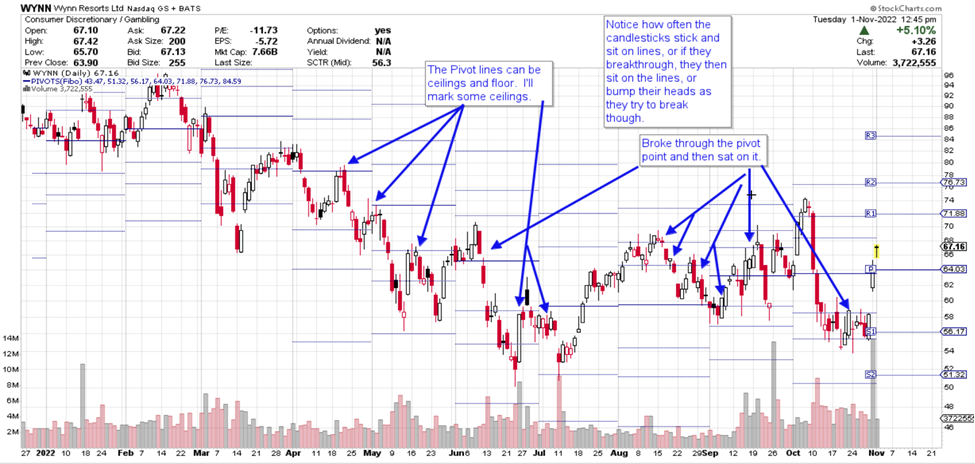
I think of these lines as ceilings and floors. The ceiling is apt to add a level of restraint from price going higher. It may not stop the price’s move entirely but is likely to cause a slowdown. If it pops through, then price is apt to come back down to test the level and now it has become a new floor offering support. If price drops, then the level becomes a floor. It may stop there and drop no further, but if it drops through it, as it comes back up that level will now be a ceiling.
It is as if price has a memory and recalls where it has been before and will slow down or stop for a while at that level.
I discussed Fibonacci numbers last week and their spiritual significance to me. The market has incorporated those numbers as an option, so if you select Fibonacci as your number choice by inserting an “F” it adds a third lines and calculates support and resistance using those numbers.
Again, these are Fibonacci numbers are 1 + 2 = 3, 2 + 3 = 5, 3 + 5 = 8, and so on- so, we have 1, 2, 3, 5, 8, 13, 21, 34, 55, 89, 144, 233…
I am going to insert an “F” into the Pivot Point indicator so that it inserts Fibonacci numbers into the Pivot Points. Again, think of these numbers as ceilings and floors and notice how often price in its moves stops there or if it breaks through, it then tests that area as the opposite.
Stockcharts.com set-up:

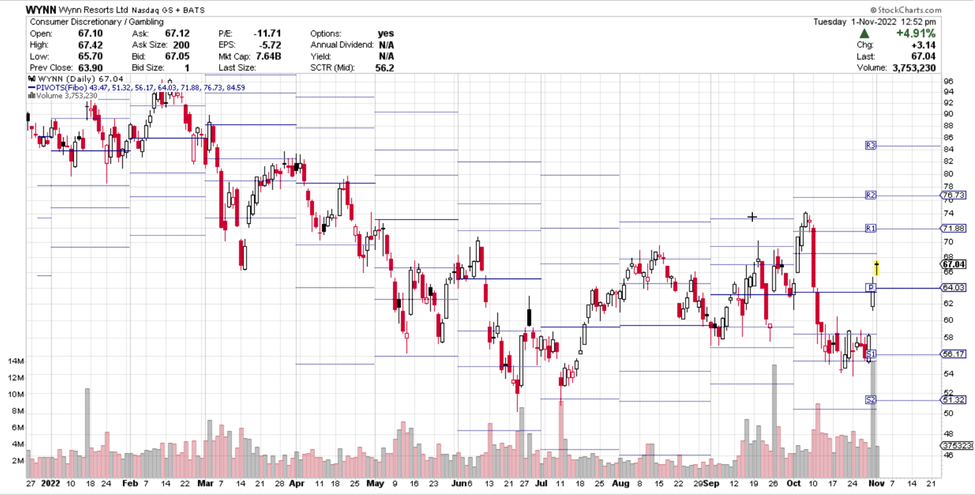
On the charts below, you will see that the Pivot Point lines. There is the darker line which is a middle point Pivot (P). The upper lines are Resistance lines (R1, R2, R3) and the lower Support lines (S1, S2, S3).
Stockcharts.com
Notice how often price stops at the ceilings and floors and will sit there until it eventually drops or rises further. Using these lines helps to anticipate what will happen to price next.
The wisest thing you can do every moment of the day is to be on your own side. Know you are a great trader, that you follow your trade rules and have awesome trade results. Wow, look at you!
I wish you the very best,
Wendy
See Related Articles on TradeWinsDaily.com
Latest QQQ Move Shows Potential Trade
Chart of the Day: Electronic Arts (EA)
© 2022 Tradewins Publishing. All rights reserved. | Privacy Policy | Terms and Conditions | Contact Us
The information provided by the newsletters, trading, training and educational products related to various markets (collectively referred to as the "Services") is not customized or personalized to any particular risk profile or tolerance. Nor is the information published by Wendy Kirkland a customized or personalized recommendation to buy, sell, hold, or invest in particular financial products. Past performance is not necessarily indicative of future results. Trading and investing involve substantial risk and is not appropriate for everyone. The actual profit results presented here may vary with the actual profit results presented in other Wendy Kirkland publications due to the different strategies and time frames presented in other publications. Trading on margin carries a high level of risk, and may not be suitable for all investors. Other than the refund policy detailed elsewhere, Wendy Kirkland does not make any guarantee or other promise as to any results that may be obtained from using the Services. Wendy Kirkland disclaims any and all liability for any investment or trading loss sustained by a subscriber. You should trade or invest only "risk capital" - money you can afford to lose. Trading stocks and stock options involves high risk and you can lose the entire principal amount invested or more. There is no guarantee that systems, indicators, or trading signals will result in profits or that they will not produce losses.
Some profit examples are based on hypothetical or simulated trading. This means the trades are not actual trades and instead are hypothetical trades based on real market prices at the time the recommendation is disseminated. No actual money is invested, nor are any trades executed. Hypothetical or simulated performance is not necessarily indicative of future results. Hypothetical performance results have many inherent limitations, some of which are described below. Also, the hypothetical results do not include the costs of subscriptions, commissions, or other fees. Because the trades underlying these examples have not actually been executed, the results may understate or overstate the impact of certain market factors, such as lack of liquidity. Wendy Kirkland makes no representations or warranties that any account will or is likely to achieve profits similar to those shown. No representation is being made that you will achieve profits or the same results as any person providing a testimonial. Testimonials relate to various other products offered by Wendy Kirkland and not the product offered here, but all of these products are based on Wendy Kirkland's system. Performance results of other products described in such testimonials may be materially different from results for the product being offered and may have been achieved before the product being offered was developed.
Results described in testimonials from other products or the product being offered may not be typical or representative of results achieved by other users of such products. No representation is being made that any of the persons who provide testimonials have continued to experience the same level of profitable trading after the date on which the testimonial was provided. In fact, such persons may have experienced losses immediately thereafter or may have experienced losses preceding the period of time referenced in the testimonial. No representation is being made that you will achieve profits or the same results as any person providing a testimonial. Wendy Kirkland's experiences are not typical. Wendy Kirkland is an experienced investor and your results will vary depending on risk tolerance, amount of risk capital utilized, size of trading position, willingness to follow the rules and other factors.
|


No comments:
Post a Comment